

Gravity
Sanitary Sewer
Design
and Construction
Second Edition
Prepared by a Joint Task Force of the
Environmental and Water Resources Institute and the
Pipeline Division Committee on Pipeline Planning of the
American Society of Civil Engineers
and the
Collection Systems Subcommittee of the
Technical Practice Committee of the
Water Environment Federation
Edited by Paul Bizier
ASCE Manuals and Reports on Engineering Practice No. 60
WEF Manual of Practice No. FD-5

Library of Congress Cataloging-in-Publication Data
Gravity sanitary sewer design and construction : ASCE manuals and reports on engineering
practice no. 60 wef manual of practice no. fd-5/ Prepared by the Joint Task Force on Sanitary
Sewers of the American Society of Civil Engineers and the Water Environment Federation
p. cm — (Wef manual ; no. 60)
Includes bibliographical references and index.
ISBN 13: 978-0-7844-0900-8
ISBN 10: 0-7844-0900-5
1. Sewerage—Design and construction. I. Bizier, Paul. II. American Society of Civil
Engineers. III. Water Environment Federation.
TD678.G715 2007
628′.2—dc22
2007015717
Published by American Society of Civil Engineers
1801 Alexander Bell Drive
Reston, Virginia 20191
www.pubs.asce.org
Any statements expressed in these materials are those of the individual authors and do
not necessarily represent the views of ASCE or WEF, which take no responsibility for any
statement made herein. No reference made in this publication to any specific method, prod-
uct, process, or service constitutes or implies an endorsement, recommendation, or warranty
thereof by ASCE or WEF. The materials are for general information only and do not repre-
sent a standard of ASCE or WEF, nor are they intended as a reference in purchase specifica-
tions, contracts, regulations, statutes, or any other legal document.
ASCE and WEF make no representation or warranty of any kind, whether express or
implied, concerning the accuracy, completeness, suitability, or utility of any information,
apparatus, product, or process discussed in this publication, and assume no liability therefor.
This information should not be used without first securing competent advice with respect to
its suitability for any general or specific application. Anyone utilizing this information
assumes all liability arising from such use, including but not limited to infringement of any
patent or patents.
ASCE and American Society of Civil Engineers—Registered in U.S. Patent and Trademark
Office.
Water Environment Research, WEF, and WEFTEC are registered trademarks of the Water
Environment Federation.
Photocopies and reprints. You can obtain instant permission to photocopy ASCE publica-
tions by using ASCE’s online permission service (www.pubs.asce.org/authors/Rightslink
WelcomePage.htm). Requests for 100 copies or more should be submitted to the Reprints
Department, Publications Division, ASCE (address above); email: [email protected]. A
reprint order form can be found at www.pubs.asce.org/authors/reprints.html.
Copyright © 2007 by the American Society of Civil Engineers and the Water Environ-
ment Federation. Permission to copy must be obtained from both ASCE and WEF.
All Rights Reserved.
ISBN 978-0-7844-0900-8
ISBN 978-1-57278-240-2
Manufactured in the United States of America.

American Society of Civil Engineers/
Environmental and Water Resources Institute
Founded in 1852, the American Society of Civil Engineers (ASCE) rep-
resents more than 140,000 members of the civil engineering profession
worldwide, and is America’s oldest national engineering society. Created
in 1999, the Environmental and Water Resources Institute (EWRI) is an
Institute of ASCE. EWRI services are designed to complement ASCE’s tra-
ditional civil engineering base and to attract new categories of members
(non-civil engineer allied professionals) who seek to enhance their profes-
sional and technical development.
For information on membership, publications, and conferences, contact
ASCE/EWRI
1801 Alexander Bell Drive
Reston, VA 20191-4400
(703) 295-6000
http://www.asce.org
Water Environment Federation
Formed in 1928, the Water Environment Federation (WEF) is a not-for-
profit technical and educational organization with 32,000 individual
members and 80 affiliated Member Associations representing an addi-
tional 50,000 water quality professionals throughout the world. WEF and
its member associations proudly work to achieve our mission of preserv-
ing and enhancing the global water environment.
For information on membership, publications, and conferences, contact
Water Environment Federation
601 Wythe Street
Alexandria, VA 22314-1994 USA
(703) 684-2400
http://www.wef.org

MANUALS AND REPORTS
ON ENGINEERING PRACTICE
(As developed by the ASCE Technical Procedures Committee, July 1930,
and revised March 1935, February 1962, and April 1982)
A manual or report in this series consists of an orderly presentation of
facts on a particular subject, supplemented by an analysis of limitations
and applications of these facts. It contains information useful to the aver-
age engineer in his or her everyday work, rather than findings that may
be useful only occasionally or rarely. It is not in any sense a “standard,”
however; nor is it so elementary or so conclusive as to provide a “rule of
thumb” for nonengineers.
Furthermore, material in this series, in distinction from a paper (which
expresses only one person’s observations or opinions), is the work of a
committee or group selected to assemble and express information on a
specific topic. As often as practicable, the committee is under the direction
of one or more of the Technical Divisions and Councils, and the product
evolved has been subjected to review by the Executive Committee of
the Division or Council. As a step in the process of this review, proposed
manuscripts are often brought before the members of the Technical Divi-
sions and Councils for comment, which may serve as the basis for
improvement. When published, each work shows the names of the com-
mittees by which it was compiled and indicates clearly the several pro-
cesses through which it has passed in review, in order that its merit may
be definitely understood.
In February 1962 (and revised in April 1982) the Board of Direction
voted to establish a series entitled “Manuals and Reports on Engineering
Practice,” to include the Manuals published and authorized to date, future
Manuals of Professional Practice, and Reports on Engineering Practice. All
such Manual or Report material of the Society would have been refereed in
a manner approved by the Board Committee on Publications and would
be bound, with applicable discussion, in books similar to past Manuals.
Numbering would be consecutive and would be a continuation of present
Manual numbers. In some cases of reports of joint committees, bypassing
of Journal publications may be authorized.

13 Filtering Materials for Sewage Treat-
ment Plants
14 Accommodation of Utility Plant Within
the Rights-of-Way of Urban Streets
and Highways
35 A List of Translations of Foreign Litera-
ture on Hydraulics
40 Ground Water Management
41 Plastic Design in Steel: A Guide and
Commentary
45 How to Work Effectively with Consult-
ing Engineers
46 Pipeline Route Selection for Rural and
Cross-Country Pipelines
47 Selected Abstracts on Structural Appli-
cations of Plastics
49 Urban Planning Guide
50 Planning and Design Guidelines for
Small Craft Harbors
51 Survey of Current Structural Research
52 Guide for the Design of Steel Transmis-
sion Towers
53 Criteria for Maintenance of Multilane
Highways
54 Sedimentation Engineering
55 Guide to Employment Conditions for
Civil Engineers
57 Management, Operation and Mainte-
nance of Irrigation and Drainage
Systems
59 Computer Pricing Practices
60 Gravity Sanitary Sewer Design and Con-
struction (Second Edition)
62 Existing Sewer Evaluation and
Rehabilitation
63 Structural Plastics Design Manual
64 Manual on Engineering Surveying
65 Construction Cost Control
66 Structural Plastics Selection Manual
67 Wind Tunnel Studies of Buildings and
Structures
68 Aeration: A Wastewater Treatment
Process
69 Sulfide in Wastewater Collection and
Treatment Systems
70 Evapotranspiration and Irrigation Water
Requirements
71 Agricultural Salinity Assessment and
Management
72 Design of Steel Transmission Pole
Structures
73 Quality in the Constructed Project:
A Guide for Owners, Designers, and
Constructors
74 Guidelines for Electrical Transmission
Line Structural Loading
76 Design of Municipal Wastewater Treat-
ment Plants
77 Design and Construction of Urban
Stormwater Management Systems
78 Structural Fire Protection
179 Steel Penstocks
180 Ship Channel Design
181 Guidelines for Cloud Seeding to Aug-
ment Precipitation
182 Odor Control in Wastewater Treat-
ment Plants
183 Environmental Site Investigation
184 Mechanical Connections in Wood
Structures
185 Quality of Ground Water
186 Operation and Maintenance of Ground
Water Facilities
187 Urban Runoff Quality Manual
188 Management of Water Treatment Plant
Residuals
189 Pipeline Crossings
190 Guide to Structural Optimization
191 Design of Guyed Electrical Transmis-
sion Structures
192 Manhole Inspection and Rehabilitation
193 Crane Safety on Construction Sites
194 Inland Navigation: Locks, Dams, and
Channels
195 Urban Subsurface Drainage
196 Guide to Improved Earthquake Perfor-
mance of Electric Power Systems
197 Hydraulic Modeling: Concepts and
Practice
198 Conveyance of Residuals from Water
and Wastewater Treatment
199 Environmental Site Characterization
and Remediation Design Guidance
100 Groundwater Contamination by
Organic Pollutants: Analysis and
Remediation
101 Underwater Investigations
102 Design Guide for FRP Composite Con-
nections
103 Guide to Hiring and Retaining Great
Civil Engineers
104 Recommended Practice for Fiber-
Reinforced Polymer Products for
Overhead Utility Line Structures
105 Animal Waste Containment in
Lagoons
106 Horizontal Auger Boring Projects
107 Ship Channel Design
108 Pipeline Design for Installation by
Horizontal Directional Drilling
109 Biological Nutrient Removal (BNR)
Operation in Wastewater Treatment
Plants
110 Sedimentaion Engineering: Processes,
Measurments, Modeling, and
Practice
111 Reliability-Based Design of Utility Pole
Structures
112 Pipe Bursting Projects
113 Substation Structure Design Guide
MANUALS AND REPORTS
ON ENGINEERING PRACTICE
No. Title No. Title

Manuals of Practice of the
Water Environment Federation
The WEF Technical Practice Committee (formerly the Committee on
Sewage and Industrial Wastes Practice of the Federation of Sewage and
Industrial Wastes Associations) was created by the Federation Board of
Control on October 11, 1941. The primary function of the Committee is
to originate and produce, through appropriate subcommittees, special
publications dealing with technical aspects of the broad interests of the
Federation. These publications are intended to provide background infor-
mation through a review of technical practices and detailed procedures
that research and experience have shown to be functional and practical.
Water Environment Federation Technical Practice
Committee Control Group
B. G. Jones, Chair
J. A. Brown, Vice Chair
S. Biesterfeld-Innerebner
R. Fernandez
S. S. Jeyanayagam
Z. Li
M. D. Nelson
S. Rangarajan
E. P. Rothstein
A. T. Sandy
A. K. Umble
T. O. Williams
J. Witherspoon

vii
ABSTRACT
This Manual provides both theoretical and practical guidelines for the
design and construction of gravity sanitary sewers.
The initial chapter introduces the organization and administrative
phases of the sanitary sewer project. Subsequent chapters are presented in
a sequence detailing the parameters necessary to establish the design cri-
teria, complete the design, and award a construction contract. The Man-
ual concludes with a discussion of the commonly used trenchless and
conventional methods of sanitary sewer construction.
This Manual is intended to be of practical use to the designer of a grav-
ity sanitary sewer system and is based upon the experience of engineers
in the field of sanitary sewer structural and hydraulic design. Charts,
illustrations, and example problem solutions are used liberally through-
out to reinforce the text.

Joint Task Force on Sanitary Sewers
Richard Thomasson, Chairman, Chapter 6
Dennis Doherty, Vice-Chair, Chapter 12*
Paul Bizier, EWRI Liason, Chapters 6, 9
Marsha Slaughter, Secretary
Matt Cassel, Chapter 8*
Rao Chitikela
John Christopher, Chapter 8*
Jacques Delleur, Chapter 3*
John Duffy
Angie Essner, Chapter 7*
Mike Glasgow
James Joyce, Chapter 4*
Karen Karvazy, Chapter 10*
Lisa Lassi, Chapter 10*
LaVere Merritt, Chapter 3*
Terry Moy
Mike Murphy
Mohammad Najafi, Chapter 12*
Aaron Nelson, Chapters 2, 7*
Paul Passaro, Chapter 1*
Morris Sade
Sam Samandi, Chapter 9
Howard Selznick, Chapter 3*
Mark M. Smith, Chapter 4
Carl Sutter, Chapter 10*
John Trypus, Chapter 1*
Michael VanDine
In addition to the Task Force, Blue Ribbon Panel reviewers included:
Wayne Dillard, Burns & McDonnell
Terry Walsh, Greeley and Hanson
Heidi Dexheimer, G. C. Wallace, Inc.
Staff assistance was provided by Lorna Ernst for the Water Environment Federa-
tion and Suzanne Coladonato for the American Society of Civil Engineers.
*principal contributing author.

ix
FOREWORD . . . . . . . . . . . . . . . . . . . . . . . . . . . . . . . . . . . . . . . . . . . . . . . . xiii
1 ORGANIZATION AND ADMINISTRATION
OF SANITARY SEWER PROJECTS . . . . . . . . . . . . . . . . . . . . . . 1
1.1 Introduction . . . . . . . . . . . . . . . . . . . . . . . . . . . . . . . . . . . . . . . . . . . . 1
1.2 Definition of Terms and Classification of Sanitary Sewers . . . . . 2
1.3 Phases of Project Development . . . . . . . . . . . . . . . . . . . . . . . . . . . . 4
1.4 Interrelations of Project Development Phases . . . . . . . . . . . . . . . 6
1.5 Parties Involved in Design and Construction of Sanitary
Sewer Projects . . . . . . . . . . . . . . . . . . . . . . . . . . . . . . . . . . . . . . . . . . 7
1.6 Role of Parties in Each Phase . . . . . . . . . . . . . . . . . . . . . . . . . . . . . . 9
1.7 Control of Sanitary Sewer System Use . . . . . . . . . . . . . . . . . . . . . 10
1.8 Federal and State Planning and Funding Assistance . . . . . . . . . 12
1.9 Local Funding . . . . . . . . . . . . . . . . . . . . . . . . . . . . . . . . . . . . . . . . . . 13
1.10 Safety . . . . . . . . . . . . . . . . . . . . . . . . . . . . . . . . . . . . . . . . . . . . . . . . . . 16
1.11 National Environmental Policy Act of 1969 . . . . . . . . . . . . . . . . . 18
1.12 Capacity, Management, Operations, and
Maintenance (CMOM) . . . . . . . . . . . . . . . . . . . . . . . . . . . . . . . . . . . 19
1.13 Measurement Units . . . . . . . . . . . . . . . . . . . . . . . . . . . . . . . . . . . . . . 21
References . . . . . . . . . . . . . . . . . . . . . . . . . . . . . . . . . . . . . . . . . . . . . . 23
2 SURVEYS AND INVESTIGATIONS . . . . . . . . . . . . . . . . . . . . . 25
2.1 Introduction . . . . . . . . . . . . . . . . . . . . . . . . . . . . . . . . . . . . . . . . . . . . 25
2.2 Types of Information Required . . . . . . . . . . . . . . . . . . . . . . . . . . . . 26
2.3 Sources of Information . . . . . . . . . . . . . . . . . . . . . . . . . . . . . . . . . . . 28
2.4 Surveys for Different Project Phases . . . . . . . . . . . . . . . . . . . . . . . 30
2.5 Investigations . . . . . . . . . . . . . . . . . . . . . . . . . . . . . . . . . . . . . . . . . . . 32
References . . . . . . . . . . . . . . . . . . . . . . . . . . . . . . . . . . . . . . . . . . . . . 34
CONTENTS

3 QUANTITY OF WASTEWATER . . . . . . . . . . . . . . . . . . . . . . . . . 35
3.1 Introduction . . . . . . . . . . . . . . . . . . . . . . . . . . . . . . . . . . . . . . . . . . . . 35
3.2 Design Period . . . . . . . . . . . . . . . . . . . . . . . . . . . . . . . . . . . . . . . . . . 38
3.3 Population or Dwelling Unit Forecast . . . . . . . . . . . . . . . . . . . . . . 39
3.4 Land Use and/or Employee Forecasts . . . . . . . . . . . . . . . . . . . . . 41
3.5 Average Unit Flows . . . . . . . . . . . . . . . . . . . . . . . . . . . . . . . . . . . . . 42
3.6 Average Flows . . . . . . . . . . . . . . . . . . . . . . . . . . . . . . . . . . . . . . . . . . 45
3.7 Other . . . . . . . . . . . . . . . . . . . . . . . . . . . . . . . . . . . . . . . . . . . . . . . . . . 47
3.8 Infiltration/Inflow . . . . . . . . . . . . . . . . . . . . . . . . . . . . . . . . . . . . . . 50
3.9 Peak and Minimum Flows . . . . . . . . . . . . . . . . . . . . . . . . . . . . . . . . 51
3.10 Uncertainty in Forecasts . . . . . . . . . . . . . . . . . . . . . . . . . . . . . . . . . . 60
References . . . . . . . . . . . . . . . . . . . . . . . . . . . . . . . . . . . . . . . . . . . . . 61
4 CORROSION PROCESSES AND CONTROLS IN
MUNICIPAL WASTEWATER COLLECTION SYSTEMS . . . . 63
4.1 Introduction . . . . . . . . . . . . . . . . . . . . . . . . . . . . . . . . . . . . . . . . . . . . 63
4.2 Corrosion . . . . . . . . . . . . . . . . . . . . . . . . . . . . . . . . . . . . . . . . . . . . . . 63
4.3 Nonbiological Corrosion Processes . . . . . . . . . . . . . . . . . . . . . . . . 66
4.4 Microbiologically Induced Corrosion Processes . . . . . . . . . . . . . 83
4.5 Corrosion Prediction Models . . . . . . . . . . . . . . . . . . . . . . . . . . . . . 95
4.6 Sulfide Corrosion Control . . . . . . . . . . . . . . . . . . . . . . . . . . . . . . . . 98
References . . . . . . . . . . . . . . . . . . . . . . . . . . . . . . . . . . . . . . . . . . . . . 111
5 HYDRAULICS OF SEWERS . . . . . . . . . . . . . . . . . . . . . . . . . . . . . 113
5.1 Introduction . . . . . . . . . . . . . . . . . . . . . . . . . . . . . . . . . . . . . . . . . . . . 113
5.2 Terminology and Symbols . . . . . . . . . . . . . . . . . . . . . . . . . . . . . . . . 114
5.3 Hydraulic Principles . . . . . . . . . . . . . . . . . . . . . . . . . . . . . . . . . . . . . 116
5.4 Flow Resistance . . . . . . . . . . . . . . . . . . . . . . . . . . . . . . . . . . . . . . . . . 123
5.5 Self-Cleansing in Sanitary Sewers . . . . . . . . . . . . . . . . . . . . . . . . . 134
5.6 Design Computations . . . . . . . . . . . . . . . . . . . . . . . . . . . . . . . . . . . . 142
5.7 Hydraulic Continuity Through Manholes . . . . . . . . . . . . . . . . . . 152
5.8 Head Loss in Manholes . . . . . . . . . . . . . . . . . . . . . . . . . . . . . . . . . . 153
5.9 Water Surface Profiles . . . . . . . . . . . . . . . . . . . . . . . . . . . . . . . . . . . 154
5.10 Service Lateral Slopes . . . . . . . . . . . . . . . . . . . . . . . . . . . . . . . . . . . . 155
5.11 Partial Listing of Current Sewer Analysis/Design Software . . . . 156
Appendix . . . . . . . . . . . . . . . . . . . . . . . . . . . . . . . . . . . . . . . . . . . . . . 156
References . . . . . . . . . . . . . . . . . . . . . . . . . . . . . . . . . . . . . . . . . . . . . 161
6 DESIGN OF SANITARY SEWER SYSTEMS . . . . . . . . . . . . . . 165
6.1 Introduction . . . . . . . . . . . . . . . . . . . . . . . . . . . . . . . . . . . . . . . . . . . . 165
6.2 Energy Concepts of Sewer Systems . . . . . . . . . . . . . . . . . . . . . . . . 166
x CONTENTS

6.3 Combined Versus Separate Sewers . . . . . . . . . . . . . . . . . . . . . . . . 166
6.4 Layout of System . . . . . . . . . . . . . . . . . . . . . . . . . . . . . . . . . . . . . . . . 167
6.5 Curved Sanitary Sewers . . . . . . . . . . . . . . . . . . . . . . . . . . . . . . . . . . 170
6.6 Type of Conduit . . . . . . . . . . . . . . . . . . . . . . . . . . . . . . . . . . . . . . . . 177
6.7 Ventilation . . . . . . . . . . . . . . . . . . . . . . . . . . . . . . . . . . . . . . . . . . . . . 177
6.8 Depth of Sanitary Sewer . . . . . . . . . . . . . . . . . . . . . . . . . . . . . . . . . 177
6.9 Flow Velocities and Design Depths of Flow . . . . . . . . . . . . . . . . . 178
6.10 Infiltration/Inflow . . . . . . . . . . . . . . . . . . . . . . . . . . . . . . . . . . . . . . 179
6.11 Infiltration/Exfiltration and Low-Pressure Air Testing . . . . . . . 180
6.12 Design for Various Conditions . . . . . . . . . . . . . . . . . . . . . . . . . . . . 183
6.13 Relief Sewers . . . . . . . . . . . . . . . . . . . . . . . . . . . . . . . . . . . . . . . . . . . 185
6.14 Organization of Computations . . . . . . . . . . . . . . . . . . . . . . . . . . . . 185
References . . . . . . . . . . . . . . . . . . . . . . . . . . . . . . . . . . . . . . . . . . . . . 188
7 APPURTENANCES AND SPECIAL STRUCTURES . . . . . . . . 191
7.1 Introduction . . . . . . . . . . . . . . . . . . . . . . . . . . . . . . . . . . . . . . . . . . . . 191
7.2 Manholes . . . . . . . . . . . . . . . . . . . . . . . . . . . . . . . . . . . . . . . . . . . . . . 191
7.3 Bends . . . . . . . . . . . . . . . . . . . . . . . . . . . . . . . . . . . . . . . . . . . . . . . . . . 199
7.4 Junctions and Diversions . . . . . . . . . . . . . . . . . . . . . . . . . . . . . . . . . 200
7.6 Terminal Cleanouts . . . . . . . . . . . . . . . . . . . . . . . . . . . . . . . . . . . . . . 202
7.7 Service Laterals . . . . . . . . . . . . . . . . . . . . . . . . . . . . . . . . . . . . . . . . . 203
7.8 Check Valves and Relief Overflows . . . . . . . . . . . . . . . . . . . . . . . . 204
7.9 Siphons . . . . . . . . . . . . . . . . . . . . . . . . . . . . . . . . . . . . . . . . . . . . . . . . 207
7.10 Flap Gates or Duckbill Valves . . . . . . . . . . . . . . . . . . . . . . . . . . . . . 210
7.11 Sewers Above Ground . . . . . . . . . . . . . . . . . . . . . . . . . . . . . . . . . . . 210
7.12 Underwater Sewers and Outfalls . . . . . . . . . . . . . . . . . . . . . . . . . . 211
References . . . . . . . . . . . . . . . . . . . . . . . . . . . . . . . . . . . . . . . . . . . . . 220
8 MATERIALS FOR SEWER CONSTRUCTION . . . . . . . . . . . . . 223
8.1 Introduction . . . . . . . . . . . . . . . . . . . . . . . . . . . . . . . . . . . . . . . . . . . . 223
8.2 Sewer Pipe Materials . . . . . . . . . . . . . . . . . . . . . . . . . . . . . . . . . . . . 224
8.3 Pipe Joints . . . . . . . . . . . . . . . . . . . . . . . . . . . . . . . . . . . . . . . . . . . . . . 235
8.4 Summary . . . . . . . . . . . . . . . . . . . . . . . . . . . . . . . . . . . . . . . . . . . . . . 237
References . . . . . . . . . . . . . . . . . . . . . . . . . . . . . . . . . . . . . . . . . . . . . 237
9 STRUCTURAL REQUIREMENTS . . . . . . . . . . . . . . . . . . . . . . . . 239
9.1 General . . . . . . . . . . . . . . . . . . . . . . . . . . . . . . . . . . . . . . . . . . . . . . . . 239
9.2 Loads on Sewers Caused by Gravity Earth Forces . . . . . . . . . . . 240
9.3 Live Loads and Minimum Cover . . . . . . . . . . . . . . . . . . . . . . . . . . 265
9.4 Direct Design and Indirect Design . . . . . . . . . . . . . . . . . . . . . . . . . 276
9.5 Rigid Pipe Structural Design . . . . . . . . . . . . . . . . . . . . . . . . . . . . . . 277
CONTENTS xi

9.6 Flexible Pipe Structural Design . . . . . . . . . . . . . . . . . . . . . . . . . . . . 299
9.7 Installation . . . . . . . . . . . . . . . . . . . . . . . . . . . . . . . . . . . . . . . . . . . . . 329
References . . . . . . . . . . . . . . . . . . . . . . . . . . . . . . . . . . . . . . . . . . . . . 337
Bibliography . . . . . . . . . . . . . . . . . . . . . . . . . . . . . . . . . . . . . . . . . . . 338
10 CONSTRUCTION CONTRACT DOCUMENTS . . . . . . . . . . . 341
10.1 Introduction . . . . . . . . . . . . . . . . . . . . . . . . . . . . . . . . . . . . . . . . . . . . 341
10.2 Contract Drawings . . . . . . . . . . . . . . . . . . . . . . . . . . . . . . . . . . . . . . 343
10.3 Project Manual . . . . . . . . . . . . . . . . . . . . . . . . . . . . . . . . . . . . . . . . . . 353
References . . . . . . . . . . . . . . . . . . . . . . . . . . . . . . . . . . . . . . . . . . . . . 366
11 CONSTRUCTION METHODS . . . . . . . . . . . . . . . . . . . . . . . . . . . 367
11.1 Introduction . . . . . . . . . . . . . . . . . . . . . . . . . . . . . . . . . . . . . . . . . . . . 367
11.2 Project Costs . . . . . . . . . . . . . . . . . . . . . . . . . . . . . . . . . . . . . . . . . . . . 368
11.3 Construction Surveys . . . . . . . . . . . . . . . . . . . . . . . . . . . . . . . . . . . . 370
11.4 Site Preparation . . . . . . . . . . . . . . . . . . . . . . . . . . . . . . . . . . . . . . . . . 373
11.5 Open-trench Construction . . . . . . . . . . . . . . . . . . . . . . . . . . . . . . . . 373
11.6 Special Construction . . . . . . . . . . . . . . . . . . . . . . . . . . . . . . . . . . . . . 387
11.7 Sewer Appurtenances . . . . . . . . . . . . . . . . . . . . . . . . . . . . . . . . . . . 391
11.8 Project Acceptance . . . . . . . . . . . . . . . . . . . . . . . . . . . . . . . . . . . . . . 391
Bibliography . . . . . . . . . . . . . . . . . . . . . . . . . . . . . . . . . . . . . . . . . . . 394
12 TRENCHLESS DESIGN AND CONSTRUCTION . . . . . . . . . 395
12.1 Introduction and Comparison of Trenchless
Technology Methods . . . . . . . . . . . . . . . . . . . . . . . . . . . . . . . . . . . 395
12.2 Costs of Utility Construction Using Trenchless
Installation Methods . . . . . . . . . . . . . . . . . . . . . . . . . . . . . . . . . . . . 398
12.3 Design Considerations for Trenchless Pipeline
Construction Methods . . . . . . . . . . . . . . . . . . . . . . . . . . . . . . . . . . 400
12.4 Pipe Materials . . . . . . . . . . . . . . . . . . . . . . . . . . . . . . . . . . . . . . . . . 402
12.5 Horizontal Auger Boring . . . . . . . . . . . . . . . . . . . . . . . . . . . . . . . . 402
12.6 Pipe Ramming . . . . . . . . . . . . . . . . . . . . . . . . . . . . . . . . . . . . . . . . . 403
12.7 Pipe Jacking . . . . . . . . . . . . . . . . . . . . . . . . . . . . . . . . . . . . . . . . . . . 404
12.8 Horizontal Directional Drilling . . . . . . . . . . . . . . . . . . . . . . . . . . . 407
12.9 Microtunneling . . . . . . . . . . . . . . . . . . . . . . . . . . . . . . . . . . . . . . . . 409
12.10 Pilot-tube Microtunneling . . . . . . . . . . . . . . . . . . . . . . . . . . . . . . . 411
12.11 Pipe Bursting Method . . . . . . . . . . . . . . . . . . . . . . . . . . . . . . . . . . . 411
Note . . . . . . . . . . . . . . . . . . . . . . . . . . . . . . . . . . . . . . . . . . . . . . . . . . 413
Bibliography . . . . . . . . . . . . . . . . . . . . . . . . . . . . . . . . . . . . . . . . . . . 413
xii GRAVITY SANITARY SEWER DESIGN AND CONSTRUCTION

xiii
FOREWORD
In 1960, a joint committee of the Water Pollution Control Federation
(WPCF) and the American Society of Civil Engineers (ASCE) published
the Manual of Practice on the Design and Construction of Sanitary and
Storm Sewers. In 1964, a second joint committee was formed to revise and
expand the Manual; in 1969, the revised edition was published. In subse-
quent reprintings, the 1969 edition of the Manual was continuously
revised to provide information on improved and more current practices.
In 1978, the WPCF authorized preparation of this Manual of Practice
devoted to gravity sanitary sewers. In 1979, ASCE entered into an agree-
ment with WPCF to continue their joint publication relationship. Since that
time, the Water Environment Federation (WEF, formerly the WPCF) and
the Environmental and Water Resources Institute (EWRI) of ASCE have
continued to work together on joint publications. As a result, a joint com-
mittee of the Water Pollution Control Committee of EWRI, the Pipeline
Division of ASCE, and the Collection Systems Subcommittee of WEF’s
Technical Practice Committee was formed in 2004 to update this Manual.
This Manual should be considered by the practicing engineer as an aid
and a checklist of items to be considered in a gravity sanitary sewer proj-
ect, as represented by acceptable current procedures. It is not intended to
be a substitute for engineering experience and judgment, or a treatise
replacing standard texts and reference material.
In common with other manuals prepared on special phases of engi-
neering, this Manual recognizes that this field of engineering is con-
stantly progressing with new ideas, materials, and methods coming into
use. Other alternatives available to the designer of sanitary sewers
include vacuum, pressure, vacuum-pressure, and small-diameter grav-
ity sewers. It is hoped that users will present any suggestions for improve-
ment to the Technical Practice Committee of WEF, to EWRI, and to the
Pipeline Division of ASCE for possible inclusion in future revisions to
keep this Manual current.
The members of the Committee thank the reviewers of this Manual for
their assistance in submitting their suggestions for improvement.
This page intentionally left blank

1.1. INTRODUCTION
Wastewater treatment and collection systems are a major expenditure
of public funds, but the wastewater system’s function is rarely acknowl-
edged and sewers are seldom seen by the public. Sanitary systems are
essential to protecting the public health and welfare in all areas of concen-
trated population and development. Every community produces waste-
water of domestic, commercial, and industrial origin. Sanitary sewers
perform the vitally needed functions of collecting these wastewaters and
conveying them to points of treatment and disposal.
The various stages of design and construction of sanitary sewer pro-
jects require an understanding of the objectives of each stage of the project
and of the responsibilities and interests of the parties involved.
Separate sanitary and storm sewers are highly desirable and are used,
with few exceptions, in new systems. The major advantages of separate
systems, including wastewater treatment plants, are the protection of
watercourses from pollution and the exclusion of stormwater from the
treatment system with a consequent saving in treatment plant construction
and operating cost. Combined sewers are frequently encountered in older
communities where it may be extremely difficult or costly to provide sepa-
rate systems. Separation is desired, where economically feasible, to reduce
the magnitude of facilities and energy demand of treatment works.
Municipal sewer systems have been a major topic of regulatory interest
since the late 1990s with the introduction of the Sanitary Sewer Overflow
Rule and changes in financial accounting and reporting standards for
state and local governments. Under the provisions of the Clean Water Act
(CWA) of 1972 as amended, owners and operators of municipal waste-
water sewer systems are prohibited to release non-permitted discharges
CHAPTER 1
ORGANIZATION AND ADMINISTRATION
OF SANITARY SEWER PROJECTS
1

into receiving waters of the United States. A National Pollutant Discharge
Elimination System (NPDES) permit must be issued to include the allow-
able discharge points for treated wastewater, combined sewer overflows,
and emergency relief overflows. However, Section 301(a) of the CWA
does not include sufficient information to indicate if and when a sanitary
sewer overflow (SSO) might be permitted. The Environmental Protection
Agency (EPA) believes that the number of SSOs can be significantly
reduced through improved sewer system capacity, management, opera-
tion, and maintenance (CMOM). To address this important issue, the EPA
issued a Notice of Proposed Rulemaking on January 4, 2001 to introduce
the SSO Rule and CMOM Regulations. The proposed SSO Rule and
CMOM regulations would expand the NPDES permit requirements for
municipal sanitary sewer collection systems and clarify sanitary sewer
overflow prohibitions.
The proposed SSO Rule is intended to clarify the prohibition on SSO
discharges into the waters of the United States outlined in Section 301(a)
of the Clean Water Act. In June, 1999, the Government Accounting Stan-
dards Board (GASB) issued Statement 34 (GASB 34) which changed the
financial accounting and reporting standards for state and local govern-
ments. Of important relevance, the new standard requires that municipal-
ities record and report depreciation on their wastewater infrastructure
assets. Municipalities are required to use an asset management system
that maintains a current inventory of their wastewater and associated
sewer system infrastructure.
1.2. DEFINITION OF TERMS AND CLASSIFICATION
OF SANITARY SEWERS
The following terms as used in this Manual are defined in the Glossary—
Water and Wastewater Control Engineering (APHA 1981) as follows:
Building Drain: In plumbing, that part of the lowest horizontal piping
within a building that conducts water, wastewater, or stormwater to a
building sewer.
Building Sewer: In plumbing, the extension from the building drain to the
public sewer or other place of disposal. Also called House Connection.
Combined Sewer: A sewer intended to receive both wastewater and
storm or surface water.
Force Main: Liquid conveyance under pressure to raise liquid to the
desired elevation.
Intercepting Sewer: A sewer that receives dry-weather flow from a num-
ber of transverse sewers or outlets and, frequently, additional predeter-
2 GRAVITY SANITARY SEWER DESIGN AND CONSTRUCTION

mined quantities of stormwater (if from a combined system), and con-
ducts such waters to a point for treatment or disposal.
Lateral Sewer: A sewer that discharges into a branch or other sewer and
has no other common sewer tributary to it.
Main Sewer: (1) In larger systems, the principal sewer to which branch
sewers and submains are tributary; also called Trunk Sewer. In small
systems, a sewer to which one or more branch sewers are tributary.
(2) In plumbing, the public sewer to which the house or building sewer
is connected.
Relief Sewer: (1) A sewer built to carry flows in excess of the capacity of
an existing sewer. (2) A sewer intended to carry a portion of the flow
from a district that has insufficient sewer capacity to another sewer
with available capacity to prevent overloading and possible overflows.
Relief sewers may also be used to eliminate overflows to combined
sewer outfalls when they are constructed as part of a treatment plant
and expansion.
Sanitary Sewer: A sewer that carries liquid and waterborne wastes from
residences, commercial buildings, industrial plants, and institutions,
together with minor quantities of ground, storm, and surface waters
that are not admitted intentionally. See also Wastewater.
Separate Sewer: A sewer intended to receive only wastewater, storm-
water, or surface water. See also Combined Sewer, Sanitary Sewer,
and Storm Sewer.
Separate Sewer System: A sewer system carrying sanitary wastewater
and other waterborne wastes from residences, commercial buildings,
industrial plants, and institutions, together with minor quantities of
ground, storm, and surface waters that are not intentionally admitted.
See also Wastewater, Combined Sewer.
Storm Sewer: A sewer that carries stormwater and surface water, street
wash and other wash waters, or drainage, but excludes domestic
wastewater and industrial wastes. Also called Storm Drain.
Outfall: (1) The point, location, or structure where wastewater or drainage
discharges from a sewer, drain, or other conduit. (2) The conduit lead-
ing to the ultimate disposal area.
Outfall Sewer: A sewer that receives wastewater from a collecting system
or from a treatment plant and carries it to a point of final discharge.
Trunk Sewer: A sewer that receives many tributary branches and serves a
large territory.
Waste Water: In a legal sense, water that is not needed or that has been
used and is permitted to escape, or which unavoidably escapes from
ditches, canals or other conduits, or reservoirs of the lawful owners of
such structures. See also Wastewater.
Wastewater: The spent or used water of a community or industry, which
contains dissolved and suspended matter.
ORGANIZATION OF SANITARY SEWER PROJECTS 3

1.3. PHASES OF PROJECT DEVELOPMENT
Conception and development of typical sanitary sewer projects com-
prise the following phases:
1.3.1. Preliminary or Investigative Phase
The objective of this phase is to establish the broad technical and eco-
nomic bases for environmental assessments, policy decisions, and final
designs. The importance of this phase cannot be overemphasized. Inade-
quate preliminary work will be detrimental to all succeeding phases and
may endanger the successful completion of the project or cause the owner
to undertake planning which may not produce the most economical or
efficient result. This phase usually culminates in an engineering report,
which includes items such as:
• Statement of the problem and review of existing conditions.
• Capacities and conditions required to provide service for design
period.
• Method of achieving the required service—if more than one method
is available, an evaluation of each alternative method.
• General layouts of the proposed system with indication of stages of
development to meet the ultimate condition when the project war-
rants stage development.
• Establishment of applicable engineering criteria and preliminary
sizing and design that will permit preparation of construction and
operating cost estimates of sufficient accuracy to provide a firm
basis for feasibility determination, financial planning, and consider-
ation of alternative methods of solution.
• Various available methods of financing and their applicability to the
project.
• An assessment of the anticipated environmental impacts of con-
struction and review of the long-term effects on the environment.
The environmental assessment, when required, must be sufficiently
thorough and objective to enumerate the environmental conse-
quences of the project. Measures to mitigate any negative impacts
should be set forth. Projects that have community-wide conse-
quences and that are supported by federal funds may be subjected
to detailed evaluation through Federal Environmental Impact State-
ment procedures.
• Operation and maintenance factors related to confined space entry
requirements, as regulated by the Occupational Safety and Health
Administration (OSHA), should be considered during the prelimi-
nary engineering phase. Design consideration should be given by
4 GRAVITY SANITARY SEWER DESIGN AND CONSTRUCTION

the engineer to facilitate safe ingress and egress into manholes and
sewers, platforms, safety ladders, etc. Manholes should be accessible
for scheduled maintenance. The accessibility of back line systems is
critical and easements are recommended for maintenance purposes.
• The selection of conveyance materials is critical. The corrosion
induced by microbial action, low pH levels, and hydrogen sulfide
gas must be considered when materials and linings are evaluated.
Some materials will require protection from stray currents and the
debilitating effect they will have on conveyance systems. Polyethyl-
ene wrapping, polyvinyl chloride (PVC) lining, and cathodic protec-
tion are standard responses to these issues.
• The construction of a sanitary sewer system will inevitably require
that streets and arterial highways be excavated or trenchless meth-
ods be utilized (see Chapter 12). Further, wetlands may be affected
and the system may require approvals from many jurisdictions,
municipalities, counties, and state and federal agencies. This coor-
dination and permitting in itself may weigh heavily on the con-
struction methods utilized—the cost of traffic interruption, loss of
revenue in commercial districts, and environmentally sensitive land
disturbance are critical elements in the planning process and may
require that the engineer and owner evaluate trenchless construc-
tion methods for new construction during this phase. The trenchless
methods may include, among others, microtunneling, horizontal
directional drilling, and pipe bursting.
• Analysis of risk associated with infrastructure failure and well-
reasoned discussions on system component locations and materials
selected.
It must be recognized that the preliminary engineering report is not a
detailed working design or plan from which a sanitary sewer project can
be constructed. Indeed, such detail is not necessary to meet the objectives
of the preliminary or investigative phase or the environmental assess-
ment. Nonetheless, proper preliminary engineering is the fundamental
initial step of final planning. (For additional information concerning the
Survey and Investigation phases of sanitary sewer project development,
see Chapter 2.)
1.3.2. Design Phase
The design phase of a sanitary sewer project comprises the preparation
of construction plans and specifications. These documents form the basis
for bidding and performance of the work; they must be clear and concise.
Design therefore consists of the elaboration of the preliminary plan to
include all details necessary to construct the project.
ORGANIZATION OF SANITARY SEWER PROJECTS 5

1.3.3. Construction Phase
This phase involves the actual building of the project according to the
plans and specifications previously prepared.
1.3.4. Operation
Although this Manual is devoted to matters of design and construc-
tion, the efficient operation of a sanitary sewer system is an important ele-
ment to consider during the development of such projects.
1.4. INTERRELATIONS OF PROJECT DEVELOPMENT PHASES
Since all phases of sanitary sewer projects are interrelated, the follow-
ing points are applicable:
1. The capacity, arrangement, and details of a sanitary sewer system will
not be satisfactory unless the preliminary or investigative phase is cur-
rent and properly completed.
2. Adequate preliminary engineering and estimating are essential to
sound financial planning, without which subsequent phases of the
project may be placed in jeopardy.
3. Environmental assessment documentation is intended to provide a sin-
gle source of comparison and evaluation of all development, construc-
tion, and operation phases of the project.
4. Inadequate design or improperly prepared plans and specifications
can lead to confusion in construction, higher costs, failure of the project
to meet intended functions, or actual structural or hydraulic failure of
component parts.
5. Proper execution of the construction phase is necessary to produce the
quality and features intended by adequate design. Moreover, the value
of the design can be lost by incompetent or careless handling of the
construction phase.
6. All sanitary sewer projects have certain features requiring operation
and maintenance. Unless they are anticipated and provided for, the
usefulness of the project will be impaired.
7. The cost estimates for these sometimes expensive capital projects require
updating based on elapsed time and modifications to the project. Often,
changes are made that may have a significant impact on the overall final
cost. The updating process will ensure that all parties are aware of the
financial impact of the project as the design process evolves from the ini-
tial preliminary design to the final biddable documents.
8. The impact of the combination of limited space and major renovation
to existing systems will add cost for, among others, bypass pumping
and inherent delays due to the need for sequential construction. Cost
6 GRAVITY SANITARY SEWER DESIGN AND CONSTRUCTION

estimates must factor in these hidden charges to the project. The soft
costs of contract bonds and insurance may also be significant as the
project construction costs increase.
The disruption to infrastructure, streets, utilities, and sediment and
erosion control requires the coordination of the project with other impacted
utilities and regulators having jurisdiction within the public right of way
(ROW). This analysis and coordination may have a significant impact on
route selection.
1.5. PARTIES INVOLVED IN DESIGN AND CONSTRUCTION
OF SANITARY SEWER PROJECTS
Engineering projects, including sanitary sewers, are the result of the
combined efforts of several interested parties. The owner, engineer, and
contractor are the principal participants. Legal counsel, financial consult-
ant, various regulatory agencies, and other specialists also are involved to
varying degrees. Responsibilities of these individuals or organizations are
summarized as follows.
1.5.1. Owner
The owner’s needs initiate the project and he provides the necessary
funds. The owner is party to all contracts for services and construction
and may act directly or through any duly authorized agent. The owner
most often is the collective citizens of a governmental unit whose affairs
may be handled by various legislative and administrative bodies. The
owner may also be a private group.
When the owner is a governmental unit, its business may be conducted
by one of the following, depending on the organization of the unit and the
laws controlling its operations:
• City councils or similar bodies, carrying out sanitary sewer projects
as only one of many duties for the given unit.
• A special commission or board of a governmental unit dealing with
more limited areas of interest than are usually are handled by a city
council. Such boards or commissions may be concerned with sanitary
sewer projects alone or with a governmental unit’s general utility sys-
tem. The geographical limits of responsibility of such boards or com-
missions usually coincide with those of the parent governmental unit.
• A legislatively established district, agency, or authority with unique
geographical limits and whose affairs are administered by a sepa-
rate and distinct administrative board or commission. Such units
commonly are referred to as districts or authorities—for example,
ORGANIZATION OF SANITARY SEWER PROJECTS 7

the County Sanitation Districts of Los Angeles County, which
includes 74 separate cities and the unincorporated county. Often,
the responsibilities of such sewering districts are limited to main
trunk sanitary sewers, intercepting sanitary sewers, treatment facil-
ities, and outfalls, leaving lateral sewers as the responsibility of the
individual governmental units within the area served by the larger
district.
The fund-raising powers of the first two bodies are usually regulated
by the same laws, which apply to financing by the parent governmental
unit. Fund-raising powers for a specially constituted district may show
considerable variation due to the many differences in legislative provi-
sions for special district formation and financing.
Temporary private ownership of sanitary sewer projects is sometimes
encountered in new developments. The developer may construct the san-
itary sewer system and later transfer title to the appropriate governmental
unit in accordance with local regulations. In some instances, wastewater
systems and treatment works are under the permanent ownership of pri-
vate utility companies. The design and construction of these private sys-
tems require that the agency that will or may assume authority maintain a
presence during design and construction process.
1.5.2. Engineer
The engineer has the responsibility of supplying the owner with the
basic information needed to make project implementation policy deci-
sions, detailed plans and specifications necessary to bid and construct the
project, consultation, general and resident inspection during construction,
and services necessary for the owner to establish satisfactory operation
and maintenance procedures. The engineer’s responsibilities are all of a
professional character and must be discharged in accordance with ethical
standards by qualified engineering personnel.
Engineering for sanitary sewer projects may be performed either by
engineering departments which are a part of a governmental unit, or by
private engineering firms retained by the owner for specific projects. In
many instances, sanitary sewer projects are a joint effort by both types of
organizations.
1.5.3. Contractor
The contractor performs the actual construction work under the terms
of the contract documents prepared by the engineer. The construction
agreement is between the contractor and the owner. One or more contrac-
tors may perform the work on a single project.
8 GRAVITY SANITARY SEWER DESIGN AND CONSTRUCTION

The functions of the contractor may be carried out by an owner’s
employees especially organized for construction purposes, but such prac-
tice for sanitary sewer projects of any magnitude is not common.
The complexity of many sanitary projects may require that the general
contractor have overall responsibility for associated subcontractors, and
an independent construction management firm to represent the owner.
1.5.4. Other Parties
Many other parties may be involved at various stages of a project.
Some of these are:
• Legal Counsel. All public works projects are subject to local and state
laws; competent legal advice is required to ensure compliance with
these laws and the avoidance of setbacks because of legal defects in
the project. Special legal counsel may also be required in connection
with financing the project, particularly where a bond issue is
involved.
• Financial Consultant. Advisory services with respect to project financ-
ing are often required and may be provided as a separate and spe-
cialized service. Such services are occasionally provided as part of a
general financing agreement with a financing agency.
• Regulatory Agencies. The most frequently encountered regulatory
body is the state Health Department, Department of Environmental
Quality, or, in some states, a specially designated water pollution
control agency which usually adopts minimum standards pertaining
to features of design, plans, and specifications for sanitary sewer
projects. Other regulatory bodies having jurisdiction may include
agencies such as municipality or sanitary sewer districts; local,
regional, or state planning commissions; federal agencies concerned
with water pollution control; and federal or state agencies having
functional control of navigable waters.
• Pipe Manufacturers. These manufacturers produce the specified pipe
materials and often will embark on focused developmental research
to prove or improve a specific pipe product.
1.6. ROLE OF PARTIES IN EACH PHASE
The roles of the owner, engineer, and contractor with respect to each
other in the different phases of the project are distinct. Unauthorized
assumption of roles and duties of one of the parties may result in delays,
failures, and/or contractual controversies. The legal counsel of the owner
ORGANIZATION OF SANITARY SEWER PROJECTS 9

usually will be responsible for all legal issues pertaining to funding and
compliance with the local purchasing statutes.
1.6.1. Preliminary or Investigative Phase
The owner and the engineer are the principal parties involved in the
preliminary phase of sanitary sewer projects. It must be recognized that
all policy decisions relating to the project, arranging for financing, etc.,
rest solely in the hands of the owner.
1.6.2. Design Phase
The design phase, up to the time of soliciting and receiving construc-
tion bids, involves both the owner and the engineer. Designs prepared by
the engineer are normally subject to the approval of the owner. The engi-
neer may recognize preferences of the owner and be guided by these pref-
erences when they are consistent with good engineering practice. The
engineer must recognize and conform to the legal, procedural, and regu-
latory requirements governing each project.
1.6.3. Construction Phase
In his relationship with the contractor, the engineer must exercise
authority on behalf of the owner. The engineer determines whether the
work is substantially in accordance with the requirements of the contract
documents. He must avoid direct supervision of the contractor’s con-
struction operations. If he does control or direct the acts of the contractor,
he may become involved as a third party in any legal action brought
against the contractor.
1.6.4. Operation Phase
Full information on the intended functioning of all parts of a project
should be furnished to the owner by the engineer. The owner’s staff must
assume final responsibility for operation at the time the project or any
part of it is completed and accepted by him. In some cases, the engineer,
by special agreement with the owner, may provide advisory services in
connection with operation and maintenance procedures for a period of
time after initial operation.
1.7. CONTROL OF SANITARY SEWER SYSTEM USE
Of all public utilities, sanitary sewer systems are probably the most
abused through misuse. This situation results from a misconception that a
10 GRAVITY SANITARY SEWER DESIGN AND CONSTRUCTION

sanitary sewer can be used to carry away any unwanted substance or
object that can be put into it. The absence of adequate regulations setting
forth proper uses and limitations of the system, and the lack of enforce-
ment of existing regulations by those responsible for operation of the
system, tend to foster such a misconception. Abuse of the sanitary sewer
system can result in extensive damage and can compound the problems
of wastewater treatment. Without proper maintenance and control, a sani-
tary sewer system may become a hazard to public safety and may
increase operating costs unnecessarily.
The following are common consequences of sanitary sewer system
misuse:
• Explosion and fire hazards resulting from discharge of explosive or
flammable substances into the sanitary sewer.
• Sanitary sewer clogging by accumulations of grease, bed load, and
miscellaneous debris.
• Physical damage to sanitary sewer systems resulting from discharge
of corrosive or abrasive wastes.
• Surface and groundwater overload resulting from improper connec-
tions to sanitary sewers.
• Watercourse pollution resulting from discharge of wastewater to
storm sewers.
• Interference with wastewater treatment resulting from extreme wet-
weather flows or from wastes not amenable to normal treatment
processes.
• The overloading effect of rainfall-induced inflow and infiltration must
be evaluated and action taken to reduce or eliminate these elements to
ensure the overall effective operation of a wastewater collection and
treatment system. The presence of high rates of infiltration and the
negative impact of same to the treatment process are not trivial. The
cost of treating this non-wastewater flow, in metered communities,
presents a tangible annual cost that can be used for the determination
of current dollars that can be expended to correct these problems.
• The proposed SSO Rule and CMOM regulations, if enacted, will
have a significant impact on the legal responsibility of the owner of
the large or small sanitary sewer collection system to ensure that
their systems function efficiently. In addition, the fixed asset report-
ing requirements of GASB 34 will also require that these critical
assets are valued and enhanced on a continuing basis. Financial
institutions will review the value of depreciated infrastructure to
assess the bond rating of a borrowing agency or utility.
In the organization of sanitary sewer projects, as well as in the manage-
ment of completed systems, provision must be made for the controlled
ORGANIZATION OF SANITARY SEWER PROJECTS 11

use of the sanitary sewers and enforcement of appropriate regulations. A
comprehensive report on sanitary sewer ordinances can be obtained from
the Water Pollution Control Federation (WPCF 1975). Their publications
may be helpful in determining the adequacy of existing regulations or
preparing new ones.
1.8. FEDERAL AND STATE PLANNING
AND FUNDING ASSISTANCE
1.8.1. Federal Assistance
Federal programs to provide financial assistance for the construction of
publicly owned wastewater treatment and transport systems began in the
middle 1950s and have grown to major significance. In many states, fed-
eral financial assistance programs for qualified wastewater systems are
supplemented by state grant and loan programs. The engineer is frequently
responsible for locating such sources of financial assistance and preparing
the necessary applications for the owner.
The Water Pollution Control Act of 1972, amended as the Clean Water
Act of 1977 and 1981, was the most significant source of federal assistance.
This law initially required state water pollution control agencies and cer-
tain sub-state agencies to conduct planning for water quality manage-
ment. Currently, funding for wastewater infrastructure is in the form of
low-interest loans issued by the states. These loans are repaid and create a
revolving account from which other projects can be funded. Availability
of financial assistance for sanitary sewers varies from time to time and
from state to state, since it is subject to the policies of the federal govern-
ment and of individual states.
The second most significant source of federal assistance is the Farmers
Home Administration (FmHA). Grants and loans for such systems are
available primarily to small, rural communities. Other federal grants and
loans are available from the Department of Housing and Urban Develop-
ment (HUD), the Economic Development Administration (EDA), and a
variety of regional agencies such as the Appalachian Regional Commis-
sion (ARC) and the Coastal Plains Regional Commission (CPRC). Contact
should be made with state and federal elected officials to ascertain the
availability and sources of funding for wastewater treatment projects.
Federal assistance programs have provided significant aid to local
wastewater agencies, but they are often limited by federal appropriations
and generally have substantial requirements and administrative proce-
dures which must be followed. A review of current funding allocations
and regulations is necessary to determine availability of federal funds at
any given time.
12 GRAVITY SANITARY SEWER DESIGN AND CONSTRUCTION

1.8.2. State Assistance
A majority of the 50 states operate programs to assist local govern-
ments in the planning and financing of wastewater projects, including
sanitary sewers. Many states have area planning and development com-
missions which prepare or assist in the preparation of planning docu-
ments for sanitary sewers for communities within their jurisdiction. States
operate grant and loan programs ranging from the very modest up to
100% of the cost of wastewater projects when supplemented by various
federal assistance programs. Such programs are usually administered by
the state water pollution control agencies or health departments. The
current status of state and local programs must be reviewed as a part of
project design activities. In order to distribute scarce resources more effi-
ciently, some jurisdictions issue low-interest loans to fund many sewer
system projects and to provide a revolving funding source.
1.9. LOCAL FUNDING
Local funding methods include the following:
1.9.1. General Obligation Bonds
These bonds are backed by the full faith and credit of the issuer and
often are paid for by the levy of general property taxes. In addition to or
instead of taxes, revenues from service charges or other sources may be
used to meet bond payments. Advantages of these bonds over other
bonds include lower interest rates because of the substantial security pro-
vided and the ease with which they may be sold. However, in most states
the issuance of general obligation bonds by local government is subject to
constitutional and statutory limitations and to voter approval.
1.9.2. Special Assessment Bonds
Such bonds are payable from the receipts of special benefits assess-
ments against certain properties or recipients of benefit. Assessments that
are not paid become a lien on the property. Assessments may be based on
front footage, area of parcels of property, or other bases. In most cases, the
prior consent of landowners representing some statutory percentage of the
total property to be assessed is required to implement special assessments.
1.9.3. Revenue Bonds
These bonds are payable from charges made for services provided.
Such bonds have advantages when agencies lack other means of raising
ORGANIZATION OF SANITARY SEWER PROJECTS 13

capital; they can be used to finance projects which extend beyond normal
agency boundaries. The success of revenue bonds depends upon eco-
nomic justification for the project, reputation of the agency, methods of
billing and collection, rate structures, provisions for rate increases, finan-
cial management policy, reserve funds, and forecast of net revenues.
1.9.4. Pay-As-You-Go Financing
This method entails gathering sufficient funding prior to and during
construction. Funds may be gathered through a system of increased user
charges and/or connection fees. Advantages of this method are elimina-
tion of interest cost and voter authorization. The principal disadvantage
is significantly higher charges during the period when funds are being
collected.
1.9.5. Revenue Programs and Rate Setting
Various methods are in use to obtain the revenue needed to operate,
maintain, replace, extend, and enlarge wastewater systems. The principal
methods include the levy of ad valorem taxes, service charges, connection
charges, and combinations of these. Each agency’s revenue program and
rate settings reflect the needs of an individual community and its local
policy. No single revenue-generating program can be considered ideal for
every situation.
Alternatives should be examined in terms of equity among user
groups, promotion of water conservation, and implementation and
updating requirements. Because the aim is to achieve fairness to all users
and beneficiaries—domestic, commercial, and industrial—it becomes
necessary to consider the question of fairness as a whole and not simply
from the standpoint of any one class. The procedures for allocating user
costs are easier to understand in specific examples than in the general
terms considered here. Examples are contained in various publications
prepared by ASCE, WEF, and the American Water Works Association
(AWWA).
1.9.5.1. Ad Valorem Taxes
Taxes on real estate may be used as a primary revenue source for
wastewater service in the event the agency has not accepted a federal
grant and, therefore, is not subject to restrictions under the Clean Water
Act or by taxing limitations. Real estate values and real estate taxes often
reflect ability to pay, which may be a primary criterion in reducing hard-
ship for some citizens. On the other hand, the value of real estate may
have little relationship to the cost of service which is provided to indi-
vidual users. There is often a preference for payment of service as a tax
14 GRAVITY SANITARY SEWER DESIGN AND CONSTRUCTION

rather than as a service bill because the tax may be deductible from fed-
eral and state income taxes, whereas a service charge is not.
The strongest objection to ad valorem taxation as a method of cost
recovery comes from those who believe that benefits are strictly propor-
tional to quantity of wastewater or a combination of quantity and waste
characteristics.
The simplicity of an ad valorem tax system is a marked advantage. It
requires no wastewater measurement or sampling program for charge
purposes. The required accounting and billing work is minimal. Clearly
this procedure will require minimal overhead cost, but the lack of indi-
vidual user accountability may not encourage conservation.
1.9.5.2. Service Charges
Service charges provide financial support of wastewater systems based
on some measure of actual physical use of the system. Measures of use
include volume of wastewater; volume of wastewater plus quantity of pol-
lutant matter; number or size of sewer connections; type of property, such
as residential, commercial, or manufacturing; number and type of plumb-
ing fixtures, water-using devices, or rooms; uniform rates per connection;
and percent of water charge. A recent development is that, in some jurisdic-
tions, services changes are being applied by governing bodies to account
for infrastructure improvements to mitigate environmental impacts.
1.9.5.3. Connection Charges
A one-time charge at the time a user connects to a wastewater system is
used to generate revenue. Charges vary from a nominal inspection fee to
a full, prorated share of the cost of the entire wastewater system. In some
cases connection fees reflect costs to provide new capacity in the waste-
water system. Connection fees are not generally used for operation and
maintenance, but are used for purposes such as payment of debt service
and financing wastewater system expansion.
1.9.5.4. Combination Taxes and Service Charges
Combination systems have often resulted from an original ad valorem
tax system when additional sources of revenue were required and funds
raised from user revenues were unpopular or were politically precluded
from use to fund operation and maintenance costs. The Clean Water Act
requires that grantees implement a system of service charges based on
usage to pay for operation and maintenance costs.
The combination system can result in payment for operation of a
wastewater treatment system by nonusers who do not benefit from
these facilities. One can argue, however, that a wastewater collection sys-
tem creates a safe environment for all residents and may be a charge on a
pro rata basis to all residents.
ORGANIZATION OF SANITARY SEWER PROJECTS 15

This option should be evaluated carefully prior to implementation.
Issues of current public policy in a region or geographic area relative to
financing of a service which benefits a segment of a jurisdiction by general
taxation is a slippery slope indeed.
1.10. SAFETY
A goal in sanitary sewer projects is to eliminate unsafe conditions and
unsafe acts. To be effective, desire and enthusiasm for safety must be
encouraged and supported at all levels of employment in the owner
organization. Among the numerous laws, rules, and regulations which
govern safety is the Occupational Safety and Health Act of 1970.
1.10.1. Investigations
• Investigations or surveys, such as an EPA Sanitary Sewer Evalua-
tion Survey (SSES), should be conducted with safety as a paramount
consideration in accordance with regulations for equipment, train-
ing, and size of sewer entry crew.
• The engineer must provide a work environment for his workers that
recognizes hazards likely to cause death or serious physical harm.
This can be accomplished with the utilization of proper safety equip-
ment and procedures.
1.10.2. Design
• Safety factors are to be considered by the engineer for reducing the
ultimate strength of a material to a working strength. The factor of
safety will vary, depending on the type of material and its use. (A
comprehensive discussion of design considerations is presented in
Chapter 9.)
• The engineer must be familiar with safety practices and regula-
tions such as OSHA standards and how their requirements may
affect the design of the sanitary projects. Several of these design
standards include safety landings in manholes and confined space
procedures.
• Sanitary sewers should be separated from gas and water mains and
other buried utilities. Many states have regulations that set mini-
mum horizontal and vertical separation requirements.
• Ventilation should provide for air to enter the sanitary sewer system
and provide for the escape of gases. Currently, the trend is to utilize
16 GRAVITY SANITARY SEWER DESIGN AND CONSTRUCTION

solid or watertight manhole covers in streets and water courses.
With the decrease in ventilation through holes in manhole covers,
inconspicuous vents or forced draft may be needed to provide ade-
quate ventilation.
1.10.3. Construction
• The construction contract documents should require the contractor
to adhere to all laws and regulations which bear on the project con-
struction and to be responsible for safety at the construction site.
• The OSHA standards require the employer (contractor) to provide
employees with a safe and healthful place of employment. Sections
of the OSHA standards state that it shall be the responsibility of
the employer to initiate and maintain such programs as may be
necessary to provide safe conditions, and that frequent and regular
inspections be made by competent persons designated by the
employers.
• The engineer should specifically instruct his own field personnel to
follow safety precautions while visiting the construction site. Field
personnel should be issued hardhats and eye goggles or other appro-
priate protective equipment for use while visiting the site.
• The terms of the contract documents entered into for a construction
project play an important role in determining whether or not an
engineer has any duty in regard to the safety of the contractor’s
employees. Litigation by injured employees of contractors naming
the engineer as a party to a suit often occurs. Unless the engineer
has specifically accepted responsibility for construction site safety,
the contract documents must provide that the contractor is respon-
sible for construction site safety. The engineer must nevertheless
take appropriate action if a potential safety hazard is observed.
1.10.4. Operation and Maintenance
• A safety program is necessary for the operation and maintenance of
a sanitary sewer system. Safety is the responsibility of every individ-
ual, not only for personal protection but also for the protection of
fellow employees.
• Safety equipment such as traffic control devices, safety harnesses,
tools for manhole cover removal, gas detectors and blowers with
duct discharge for positive displacement of manhole atmosphere,
and rubberized cloth gloves must be available for protection where
needed.
ORGANIZATION OF SANITARY SEWER PROJECTS 17

1.11. NATIONAL ENVIRONMENTAL POLICY ACT OF 1969
The National Environmental Policy Act of 1969 (NEPA) established
that Congress is interested in restoring and maintaining environmental
quality. It directs all federal agencies to identify and develop methods
and procedures to ensure that environmental factors be given appropriate
consideration in decision making along with economic and technical con-
siderations. NEPA applies also to any project implemented by federal
funds. A number of states have adopted legislation that parallels NEPA
for state and local activities.
If the nature of the proposed project and its impact does not obviously
reflect the need for the preparation of an Environmental Impact Statement
(EIS), an initial Environmental Assessment (EA) reviews the anticipated
effects of the proposed action. A conclusion is drawn as to whether the
proposed action would significantly and adversely affect the environ-
ment and therefore require the preparation of an EIS. If there is no signif-
icant adverse impact on the environment, then the assessment normally
serves as the basis for a negative declaration, or Finding of No Significant
Impact (FONSI). Wastewater projects can affect the types and intensities
of land use by providing facilities to accommodate new development. The
location of new or expanded facilities affects the location of new develop-
ment. With limited public funds, a decision to finance a specific facility
limits funds for other facilities locally or in other areas and for similar or
other purposes. A compatible relationship needs to exist between the
potential growth-accommodating effects of facilities and the ability of a
region to support additional growth.
The assessment should address relative impacts of population growth
on natural resources such as air and water, and on visual conditions, com-
munity characteristics, archaeology, and other cultural values. It should
clearly illustrate the range of impacts resulting from various growth lev-
els, ranging from “no-growth” or “no project” to build-out.
Socioeconomic effects, employment, availability of housing, and the
costs of providing projected populations with other public services and
utilities should be assessed. Those long-term environmental goals which
conflict with economic needs must also be identified in assessment of sec-
ondary impacts.
An EA is an environmental report prepared expressly to determine
whether a proposed action requires the preparation of an environmental
impact statement. The EA may be based on procedures such as checklists,
matrices, networks, overlays, and specific studies. The environmental
assessment should:
• Describe the proposed action.
• Describe the environment to be affected.
18 GRAVITY SANITARY SEWER DESIGN AND CONSTRUCTION

• Identify all relevant environmental impact areas.
• Evaluate the potential environmental impacts.
• Identify adverse impacts that cannot be avoided should the action
be implemented.
• Identify irreversible and irretrievable commitments of resources.
• Discuss the relationship between local short-term uses of man’s
environment and long-term productivity.
• Identify conflicts with state, regional, or local plans and programs.
• Evaluate alternatives to the proposed action.
• Discuss any existing controversy regarding the action.
It is important to quantify impacts, where possible, to permit a clear
picture of the issues for discussion and decision-making purposes. For
projects involving minimal impacts or improvements to existing infra-
structure, the governing body may determine that a categorical exclusion
is appropriate, which has significantly fewer permitting requirements.
1.12. CAPACITY, MANAGEMENT, OPERATIONS,
AND MAINTENANCE (CMOM)
The EPA, under the provisions of the Clean Water Act, is proposing to
clarify and expand existing permit requirements for owners of municipal
sanitary sewer collection systems. These changes, if enacted, will apply to
virtually all municipal sanitary sewer collection systems and their satel-
lite system contributors.
The objective is to promote good management, operation, and mainte-
nance procedures that will result in reduced sanitary sewer overflows
which can lead to environmental and public health risks, such as beach
closings and contamination of ecological systems in the waterways.
The number of sanitary sewer overflows is estimated at approximately
40,000 per year. It is anticipated that by increasing the accountability for
municipal sewer system owners and providing direction as proposed in
the CMOM programs, these numbers will be reduced significantly to the
betterment of the environment and public health. This particular rule
addresses SSOs, not combined sewer overflows (CSOs). A brief descrip-
tion of the program elements follows:
• Capacity Assurance, Management, Operation, and Maintenance Pro-
grams. These programs will help communities ensure they have
adequate wastewater collection and treatment capacity and incorpo-
rate many standard operation and maintenance activities for good
system performance. When implemented, these programs will pro-
vide for efficient operation of sanitary sewer collection systems.
ORGANIZATION OF SANITARY SEWER PROJECTS 19

• Notifying the Public and Health Authorities. Municipalities and other
local interests will establish a locally tailored program that notifies
the public of overflows according to the risk associated with specific
overflow events. The EPA is also proposing that annual summaries
of sewer overflows be made available to the public. The proposal
also clarifies existing recordkeeping requirements and requirements
to report to the state.
• Prohibition of Overflows. The existing Clean Water Act prohibition of
sanitary sewer overflows that discharge to surface waters is clarified
to provide communities with limited protection from enforcement
in cases where overflows are caused by factors beyond their reason-
able control or severe natural conditions, provided there are no fea-
sible alternatives.
• Expanding Permit Coverage to Satellite Systems. Satellite municipal col-
lection systems are those collection systems where the owner or
operator is different from the owner or operator of the treatment
facility. Some 4,800 satellite collection systems will be required to
obtain NPDES permit coverage to include the requirements under
this proposal.
Additional information is obtainable on the EPA’s web site, www
.epa.gov.
1.12.1. Government Accounting Standards Board Statement 34
(GASB 34)
GASB 34 fundamentally requires each permitee to value its infra-
structure assets. The objective of introducing this process is to ensure
that the infrastructure of each satellite system is enhanced and main-
tained to ensure proper operation and to maintain its value on the bal-
ance sheet.
Clearly, the straight-line depreciation method will reduce its value to
zero following the end of the period of useful life. This period may vary
from jurisdiction to jurisdiction, based on the provisions of the local
bond law. The terminal zero value at the conclusion of the depreciation
period may not be applicable in the case of buried pipelines; these sys-
tems will always have some functional value. The methods used to deter-
mine that value include condition, serviceability, capital investment, and
rehabilitation.
At some point, the annual expenditure required to respond to faulty
collection systems will equal or exceed the debt service incurred to correct
these deficiencies. The added benefit to the owner is the enhanced value
of its sewer collection system and reduction or redirection of the operat-
ing budget allocated for this purpose.
20 GRAVITY SANITARY SEWER DESIGN AND CONSTRUCTION

1.13. MEASUREMENT UNITS
In the United States, sanitary engineering technology has been based
on measurements expressed in the foot-pound-second system previously
prevalent in most English-speaking countries (WPCF 1976). Metrication
throughout the world is proceeding at varied paces; however, standardized
measuring units of Le Système International d’Unités (SI) are becoming
ORGANIZATION OF SANITARY SEWER PROJECTS 21
TABLE 1-1. Applicable SI Base Units
Quantity SI Unit Symbol Definition
Base Units:
a
Length meter m The meter is the length equal to
to 1,650,763.73 wavelengths in
vacuum of the radiation corres-
ponding to the transition between
the levels 2p
10
and 5d
5
of the
krypton-86 atom.
Mass kilogram kg The kilogram is equal to the mass
of the international prototype of
the kilogram.
Time second s The second is the duration of
9,192,631,770 periods of the
radiation corresponding to the
transition between the two
hyperfine levels of the ground.
Supplementary Units:
b
Plane Angle radian rad The radian is the unit of measure
of a plane angle with its vertex at
the center of a circle and subtended
by an arc equal in length to the
radius.
Solid Angle steradian sr The steradian is the unit of measure
of a solid angle with its vertex at
the center of a sphere and enclos-
ing an area of the spherical surface
equal to that of a square with sides
equal in length to the radius.
a
The radian and steradian may be used advantageously in expressions for derived units to distin-
guish between quantities of a different nature but of the same dimension.
b
In practice, the symbols rad and sr are used where appropriate, but the derived unit “1” is gener-
ally omitted.
Source: www.physics.nist.gov, accessed March 7, 2007.

22 GRAVITY SANITARY SEWER DESIGN AND CONSTRUCTION
TABLE 1-2. Applicable SI-Derived
a
Units Expressed
in Terms of Base Units
Quantity SI Unit SI Symbol
Acceleration Meters per second squared m/s
2
Area Square meters m
2
Density Kilograms per cubic meter kg/m
3
Specific volume Cubic meters per kilogram m
3
/kg
Velocity Meters per second m/s
Viscosity, kinematic Square meters per second m
2
/s
Volume Cubic meters m
3
a
Even though the selection of the meter-kilogram-second (mks) system yields coherent units
more easily than those used, for example, in the centimeter-gram-second (cgs) system, not
all of the units are convenient for all applications. Consequently, provision is made for mul-
tiples and submultiples of the base unit.
Source: www.physics.nist.gov, accessed March 7, 2007.
TABLE 1-3. Applicable SI-Derived Units with Special Names
Expression Expression in
in Terms of Terms of SI
Quantity SI Unit Symbol Other Units Base Units Definition
Force newton N — mkgs
2
The newton is that
force which, when
applied to a body
having a mass of
1 kilogram, gives it
an acceleration of
1 meter per second
per second.
Pressure pascal Pa N/m
2
m
_1
kgs
2
The pascal is the
pressure or stress
of 1 newton per
square meter.
Source: www.physics.nist.gov, accessed March 7, 2007.

the rule rather than the exception. This Manual, where practical, presents
both metric and conventional systems.
The SI makes use of only seven base units, which are divided into three
classes:
1. Base Units. These are seven well-defined units that are dimensionally
independent: meter (m), kilogram (kg), second (s), ampere (A), candela
(cd), Kelvin (K), and mole (mol). Base unit definitions applicable to
sewer design are given in Table 1-1.
2. Derived Units. These are expressed algebraically in terms of base units.
Several derived units have been given special names and symbols that
may themselves be used to express other derived units in a simpler
way than in terms of base units. Some of the derived units applicable to
sewer design are shown in Tables 1-2 and 1-3.
3. Supplementary Units. These are two units that are defined neither as
base units nor as derived units. The units, radian (rad) and steradian
(sr), are shown in Table 1-1.
REFERENCES
“Glossary.” Water and wastewater engineering. (1981). APHA, AWWA, WPCF,
ASCE, New York, N.Y.
Financing and charges for wastewater systems. (1981). A Joint Committee Report
of APWA, ASCE, and WPCF, New York, N.Y.
Water Pollution Control Federation (WPCF). (1976). Units of expression for waste-
water treatment. Manual of Practice No. 6, WPCF, Washington, D.C.
WPCF. (1975). Regulation of sewer use. Manual of Practice No. 3. WPCF, Wash-
ington, D.C.
ORGANIZATION OF SANITARY SEWER PROJECTS 23
This page intentionally left blank

2.1. INTRODUCTION
Surveys and investigations produce the basic data needed for the suc-
cessful conception and/or development of a sanitary sewer design proj-
ect. The fundamental importance of any survey or investigation requires
that it be carried out competently and thoroughly if an effective project is
to result.
The term “survey,” as used in this Manual, refers to the process of col-
lecting and compiling information necessary to develop any given phase
of a project. In one sense, it may include observations relating to general
conditions affecting a project, such as historical, political, physical, envi-
ronmental, and fiscal matters. In another sense, a survey may comprise
the precise instrument measurements necessary for the engineering
design.
The term “investigation” is often used interchangeably with “survey.”
Its use in this Manual, however, usually refers to the assimilation and
analysis of the data produced by surveys to arrive at policy and engineer-
ing decisions.
Surveys and investigations for the preliminary phase of a project are
broad in nature, with emphasis on covering all factors relating to a project
and determining the relative importance of each. The preliminary phase
of a project may likely originate from a second or third party as a result of
an SSES following the guidelines set forth in the ASCE Manual and
Report on Engineering Practice No. 62 (ASCE 1994).
Surveys and investigations for design and construction phases are
more precise and detailed, usually being limited by the scope of the proj-
ect. However, the level of accuracy and the nature of survey and inves-
tigation work also varies according to the type of construction being
CHAPTER 2
SURVEYS AND INVESTIGATIONS
25

incorporated and the general location. For example, there would be a sig-
nificant difference between a project that is designed to rehabilitate an
existing sewer system, one being designed to augment an existing sys-
tem, and one that is being designed as a totally new system. Further-
more, there is a significant difference between systems located in urban
and rural environments, so an engineer must keep all factors in mind
when developing the scope of the survey and investigation phases.
Methods of conducting a survey vary widely, depending on the phase
of development under consideration and the objectives. Proper surveys
require broad knowledge of the particular field and an understanding of
the problems to be solved in the phase of the project for which the sur-
vey is being conducted. Knowledge of the various aspects of sanitary
sewer design set forth in other chapters of this Manual will lead to
recognition of the specific information needed from a survey for any
given project. The objectives of the survey for the several project phases
and the type of information required for each phase are discussed in this
chapter.
2.2. TYPES OF INFORMATION REQUIRED
Several different kinds of information, applicable in varying degrees to
the different project phases, may be collected during the course of surveys
for a typical project. These include:
2.2.1. Physical
• Topography, surface and subsurface conditions, details of paving
and other surfaces to be disturbed, pertinent above- and under-
ground utilities and structures, soil characteristics, water table ele-
vations, and traffic control needs.
• Locations of streets, alleys, easements, and obstructions; required
rights-of-way; and all similar data necessary to define the physical
features of a proposed sanitary sewer project, including preliminary
horizontal and vertical alignment.
• Details of the existing sanitary sewer system to which a proposed
sanitary sewer may connect.
• Pertinent information relative to possible future extension of the
proposed project by annexation or service agreements with adjacent
communities or areas.
• Locations of historical and archaeological sites, and of people, plant,
and animal communities and any other environmentally sensitive
areas.
26 GRAVITY SANITARY SEWER DESIGN AND CONSTRUCTION

• Approvals (right-of-entry agreements) required to enter existing
(system owner) easements or rights-of-way through or across prop-
erty(s) owned by others.
• Access needs for possible construction equipment and future main-
tenance personnel and vehicles.
2.2.2. Developmental
• Existing populations and future population trends and density in
the area to be served.
• Type of development (i.e., residential, commercial, or industrial).
• Historical and experience data relating to existing facilities which
may affect proposed sanitary sewers.
• Comprehensive regional master plans of other agencies, especially
the Ocean Water Act (as amended) Section 208, Areawide Plans, and
Section 201, Facilities Plans.
• Location of future roads, airports, parks, industrial areas, etc., which
may affect the routing and location of sewers.
2.2.3. Political
• Present political boundaries and probability of annexation of adja-
cent areas.
• Possible service agreements with adjacent communities and satellite
systems; feasibility of multi-municipal or regional system.
• Existence and enforcement of industrial waste ordinances regard-
ing pretreatment or limitations on the concentrations of damaging
substances.
• Requirements for new waste ordinances to achieve desired results.
• Effectiveness and adequacy of present political subdivision to under-
take the project; desirability of a new organization to sponsor the
same.
2.2.4. Sanitary
• Quantity and strength of municipal wastewater to be transported.
• Water use data and flow gagings, where appropriate, to establish
dry- and wet-weather flow rates from existing similar areas.
• Capacity and condition of existing sanitary sewer system.
• Other pertinent data necessary to establish the required design crite-
ria and capacity for the given project, including infiltration/inflow
requirements and ordinances.
SURVEYS AND INVESTIGATIONS 27

2.2.5. Financial
• Information relative to existing authorization or policies, obliga-
tions, and commitments bearing on financing of the proposed sani-
tary sewer.
• Amounts, retirement schedule, and refinancing penalty of outstand-
ing bonds and unobligated bonding capacity available for the pro-
posed project.
• Availability of federal or state assistance through grants or loans.
• Taxable valuation, existing tax levies, and any limits affecting the
proposed project.
• Schedule and methods of developing existing sanitary sewer service
rates and revenues generated.
• Property plats as required for sanitary sewer assessments and spe-
cial methods of assigning assessments.
• History of local construction factors and operating costs and condi-
tions affecting cost.
• All similar data necessary to establish a feasible financing program
for the proposed project.
2.3. SOURCES OF INFORMATION
As with all sources of information, the engineer should evaluate the
relative accuracy of the information gathered during the surveys to deter-
mine its suitability to the design needs of the project. The sources of infor-
mation, whether they be digital or hard copy, should be referenced for
future records and conveyed to the system owner upon project comple-
tion. It is also important to note that resolved instances of conflicting data
sets should be duly recorded and also reported to the system owner such
that its records can be updated to reflect the true data and source. Possible
sources of information sought by surveys for sanitary sewer projects
include:
2.3.1. Physical
• Existing maps and sewer system plans, including United States Geo-
logical Survey (USGS) topographic maps, city plats and topographic
maps, state highway plans and maps, tax maps, and local utility
records and plans. Depending upon the system owner, much of the
needed information may be contained in a Geographic Information
System (GIS). However, the engineer should confirm the accuracy of
the content.
28 GRAVITY SANITARY SEWER DESIGN AND CONSTRUCTION

• Aerial photographs.
• Instrument surveys, including approximate surveys by such devices
as hand level, total station, and Global Positioning System (GPS), all
of which may be useful for preliminary work.
• Photographs and/or videos of complex surface detail to supplement
instrument surveys, and photographs and/or videos to show detail
of existing sewer systems.
• Borings and test pits, either by hand or by machine, for determining
subsurface soil and water conditions.
• Underground structure locations should be investigated to confirm
the utility records. The engineer should follow CI/ASCE Standard
38-02 (ASCE 2002).
• Local 208 agency, historical preservation office, archaeological soci-
ety, department of natural resources, soil conservation service, or
local universities to identify any environmentally sensitive areas.
2.3.2. Developmental
• Census reports.
• Planning and zoning reports and maps.
• General field and/or aerial photo examination to note type, degree,
and density of development.
• Criteria of regulatory agencies having jurisdiction over the project.
• Engineering reports or studies of related projects in the area.
2.3.3. Political
• Enabling or authorizing legislation.
• Municipal and state laws.
• Conferences with owner and other officials.
• Comprehensive plans established by planning agencies.
• Local and area meeting reports and minutes.
2.3.4. Sanitary
• Canvass of significant industries to determine type and amount of
waste.
• Flow gagings and sampling in existing sanitary sewers to establish
dry- and wet-weather flow characteristics from similar areas.
• Records of water pumpage and water sales.
• Design basis and operational characteristics of existing sanitary
sewers from system records.
SURVEYS AND INVESTIGATIONS 29

• Federal, state, and local requirements and ordinances for infiltration/
inflow.
• Records of existing treatment plant influent characteristics.
2.3.5. Financial
• Pertinent records of the owner’s fiscal officer.
• Auditor’s or treasurer’s records relating to tax levies.
• Operating statements and reports of income and expenses for the
sanitary sewer, water, and other utility departments.
• Ordinances or laws and bond indenture governing outstanding
bonds, and procedures for financing and contracting the proposed
project.
• Assessment plats and schedules for prior projects to show methods
in use in the locality.
• Tax maps showing subdivision and ownership of property to be
affected by special assessments.
2.4. SURVEYS FOR DIFFERENT PROJECT PHASES
The objectives of the typical and differing phases of project develop-
ment must be understood to ensure that the survey to be conducted is
meaningful. Typical phases of project development are discussed in
Chapter 1. A discussion of the objectives and the nature of surveys for
each phase follows.
2.4.1. Preliminary Surveys
This phase of development is concerned with the broad aspects of the
project, including required capacity, basic arrangement and size, probable
cost, environmental assessment, and methods of financing. Accordingly,
information is required in sufficient detail to show general physical fea-
tures affecting the layout and general design. The scope as well as the fea-
sibility and environmental aspects of the project development must be
considered at this time.
When the project involves rehabilitation of an existing sewer system, the
preliminary survey must contain horizontal and vertical locations of pipe
inverts and manholes, date and material of construction, dry- and wet-
weather flow rates, and other condition-related data. Much of this informa-
tion may be collected during an SSES and/or may be located in the owner’s
asset management system or GIS. This should also include a Quality Level
D or C utility location as defined by CI/ASCE Standard 38-02 (ASCE 2002).
30 GRAVITY SANITARY SEWER DESIGN AND CONSTRUCTION

When a connection to an existing sanitary sewer system is proposed,
the preliminary survey must contain flow data for use in establishing the
design capacity and sanitary sewer layout.
Extreme precision and detail are neither necessary nor desirable in this
phase, but all data obtained must be reliable. The type and extent of the
information needed for any given project will usually become apparent as
the work progresses, and this may vary widely depending on the size and
complexity of the project. Since preliminary surveys are used to develop
the information upon which the estimates of the engineering report are
based, these must be thoroughly and competently prosecuted. Sufficient
allowance must be made for items affecting the total cost of the project,
such as trends in construction costs, pavement removal and replacement
practices, backfill methods, sheeting, dewatering, and unusual quantities
of difficult excavation. Otherwise, costs will be underestimated.
Occasionally, photogrammetric methods may be advantageous in
obtaining a portion of the data needed in making a preliminary survey.
2.4.2. Design Surveys
Surveys for this phase form the basis for engineering design as well as
for the preparation of plans and specifications. Design surveys are con-
cerned primarily with obtaining physical and sanitary wastewater flow
data, rather than developmental, environmental, or financial information.
In contrast with the preliminary surveys, design surveys must contain all
the detail and precision the design engineer needs to correlate his design
and the resulting construction plans with actual field conditions. Design
surveys involve the use of surveying instruments in establishing the accu-
rate location of pertinent topographic features. Photogrammetric meth-
ods also may be used in obtaining this information.
When the project involves rehabilitation of an existing sewer system,
the preliminary survey shall follow the guidelines set forth in the ASCE
Manual and Report on Engineering Practice No. 62 (WEP/ASCE 1994).
During this phase it is important to quantify the number and location of
system defects to be repaired, as well as to identify suitable forms of repair.
This should be followed by a comparative hydraulic analysis of the sys-
tem capacity demands with those of the rehabilitated system to confirm
that adequate capacity is available after rehabilitation and future build-
out (if applicable).
Presumably, the preliminary phase will have established the general
extent of the project so that the area to be covered by the design survey
can be defined. However, further definition of location within the general
area may be required during the course of the design survey. The design
survey also may extend to some degree beyond the proposed construc-
tion limits in order that possible future expansion may be facilitated.
SURVEYS AND INVESTIGATIONS 31

It is obvious that accurate surveys are required to produce accurate
designs and plans. Vertical control usually is established by setting bench-
marks throughout the project, the elevations of which have been con-
firmed by level circuits to within 0.01 ft (3 mm). Although property and
street lines are often used for horizontal control, control traverses or coor-
dinate systems may be desirable. A special problem frequently encoun-
tered in design surveys is the nature and extent of existing underground
utilities and structures which must be cleared or displaced by the new
sanitary sewer. Such information, insofar as practical, must be obtained
during the design survey to establish right-of-ways, minimize utility relo-
cation costs, obtain lower construction bids, and prevent changing or
realignment after the commencement of the project.
Where the accurate location of important substructures cannot be ascer-
tained by other means, and conflict is possible, excavation to determine
location, elevation, and detail at the point of crossing is warranted. Such
substructure information may be determined by the owner, engineer, or
contractor prior to sewer construction, with alignment or invert elevations
revised accordingly. However, it should be noted that design projects set
in an urban environment will be more likely to encounter various under-
ground intangibles, such as abandoned or unrecorded utilities; old build-
ing or structure foundations; left-in-place sheeting and support piles;
unusual fill or backfill material; multiple layers of road surfaces; aban-
doned railroad beds, tracks, or ties; and so on. For this reason it is highly
recommended that Quality Level A utility location is obtained for these
scenarios where space is limited and complicated by multiple utilities, and
the engineer should follow CI/ASCE Standard 38-02 (ASCE 2002).
2.4.3. Construction Surveys
Surveys for this phase are concerned almost exclusively with physical
aspects. Construction surveys are required to establish control for line
and grade, to check conformity of construction, and to establish settle-
ment levels on existing structures immediately adjacent to the construc-
tion where necessary.
2.5. INVESTIGATIONS
Investigations may take many forms but always are directed toward
determining the most feasible, practical, and economical methods of
achieving a desired result. On small sanitary sewer projects, these may
involve no more than an on-the-spot decision to use conventional min-
imum standards for a simple gravity flow extension to an existing
sewer system. Larger projects, on the other hand, may have several alter-
32 GRAVITY SANITARY SEWER DESIGN AND CONSTRUCTION

natives—all of which must be considered. Projects involving relief of
existing sewer systems, for example, usually require extensive studies
before the design flow capacity and the method of correction can be
ascertained. In addition, many of the studies conducted as part of the
relief alternatives analyses, or independently as an SSES, result in identi-
fication of system features that need to be corrected and can be corrected
via system rehabilitation. In those instances, some recommendations are
simple whereas others may have multiple options that are ultimately
decided by owner preference.
The following questions are typical of those to be resolved by investigation:
• What is the extent of area to be served and what is the pattern of
present and future land use? Has an area zoning plan been adopted?
How does the area relate to a regional sanitary sewer plan?
• Are there known problem areas in the system (SSOs or recurring
maintenance locations)? Is there a significant system response to wet
weather? Are there areas that cannot be maintained due to limited
access, such as unmaintained rights-of-way? Are permanent access
roads or pathways an option in those areas?
• What general arrangement of the system will best fill the need?
What easements or rights-of-way are required for this arrangement?
• Does or will the system parallel and or cross a waterway (creek,
stream, river) or affect tidal or nontidal wetlands? If so, a stream
migration analyses may be beneficial to determine needed protec-
tive features necessary for future stream migration scenarios.
• What part of the wastewater flow will be intercepted for treatment
from an existing sewer system?
• Are there combined sewers in the system? How will flow from com-
bined sewers be handled?
• If a relief system is being constructed, does the owner want to main-
tain control of the operation between the existing and relief lines, or
minimize future bypass pumping needs? If so, flow control devices
and methods should be evaluated and discussed with the system
owner.
• What are the estimated present and future wastewater flows?
• Shall sanitary sewers all discharge to one point for treatment or will
treatment be provided at more than one location?
• How will requirements of other agencies (e.g., state and county
highway departments, railroads, other utility organizations) dictate
specific locations for crossing, rights-of-way, installation, and details
of materials or construction?
• If a regional sewer system is anticipated, what are the long-term
environmental effects of exporting wastes from a given groundwater
basin to another?
SURVEYS AND INVESTIGATIONS 33

REFERENCES
American Society of Civil Engineers (ASCE). (2002). “Standard guideline for the
collection and depiction of existing subsurface utility data.” CI/ASCE Stan-
dard 38-02, ASCE, Reston, Va.
Joint Task Force of the Water Environment Federation and the American Society
of Civil Engineers (WEP/ASCE). (1994). Existing sewer evaluation and rehabil-
itation, second ed., ASCE Manuals and Reports on Engineering Practice No. 62,
ASCE, Reston, Va.
34 GRAVITY SANITARY SEWER DESIGN AND CONSTRUCTION

3.1. INTRODUCTION
Sanitary sewers are constructed to transport the wastewater of a com-
munity to a point of treatment and disposal. Estimating quantities of
wastewater is the first step in designing new sewer pipelines for (1) new
future development or redevelopment, or (2) to develop a capital improve-
ment plan (CIP) for rehabilitating or replacing existing sewers. A CIP
would also include physical inspection and other testing of the sewers for
conditions analysis.
There are three general categories of wastewater flow in sanitary sew-
ers: residential, nonresidential, and infiltration/inflow (I/I). Residential
wastewater is from dwellings such as homes, apartments, and condo-
miniums, as well as from transient residences or group quarters such as
prisons, dormitories, and hotels. Nonresidential wastewater is from
offices, retail stores, shopping malls, warehouses, factories, schools, pris-
ons, hospitals, churches, mosques, synagogues, and community centers;
it is often termed “commercial” and/or “industrial.” I/I includes both
infiltration and inflow, which are defined as follows (American Public
Health Association 1981). Infiltration is groundwater entering a sanitary
sewer system through joints, porous walls, and cracks. Inflow is extrane-
ous flow that enters a sanitary sewer from sources other than infiltration,
such as connections from roof leaders, basement drains, land drains, and
manhole covers. Inflow typically results directly from rainfall or irriga-
tion runoff. Each category of wastewater flow has a multistep forecasting
procedure as summarized in Table 3-1.
For new or rehabilitated sewer design, the tractive force approach to
self-cleansing evaluation (see Chapter 5) requires that the information
CHAPTER 3
QUANTITY OF WASTEWATER
35

from step 4 in Table 3-1 be used to establish four flow rates for each
sewer reach:
• The average daily flow, Q
avg1
, for the low flow period in the pipe,
usually when it is first placed into service. Derivation of Q
avg1
is pre-
sented in Sections 3.3 through 3.6.
• The design minimum flow, Q
min
, which is the largest hourly flow
during the low-flow week in the life of the system. This flow is used
for self-cleansing design using the tractive force model with the
objective of transporting the sediment during low-flow periods. By
using Q
min
for tractive force analysis to set minimum slopes in sewer
36 GRAVITY SANITARY SEWER DESIGN AND CONSTRUCTION
TABLE 3-1. Summary of Forecasting Procedures
a
Infiltration/
Residential Nonresidential Other Wastewater Inflow
Wastewater Wastewater (Section 3.7) (Section 3.8)
Step 1 Determine Determine Large Flow Determine
planning planning industries— monitoring area affected
horizon or horizon or case-by- or length and
design period design period case basis diameter of
(Section 3.2). (Section 3.2). pipeline.
Step 2 Forecast Forecast land Determine/
population or uses and/or estimate
number of number of infiltration/
dwelling employees inflow
units, (Section 3.4). allowance.
including
transients and
group
quarters
(Section 3.3).
Step 3 Determine Determine
average unit average unit
flows based flows based on
on population land use and/or
or dwelling number of
units (Section 3.5). employees
(Section 3.5).
Step 4 Develop Develop Determine
average average flows average unit
flows (Section 3.6) flows.
(Section 3.6).
a
Develop design and peak and minimum flows (see Section 3.9). If necessary, develop alternative
forecasts for sensitivity analysis (see Section 3.10).

design, the potential for sulfide-related corrosion, as discussed in
Chapter 4, can be minimized. The most direct way of generating
Q
min
is with the equation Q
min
Q
avg1
P
1
, where P
1
a peaking
factor discussed in Section 3.7.
• The average daily flow, Q
avg2
, for the design day for the system.
Derivation of Q
avg2
is also presented in Sections 3.3 through 3.6.
• The capacity design flow, Q
max
, which is the largest 1-hour flow on
the design day for the system. This is normally generated by using
an appropriate peaking factor P
2
with Q
avg2
in the equation Q
max
Q
avg2
P
2
. Q
max
is estimated for the end of the design period (Section
3.2) to determine the hydraulic capacities of sanitary sewers and
downstream facilities such as pumps and the treatment plant. The
peaking factor P
2
is also discussed in Section 3.7. Downstream from
pumping stations, Q
min
and Q
max
are determined by pump capacity
and, indirectly, by Q
avg1
or Q
avg2
from upstream of the pumping sta-
tion. In other words, Q
max
in a gravity sewer downstream of a pump-
ing station occurs when the pump station is operating at planned
full capacity at the end of the design life. Q
min
occurs when the
pumping station is operating at planned largest pumping rate at the
beginning of service at the pumping station.
Previous versions of this Manual and similar references have empha-
sized use of historical per capita wastewater flows and population trends.
However, per capita wastewater flows for a given area may not accu-
rately reflect wastewater flow in that area because of nonresidential land
uses—which are related to employment or specialized activities, not pop-
ulation—and trends in lower indoor water consumption from water
conservation activities. Furthermore, I/I quantities are not related to
population. In other words, extrapolating historical per capita waste-
water flow is not the best practice.
Engineers may prefer to be on the conservative (high) side in forecast-
ing wastewater quantities for sewer capacity design. The rationale is that
conservative estimating provides a contingency or safety factor to handle
wastewater from unanticipated population growth and land develop-
ment. Some consequences of forecasting too low and undersizing sewers
are as follows:
• If growth exceeds the forecast, capacity of the pipeline might be
reached prematurely, resulting in (1) overflows and backups, espe-
cially if there are significant quantities of I/I; and (2) costly construc-
tion of a parallel (relief) sewer or increasing the sewer diameter by
pipe bursting.
• Development may be constrained by the lack of capacity, although
some communities may use this mechanism to limit development.
QUANTITY OF WASTEWATER 37

On the other hand, forecasting too high often leads to oversizing of sew-
ers, some consequences of which are the following:
• Construction costs will be higher without a compensating benefit.
However, the size of the pipe itself is not the major cost factor in
sewer construction; excavation and backfill are the major cost com-
ponents and do not vary significantly between commercially avail-
able pipe sizes, especially for the smaller diameters. For example,
construction cost of a 12-inch (300-mm) pipe will be about 10% to
25% greater than a 10-inch (250-mm) pipe, whereas the hydraulic
capacity of the 12-inch pipe is 64% greater than the 10-inch pipe (for
the same slope and friction factor).
• Self-cleansing power for a given flow rate and pipe slope is better in
a smaller-diameter pipe than in a larger one. For low flows in larger
pipes laid on flat slopes, the reduced self-cleansing power may not
be sufficient to transport solids, resulting in solids accumulation
and odor problems. This problem is compounded when the larger-
diameter pipe is laid at a flatter slope than the smaller-diameter pipe
would have been laid.
• Excess capacity in the pipeline may encourage or justify population
growth and land use development that are not desired by elected
officials.
The consequence of an accurate forecast is that the sewer will accommo-
date existing and future wastewater flow from officially sanctioned devel-
opment (Boland, 1998).
There is a great deal of literature on forecasting water demand based
on variables such as socioeconomic characteristics (e.g., household
income, housing type, household size, employment), seasonal variations,
economic conditions, climate, and the price of water. Such forecasts can
be disaggregated into indoor water use, which affects wastewater quan-
tities, and outdoor water use, which does not. Detailed discussion of
such models is beyond the scope of this Manual, but water demand
forecasts by the water supply authority may be useful to the engineer
in wastewater forecasting (Jones et al., 1984; Baumann et al., 1998;
Mays, 2004).
3.2. DESIGN PERIOD
The length of time considered in forecasting flows and setting capaci-
ties of sanitary sewers is referred to as the design period. Proper engi-
neering practice requires that the design period must be established prior
to the design of the sanitary sewer. The design period is related to the
38 GRAVITY SANITARY SEWER DESIGN AND CONSTRUCTION

planning horizon developed by the planning department having jurisdic-
tion over the area and the expected useful life of the sewer pipe.
Residential, commercial, and industrial development in most political
subdivisions are governed by a general plan or zoning ordinance. There
may also be an accompanying master plan for installation and/or rehabil-
itation of sanitary sewers within its jurisdiction. These plans permit
orderly expansion of facilities based on sound engineering without resort
to costly “crisis” action. The planning horizon for the general plan or the
sewer master plan can be as little as 10 years and as much as 50 years.
In some cases, no specific planning horizon is indicated in the general
plan. Instead, planners use the so-called saturation or build-out popula-
tion or land use. This is the maximum population and commercial or
industrial development that could occur from the existing general plan or
zoning ordinance. Engineers can forecast flows based on such popula-
tions or land use without regard to time frames.
It is also possible that growth and development may be phased over
the long term. In cases where sanitary trunk sewers would initially serve
relatively undeveloped lands adjacent to metropolitan areas, it may not
be feasible to design and construct initial facilities for more than a limited
future development period. Nevertheless, easements and rights-of-way
for future facilities can be secured in advance of development. This situa-
tion may need to be tempered to avoid imposing large current costs on a
relatively small current population by building reserve capacity far
beyond what is likely needed during a reasonable design period.
Engineers have typically used 50 years for the expected useful life of
the pipe, based on historical estimates of how long a pipeline can carry
wastewater before the pipe deteriorates or collapses. In the case where
the planning horizon is greater than the expected useful life of the pipe,
the planning horizon can be used as the design period, with the under-
standing that some sewers may need replacement or rehabilitation
before the end of the design period. In the case where the planning hori-
zon is less than the expected useful life of the pipe, the engineer may con-
sider basing the sewer design on saturation or build-out figures or on
phased development.
3.3. POPULATION OR DWELLING UNIT FORECAST
Once the design period or planning horizon has been established, the
next step in calculating residential wastewater flow is to forecast the popu-
lation or number of dwelling units and persons per dwelling unit, both
for the time of start of service and at the end of the design period.
Previous versions of this Manual and other historical references give
several mathematical and graphical methods for population forecasting.
QUANTITY OF WASTEWATER 39

Instead of using past trends to extrapolate future population, a better
way is to use data on population and residential land use for the area in
question from documents held by the jurisdiction’s planning depart-
ment, such as the general plan land use element, zoning ordinance, or
development plans for the planning horizon or design period. These data
may include population or residential dwelling unit densities in terms of
dwelling units (DU)/acre (1 acre 0.4 hectares). Typically, there may be
ranges of DU/acre and each range may have different persons/DU. For
example:
Low density 4 DU/acre 3.0 persons/DU
Medium density 4–10 DU/acre 2.8 persons/DU
High density 10 DU/acre (multifamily units) 2.5 persons/DU
Engineers should consult with planners or demographers to determine
which figures should be used. Professional planners should also be able
to inform the engineer as to which parts of the community will be devel-
oped before others. Engineers should keep in mind that general plans or
zoning ordinances might be periodically updated; the most current ver-
sions should be used.
Population forecasts may also be adjusted by a housing vacancy rate.
Obviously, forecasts would be larger if this rate was excluded (e.g., 0%
vacancy), but would be more accurate if this was included.
Population forecasts may include transients in hotel and motel rooms;
group quarters such as school dormitories, prisons, jails, long-term health
care facilities (nursing homes); and seasonal-use facilities such as camp-
grounds and resorts. Transient or seasonal population estimates, such as
for hotels and motels, can be converted to equivalent full-time residents
by using multipliers of the population fraction that is considered transient
or seasonal. Alternatively, these facilities can be included in the land use
forecast in Table 3-2 for institutions or commercial developments because
they may have kitchens and/or laundries.
These population or dwelling unit forecasts should be done for the
beginning and end of the design period to obtain the residential portion
of Q
avg1
and Q
avg2
. For accurate hydraulic design of sewers, these calcula-
tions are applied at many key points in the existing or proposed sewer
system. The area to be served should be divided into subareas defined
by topography, land uses, and pipe layout (existing or proposed). The
most downstream point of the subarea is the key point, which is usually
a manhole or pump station where the flow rate is larger than at upstream
key points. There are a variety of computer applications that can perform
such calculations rapidly. An example of a population and dwelling
unit forecast for a subarea at the end of the planning period is shown in
40 GRAVITY SANITARY SEWER DESIGN AND CONSTRUCTION

Table 3-2. There would be another version of Table 3-2 for the beginning
of the planning period.
3.4. LAND USE AND/OR EMPLOYEE FORECASTS
Once the design period or planning horizon has been established, the
next step in calculating nonresidential wastewater flow is to forecast the
land use and/or number of employees. Nonresidential wastewater is gen-
erated by employees in a manner similar to residential (i.e., toilets, sinks,
showers, and so forth). In each case, the business does not consume water
in products made or services rendered (i.e., services as opposed to manu-
facturing). Wastewater from manufacturing is considered separately in
Section 3.7.1.
As with residential population or dwelling unit forecasts, the best
source of data on nonresidential land use and number of employees is the
community’s general plan land use element, zoning ordinance, or devel-
opment plans for the planning horizon or design period, or for build-out
or saturation with no specific date. This forecast may include both net
land area and gross floor area. The number of employees depends on the
type of business and size of the building, which can be determined by
floor-to-area ratios (FARs) and floor area per employee.
QUANTITY OF WASTEWATER 41
TABLE 3-2. Example of a Residential Dwelling Unit (DU) or Population
Forecast for a Subarea at the Beginning or End of the Design Period
% Developed
at End of
No. of Planning Total
Residential Area, DU/ DUs Persons/ Horizon or Population
Land Use acres Acre (4) (2) DU Design Period (7) (4)
(1) (2) (3) (3) (5) (6) (5) (6)
Low Density/ 100 3 300 3.0 80 720
Rural
Medium 250 8 2,000 3.2 70 4,480
Density
High Density 150 16 2,400 2.5 60 3,600
Resort Hotel — — 300 1.0 70
(rooms) (reflects (occupancy 210
seasonal or rate)
transient
population)
Total 9,010
Note: acre 0.4 hectare.

As with residential land use, there may be many types of commercial/
industrial land use. Typical categories include:
• Office
• Commercial retail (neighborhood and regional)
• Commercial services (neighborhood and regional)
• Institutional
• Manufacturing and raw material processing
• Transportation
• Communication and utilities
• Industrial and commercial complexes
• Mixed urban or developed land
• Public assembly, recreational, cultural, and entertainment
• Resource extraction and exploitation.
Engineers should consult with planners or demographers to determine
which categories are relevant and the applicable FARs. Professional plan-
ners may also tell the engineer which parts of the community will be
developed before others. Engineers should further keep in mind that gen-
eral plans or zoning ordinances might be periodically updated.
These land use or employee forecasts should be done for the begin-
ning and end of the design period to obtain the nonresidential portion of
Q
avg1
and Q
avg2
. For accurate hydraulic design of sewers, these calcula-
tions are applied at many key points in the existing or proposed sewer
system. The area to be served should be divided into subareas defined by
topography, land uses, and pipe layout (existing or proposed). The most
downstream point of the subarea is the key point, which is usually a
manhole or pump station where the flow rate is larger than at the
upstream key points. There are a variety of computer applications that can
perform such calculations rapidly. An example of a land use or employee
forecast for a subarea at the end of the planning period is shown in Table
3-3. There would be another version of Table 3-3 for the beginning of the
planning period.
3.5. AVERAGE UNIT FLOWS
Once the population or dwelling unit (Section 3.3) and land use or
employees (Section 3.4) have been forecast, the third step is to apply unit
flows to obtain Q
avg1
and Q
avg2
. Unit flows are typically based on volume
per unit time per person, dwelling unit, floor area, land area, or employee.
The best sources of unit flows are previous or current wastewater flow
42 GRAVITY SANITARY SEWER DESIGN AND CONSTRUCTION

measurements for similar land uses. Unfortunately, wastewater flow
from specific parcels or geographical areas is not routinely measured or
metered. Wastewater at a treatment plant, however, is usually monitored
for a variety of reasons, such as allocating capital and operating and
maintenance (O&M) costs among agencies using the plant, designing
upgrades to the plant, and sizing new equipment. However, such flows
may represent many different land uses and unit flows may not reflect
future development.
Water consumption is usually metered and can provide a source of
information for unit wastewater flows. Such data must be for indoor water
use, such as water that enters the sewer system from household, office,
and commercial or retail appliances and fixtures (e.g., toilets, showers,
sinks, dishwasher, and laundry). The data record should represent time
when there is little or no outdoor water use, such as landscape irrigation
or car washing. Long-term records are preferable because short-term data
may include and periods when water use is not typical, such as droughts,
which could unrealistically skew the data. In some parts of the United
States this is winter water consumption because there is little outdoor
water use when it rains or snows. If only annual average daily water use
data are available, it may be possible to determine indoor water use with
an estimated percentage of total annual demand. Such percentages are a
function of climate and area irrigated (lot size and building footprint
area). In general, the percent indoor water use is lower for arid regions, as
shown in Table 3-4.
In some cases, water agencies have worksheets that can be adapted to
calculate per capita indoor water use. For such worksheets, the engineer
QUANTITY OF WASTEWATER 43
Table 3-3. Example of a Land Use or Employee Forecast for
a Subarea at the Beginning or End of the Design Period
% Developed
at End of Total No. of
Floor Floor Average Planning Employees
to-Area Area, ft
2
Floor Horizon (7) (4)
Area, Ratio (4) (2) Area/ or Design (5) [100
Land Use acres (FAR) (3) Employee/ft
2
Period (6)]
(1) (2) (3) 43,560 (5) (6) (rounded)
Office 20 0.7 609,840 300 60 1,220
Retail 15 0.5 326,700 1,000 70 229
Industrial 10 0.3 130,680 2,000 60 39
Total 1,488
Note: acre 0.4 hectare; ft
2
0.093 m
2
.

must obtain data (usually from the water purveyor) or make reasonable
assumptions about such factors as:
• Number of showers per day and length of each shower (time in min-
utes 2 to 5 gal/min).
• Number of toilet flushes per day (typically three to five) and gallons
per flush (typically 1.6 to 5.0).
• Use of faucets (washing, shaving, toothbrushing, food preparation,
dishwashing) and time used daily.
• Frequency of use of dishwasher and clothes washer, and gallons
per use.
The City of Tampa’s website has an example (http://www.tampagov
.net/dept_water/conservation_education/Customers/Water_use_calculator
44 GRAVITY SANITARY SEWER DESIGN AND CONSTRUCTION
TABLE 3-4. Residential Indoor Water Use as a Percentage
of Total Annual Water Use
a
Location % Indoor Use
Santa Barbara, Calif. 52
San Diego, Calif. 37
Goleta, Calif. 50
Riverside, Calif. 50
Palm Springs, Calif. 20–25
Albuquerque, N.M. 60
Brisbane, Australia 47
Northern Territory, Australia 40
Florida (statewide average) 50
Boulder, Colo. (citywide average) 57
Colorado Springs, Colo. 63
Denver, Colo. 40
Scottsdale, Ariz. 33
California (statewide average) 56
Pennsylvania (statewide average) 93
Sources: Quoted on City of Boulder, Colo. web site based on publications of cities listed or
data logger studies, http://bcn.boulder.co.us/basin/local/residential.html, accessed October
27, 2005.
a
Statewide averages for California and Pennsylvania are from the EPA web site: www
.epa.gov/watrhome/you/chapt1.html, accessed October 27, 2005.

.asp, accessed October 27, 2005). Although this is for residential use, it can
be adapted to nonresidential use with number of employees instead of
residents.
Many engineers use unit flows from textbooks or figures from other
jurisdictions. These data may be secondary sources quoting from older
references and should be used with caution. These older data may not
reflect (1) recent water conservation measures and installation of fixtures
and appliances that use less water; and (2) lifestyle changes, such as a
decreasing number of stay-at-home parents. In both cases, residential unit
factors are reduced.
To illustrate how water conservation measures affect water demand
forecasts, in 1984 the Texas Water Development Board predicted that
the most likely water demand in 2000 would be 25 million acre-feet
(1 acre-foot 1,234 m
3
). Six years later, assuming the adoption of major
conservation measures, the Board predicted water usage of about
14 million acre-feet. In fact, in 2000, Texans used 16.4 million acre-feet,
slightly above the 1990 prediction but some 9 million acre-feet below the
1984 most-likely scenario (Texas Water Development Board, undated).
In a study for Seattle, Washington, after installation of various water
conservation devices in a sample of 37 single-family detached homes,
average per capita indoor residential use dropped from 63.6 gal/
capita/day to 39.9 gal/capita/day—a 37% decrease. This decrease was
consistent for six months after the initial data readings were taken
(Deoreo et al., 2001).
Some jurisdictions may require the engineer to use allowances from
its own regulations. Such allowances may be quite conservative (high)
and lead to overdesign of sewers. If better data exist, those data should
be used.
Tables 3-5 and 3-6 are summaries of unit factors from recent studies.
3.6. AVERAGE FLOWS
Average wastewater flows (Q
avg1
and Q
avg2
from Section 3.1) are the
product of the residential and employment data (Sections 3.3 and 3.4) and
unit water factors (Section 3.5). To obtain flows for hydraulic design of
sewer pipelines:
1. Q
avg1
and Q
avg2
must be converted to design minimum, Q
min
, and design
maximum Q
max
(Section 3.9).
2. Other wastewater flows from infiltration/inflow (Section 3.8) and
industrial uses (Section 3.7) must be added.
An example of Q
avg1
or Q
avg2
calculation is shown in Table 3-7.
QUANTITY OF WASTEWATER 45

TABLE 3-5. Residential Wastewater Average Daily Flows
Unit Flow, gal/
Location and Land Use capita/day Remarks
Waterloo/Cambridge, 71 Indoor water use, spring and fall, 1996;
Ontario ⬃1,000 homes each location (AWWARF
Seattle, Wash. 57 1999).
Tampa, Fla. 66
Lompoc, Calif. 66
Eugene, Ore. 84
Boulder, Colo. 65
San Diego, Calif. 58
Denver, Colo. 69
Phoenix, Ariz. 78
Scottsdale/Tempe, Ariz. 81
Walnut Valley Water 68
District, Calif.
Las Virgenes Municipal 70
Water District, Calif.
East Bay Municipal Water 64 1994 survey of indoor water use of 600 homes
District, Calif. (Darmody et al. 1996).
Rural Wisconsin (specific 43 Indoor water use monitored from 11 rural
location not identified) homes in for 14–77 days each in early
1970s. Flows may be low because of use
of outhouses (EPA 1978).
Nationwide 66 (range Indoor water use for 210 residences (Brown
57.3–73.0) and Caldwell 1984).
Phoenix, Ariz. 71 (range Indoor water use for 90 residences over a
65.9–76.6) three-month period in 1989 (Anderson and
Siegrist 1989).
Tampa, Fla. 51 (range Indoor water use for 25 residences over a
26.1–85.2) three-month period in 1993 (Anderson
et al., 1993).
Milwaukee Metropolitan 64 Monitoring from six strictly residential
Sewerage District, Wisc. areas in July and August 1976 (Milwaukee
Metropolitan Sewerage District 2005).
East Bay Municipal District, 60 Indoor water use for service area, calendar
Calif. (Oakland and vicinity) year 2004; excludes 5 gal/capita/day for
leaks (EMBUD 2005).
Los Angeles, Calif. 90 Estimates based on water consumption
(City of Los Angeles 1992).
Stamford, Conn. 80 Wastewater flow based on billing records
(Jeanette Brown, City of Stamford, Conn.
Water Pollution Control Authority,
personal communication, 2005).
Winnipeg, Manitoba 56 average Based on indoor residential water use,
43–77 range excluding leaks, 1992. Range reflects the
number of people per household: higher
figure is fourlowefigure is for one (Griffin
and Morgan, undated)
Morgan Hill, Calif. 79–114 Low-medium density residential wastewater
flow meter data for 679 homes and
assumed three persons/DU 1990–1991.
Range of flows is probably due to
infiltration/inflow.
Note: gal/day 3.8 L/day.

3.7. OTHER
3.7.1. Industrial
Industrial wastewater typically is from a firm that uses water in manufac-
ture of products. For manufacturing industries, especially large factories,
water use and wastewater generation should be developed on a case-by-case
QUANTITY OF WASTEWATER 47
TABLE 3-6. Nonresidential Wastewater Average Daily Flows
Unit Flow, gal/acre/day (gad)
Location and Land Use or gal/employee/day (ged) Remarks
Los Angeles, Calif. 30 ged Estimates based on water
consumption (City of Los
Angeles 1992).
East Bay Municipal 30 ged Based on indoor water
District, Calif. consumption for faucets and
(Oakland and vicinity) toilets from residential data.
Stamford, Conn. 6–32 ged Wastewater flow based on
billing records. Range reflects
commercial establishments
without cafeterias to those
with cafeterias, showers, and
gyms (Jeanette Brown, City of
Stamford, Conn. Water
Pollution Control Authority,
personal communication,
2005).
Morgan Hill, Calif. 2,450 gad Flow monitoring in manhole
(mixed use) for two weeks in April, 1992.
Tributary area was 96 devel
oped acres: 24 retail, 31
hospital, 41 industrial, and
25 homes.
Note: gal/day 3.8 L/day; acre 0.4 hectare.
TABLE 3-7. Example of Average Wastewater Flow Computation
(Q
avg1
or Q
avg2
)
Demographic Factor Average Flow,
(Table 3-2 or 3-3) Unit Flow Factor gal/day
Residential 9,010 population 60 gal/person/day 540,600
Nonresidential 1,488 employees 30 gal/employee/day 44,640
Total 585,240
Note: gal/day 3.8 L/day.

basis. Industrial wastewater quantities may vary from little more than the
normal domestic rates to many times those rates. The type of industry to
be served, the size of the industry, operational techniques, and the
method of on-site treatment of wastewater are important factors in esti-
mating wastewater quantities. Furthermore, peak discharges may be the
result of flows contributed over a short time frame, such as a 10-hour
working period. Peak discharge to the sanitary sewer sometimes can be
reduced by the use of detention tanks or basins arranged to discharge at
smaller rates over longer periods or to discharge only during hours when
wastewater flows are small.
Water audits can be performed on individual industrial plants over a
period of time. That time period should reflect seasonal and other varia-
tions in water use by that industry. Water supply can be monitored and
tracked through the industrial process to determine how water is con-
sumed and disposed. Such audits are typically conducted by the water
supply agency to help industries use water wisely, reduce demand, and
thereby conserve water supply. The results of such audits may be useful
for wastewater forecasting.
3.7.2. Flow Monitoring
To obtain estimates of industrial or any other type of wastewater
flow, a program of flow monitoring may be warranted. This can be a
permanent or temporary installation in a manhole or other structure.
Individual customer water meters are also a type of flow monitoring
that can be used to estimate wastewater flows (Sections 3.1 and 3.5). The
following general discussion refers to flow monitoring related to waste-
water only.
Flow monitoring can occur at:
• Key locations in the sewer system.
• Individual industrial plants (as part of water audits above).
• Individual developments—residential or commercial.
• Wastewater treatment plants.
Results of flow monitoring are often used for cost and revenue alloca-
tions so that certain areas of the jurisdiction are charged at a rate based on
flow. In a multi-jurisdictional setting, flow monitoring results can be used
to properly allocate the costs of the sewer system and treatment plant
among the jurisdictions. For sewer design, flow monitoring results can
help in deriving unit flow factors as described in Section 3.5. For example,
a flow monitor may be installed in a manhole downstream of a 200-unit
residential development. The results would give flow per dwelling unit
48 GRAVITY SANITARY SEWER DESIGN AND CONSTRUCTION

for that type of residence that could be used elsewhere in the jurisdiction
for a similar housing type.
The choice of a location for a flow monitor for flow forecasting pur-
poses is based on several factors:
• Characteristics of land use upstream of the monitor location. Ideally, the
land use should be homogeneous, such as single-family residential,
multi-family residential, retail, office, hospital, school, etc.
• Site sewer and/or manhole characteristics, such as hydraulic features
(sags), grease buildup, cracks or other damage, as well as the possi-
bility of variances between recorded pipe sizes and slopes and
actual field conditions. For best results, flow direction should not
change abruptly going through the manhole and the manhole
should not have debris, brick, or any other objects that might disrupt
the flow.
• I/I contribution. If there are I/I issues upstream of the monitor loca-
tion, the I/I contribution would need to be separated from the base
sanitary flow. Meter site selection can be accomplished after review-
ing the collection system maps and preliminary field inspection of
any sanitary sewer overflow (SSO) locations. Each monitoring site
should be selected so that the footage of the collection system
upstream of the meter can be isolated for the purposes of determin-
ing extraneous I/I. Installation of rainfall meters across the study
area to measure rainfall intensity and duration throughout the mon-
itoring period can assist in establishing wet-weather capacity for
SSO analysis.
For flow forecasting, a monitoring period can be as little as a few weeks.
To perform a detailed analysis of I/I and pipe capacity, the period could
be up to six months to obtain data during both dry and wet weather. In
such cases, the objective is to monitor multiple rain events of varying
intensities to accurately assess the inflow response for each event.
Information obtained during the monitoring period can be used to
determine the following:
• Average daily flow—dry weather.
• Peak flow—dry weather.
• Average daily flow—wet weather.
• Peak flow—wet weather.
• Peak inflow rates.
• Total I/I volume.
A detailed discussion of flow meter technologies is beyond the scope of
this Manual. A general overview follows. Flow meters may be categorized
QUANTITY OF WASTEWATER 49

as direct-discharge and flow-velocity. The direct discharge method is
based on computing the flow using easily measured or sensed variables,
such as flow depth or pressure. Some examples are flumes, weirs, mag-
netic meters, and ultrasonic devices. Sensors that read flow depth or
pressure are of two basic types: wetted or submersible sensors, where the
level/velocity sensor is mounted in the flow stream and the sensor is
secured to a mounting band that fits snugly in the pipeline; and non-
contact sensors that are mounted in a level position above the flow
stream so that the signal is aimed at the flow and does not hit the pipe or
invert walls. Flow-velocity devices are based on measurement of velocity
applied to the cross-sectional area of the flow. Some examples are pro-
peller meters and dye tracers (Metcalf & Eddy, 1981). Regardless of
method used, results from flow monitoring should be verified using
existing pipe slopes and diameters to check whether there are anomalies
in the results.
3.8. INFILTRATION/INFLOW
Ideally, sanitary sewers should convey sanitary wastewater only. Sewer
pipe, regardless of material, is not designed, manufactured, or installed to
allow extraneous water to enter the pipeline. As a practical matter, how-
ever, sanitary sewer design capacity must include an allowance for the
extraneous water components of I/I that inevitably become a part of the
total flow.
3.8.1. Infiltration
Groundwater can enter sanitary sewers as infiltration through pipe
joints, broken pipe, cracks, openings in manholes, and similar defects in
sanitary sewer structures. Defective service connections also can con-
tribute appreciable quantities of infiltration. The presence of infiltration is
based on a groundwater table at or above the pipeline invert for at least a
portion of the year. Areas with deep groundwater below the pipe do not
generally show infiltration problems; however, this does not preclude
dealing with inflow issues, discussed in Section 3.8.2.
Before the use of compression-type gasket pipe joints, the bulk of infil-
tration in structurally sound pipe entered at pipe joints in older sanitary
sewers built with either cement-mortar, hot-poured bituminous, or cold-
installed bituminous materials. These joints were seldom satisfactory
because of the initial difficulty in constructing a watertight pipe joint and
normal deterioration of the joint material with time. Often, joint material
would slough to the pipe invert, resulting in a leaky joint at the crown.
50 GRAVITY SANITARY SEWER DESIGN AND CONSTRUCTION

Other sources of infiltration into new sanitary sewer systems can be
traced to defects in pipe soil foundation or pipe strength, faulty installa-
tion practices, or service connections. An engineer evaluating capacity of
older sewers should consider infiltration as a source of flow in that
pipeline if groundwater is present at or above the pipe invert at least part
of the year.
Use of compression-type gasket pipe joints made it possible to reduce
groundwater infiltration and leakage significantly. A detailed discussion
of pipe joints and joint materials is found in Chapter 8.
The best way to estimate infiltration quantities is with flow metering as
described in Section 3.7. In the absence of flow metering data, design of
extensions to existing systems should consider past practices and trends
in infiltration, with allowances made where necessary.
The selection of a capacity allowance to provide for infiltration should
be based on the physical characteristics of the tributary area, the type of
sewer pipe and pipe joints to be used, and sewer pipes in the existing san-
itary sewers. In general, the design infiltration allowance is added to the
peak rate of flow of wastewater and other components to determine the
actual design peak rate of flow for the sanitary sewer. A survey of infiltra-
tion allowances, which typically include inflow discussed in the next sec-
tion, is summarized in Table 3-8.
3.8.2. Inflow
Inflow is extraneous flow that enters a sanitary sewer from sources
other than infiltration, such as connections from roof drains, basement
drains, land drains, and manhole covers. Inflow typically results directly
from rainfall or irrigation runoff.
Historical tests made on manhole covers submerged in only 1 inch
(25 mm) of water indicate that the leakage rate per manhole may be from
20 to 75 gpm (1.3 to 4.7 L/sec), depending on the number and size of holes
in the cover (Rawn, 1937). Newer manholes with solid covers and without
pick holes would contribute less inflow. Illegal roof drain connections
also can overload smaller sanitary sewers. Rainfall of 1 inch/hr (25 mm/
hr) on 100 m
2
(1,080 sq ft) of roof area, for example, would contribute
inflow of up to 11 gpm (0.7 L/sec).
3.9. PEAK AND MINIMUM FLOWS
Design peak and minimum flows can be calculated by applying peak
factors to the average flows developed in previous sections or can be esti-
mated directly using the fixture unit method. The following procedure
QUANTITY OF WASTEWATER 51

52 GRAVITY SANITARY SEWER DESIGN AND CONSTRUCTION
TABLE 3-8. Infiltration/Inflow Allowances for Various Sewer Agencies
Agency Location Infiltration/Inflow Allowance Comments
a
Edmonton, Alberta 0.28 L/sec/ha for manholes www.edmonton.ca/portal/server.pt/
not located in sag locations; gateway/PTARGS_0_2_284_220_0_43/
0.4 L/sec/ha for man holes http%3B/CMSServer/COEWeb/
in sag locations. infrastructureplanningandbuilding/
waterandsewers/sewerguidelines
.htm, accessed October 27, 2005.
State of Oregon 2,000 gal/day/acre www.deq.state.or.uswq/wqrules/
340Div52ApxA.pdf, accessed October 27,
2005.
Lethbridge, 2.25 m
3
/day/ha www.lethbridge.ca/NR/rdonlyres/
Alberta 82DC4DE1-C54A-4981-AFDF-
1925E7699054/1077/Section5SANITARY
SEWER.pdf, accessed October 25, 2005.
Augusta, Ga. 25 gpd/inch-diameter/mile
London, Ontario 8,640 L/ha/day Environmental and Engineering Services
(0.100 L/sec/ha) Department, The Corporation of the City
of London. October, 2003.
Kingston, Ontario 0.14 L/ha/sec from residential
land, 28 m
3
/ha/day from
industrial, commercial,
and institutional lands.
Union County, N.C. 300 gpd/inch-diameter/mile
State of New 100 gpd/inch-diameter/mile www.gencourt.state.nh.us/rules/
Hampshire of pipe for sizes to 48 inches. envws700.html, accessed October 27,
200 gpd/inch-diameter/mile 2005.
for sizes more than 48 inches.
Municipality of 500 Imperial gpd/inch- www.antigonishcounty.ns.ca/
The County of diameter/mile of pipe MunicipalServiceSpecs.pdf, accessed
Antigonish, Nova October 27, 2005.
Scotia
Maryland 400 gal/day/acre www.mde.state.md.us/assets/document/
Department of the water/WastewaterCapacityMgmtGuidance
Environment .pdf, accessed October 27, 2005.
Note: gal 3.8 L; acre 0.4 hectare; in. 25.4 mm.
a
Web search on “infiltration allowance” sewer.
could be used for the peaking method—separately for the beginning and
the end of the design period:
1. Tabulate the average flows for each subarea; this would include all of
the subarea flows—including residential, employee, industrial, and I/I
flows. Each resulting flow is the estimate of average daily flow coming
from the subarea.

2. Accumulate the subarea average flows down through the entire sys-
tem. The resulting accumulated flows are the estimates of average
daily flows point-by-point (typically manhole-by-manhole) down
through the entire sewer system.
3. Apply peaking factors to each point (manhole) down through the sys-
tem, thus generating the peak 1-hour flows for all sewer reaches in the
system. The peak flows from Q
avq1
are the Q
min
values needed for self-
cleansing design; those from Q
avq2
are the Q
max
values needed for capac-
ity design.
3.9.1. Peak Factors
Peak factors discussed in this section (P
1
and P
2
from Section 3.1) com-
bined with the average flows from Section 3.6 give peak and minimum
flows that form the basis of hydraulic design for sewer pipelines. Histori-
cally, often only the peak flows were determined, but tractive force, self-
cleansing design requires that minimum flows be established as well.
Again, these minimum flows are not the smallest flows but, rather, the
largest 1-hour flow that occurs during the low-flow week of the design
life of the sewer reach being evaluated.
The flow of wastewater (exclusive of groundwater infiltration and
inflow) will vary continuously throughout any one day, with the lowest
flows usually occurring between 2
A
.
M
. and 6
A
.
M
. and the highest flows
occurring during the daylight hours. The I/I component usually remains
reasonably constant throughout the day except during and following
periods of rainfall.
The best sources for peak factors are recent flow measurements for
similar land uses. However, records of existing wastewater flows or water
demands are rarely complete enough to permit estimates of wastewater
minimum or peak flow.
There are some available data on peaking factors. A summary of
measured peaking factors for 24 sewer agencies in the United States is
presented in Table 3-9. These factors include I/I, not just sanitary dry-
weather flow. As such, relatively wet areas (such as the northwest)
had higher peaking factors, probably because of the influence of I/I.
Relatively arid areas (such as the southwest) had the lowest peaking
factors.
The data in Table 3-9 show that, in general, peak factors for maximum
wastewater flow vary inversely with population served (i.e., average
flows for entire cities). However, for individual sewers, peaks may be
much higher than shown because average flows will likely be smaller
than the data in this table [the smallest average flow was 6.0 mgd (22.8
million L/day)].
In general, peak factors decrease with increasing average flow. The far-
ther downstream in a sewer, the greater the average flow because the
QUANTITY OF WASTEWATER 53

population of area served is greater. Consequently, peak factors typically
decrease for downstream reaches. Higher peak factors for smaller areas
occur because small flows are sensitive to changes. For example, a slight
change in water use could mean a relatively large increase or decrease in
total wastewater flow for the area served. On the other hand, slight
changes in water use in larger areas would result in relatively small
increases or decreases in total flow for the area served.
As with rainfall-runoff calculations, the “time of concentration” in san-
itary flows determines when peak flows from a given area reach the
sewer. Although time of concentration, as applied in rainfall-runoff calcu-
lations, is not used in sewer flow calculations, the principle is similar in
that peak flows from consecutive areas do not reach a given point in a
sewer at the same time and, as a consequence, do not add. The accumu-
lated peak flow tends to attenuate in downstream sewer reaches where
there are larger areas and populations served and the average flows are
greater. Most empirical peak flow equations are based on the general
form PF K Q
n
or PF K Q
n
, where PF peak factor, K a coef-
ficient, Q average flow, and n an exponent 0.5 (see, for example,
Metcalf & Eddy 1981). Q in this format can also be population or some
other demographic factor.
Figures 3-1 through 3-4 are examples of the variations in rates of flow
for situations in which dry-weather wastewater flows are expected to
govern. Figure 3-1 shows the ratios of peak and minimum flows to aver-
age daily wastewater flow recommended for use in design by various
54 GRAVITY SANITARY SEWER DESIGN AND CONSTRUCTION
TABLE 3-9. Overall Peak Factors for Various Sewer Agencies
a
Agency Location Peak Factor Comments
Southeast 2.0
Central 2.4
Southwest 1.8
Northwest 3.8
Northeast 2.3
Agency Size
Large 2.1 Population served 500,000
Medium 2.6 Population served 100,000–500,000
Small 3.0 Population served 100,000
Source: American Society of Civil Engineers. (1999). “Optimization of collection system
maintenance frequencies and system performance.” ASCE/EPA Cooperative Agreement
No. CX824902-01-0, ASCE, Reston, Va.
a
For measured values only. Data reported as estimates are not included. Figures are
rounded to nearest 0.1.

authorities. Figure 3-2, based on dry-weather maximums, is the modifica-
tion of a chart originally prepared for the design of sanitary sewers for a
group of 18 cities and towns in the Merrimack River Valley in Massachu-
setts. The ratios given are approximately correct for a number of other
municipalities in the same general area. Figure 3-3 was developed by the
QUANTITY OF WASTEWATER 55
FIGURE 3-1. Ratio of extreme flows to average daily flow compiled from various
sources.
*Curve A source: Babbit, H. E., “Sewage and Sewage Treatment.” 7th Ed., John Wiley & Sons, Inc., New
York (1953).
Curve A
2
source: Babbit, H. E., and Baumann, E. R., “Sewage and Sewage Treatment.” 8th Ed., John Wiley
& Sons, Inc., New York (1958).
Curve B source: Harman, W. G., “Forecasting Sewage at Toledo under Dry-Weather Conditions.” Eng.
News-Rec. 80, 1233 (1918).
Curve C source: Youngstown, Ohio, report.
Curve D source: Maryland State Department of Health curve prepared in 1914. In “Handbook of Applied
Hydraulics.” 2nd Ed., McGraw-Hill Book, Co., New York (1952).
Curve E source” Gifft, H. M., “Estimating Variations in Domestic Sewage Flows.” Waterworks and
Sewarage, 92, 175 (1945).
Curve F source: “Manual of Military Construction.” Corps of Engineers, United States Army, Washing-
ton, D.C.
Curve G source: Fair, G. M., and Geyer, J. C., “Water Supply and Waste-Water Disposal.” 1st Ed., John
Wiley & Sons, Inc., New York (1954).
Curve A
2
, B, and G were constructed as follows:
Curve A
2
,
5
P
0.107
Curve B,
14
4 兹苶P
Curve G,
18
兹苶P
4 兹苶P

Bureau of Engineering, City of Los Angeles, and has been in use since
1962; for this curve, PF 2.64 Q
0.095
. The Los Angeles curve has been
checked with actual flow measurements and found to be generally accu-
rate (McKibben et al. 1994). Figure 3-4 shows peak residential wastewater
flow for the City of Toronto.
Engineers should use caution with curves or parameters developed
historically, since changing lifestyles (such as more women in the work-
force instead of staying at home; water conservation; and increasing use
of reclaimed water for residential irrigation) may result in attenuated
peaks from residential flow.
3.9.2. Fixture Units
In the 1940s, Dr. Roy Hunter of the National Bureau of Standards devel-
oped and published a methodology for determining necessary pipe sizing
by estimating maximum demand on the delivery and drainage systems
(Hunter 1940a, 1940b). This was developed because one of the major code
concerns was then, and is now, pipe sizing for supply and drainage piping
in a building. For supply and drainage, each type of fixture or appliance
(such as shower, toilet, sink, dishwasher, and laundry) is assigned a “fix-
ture unit value.”
56 GRAVITY SANITARY SEWER DESIGN AND CONSTRUCTION
FIGURE 3-2. Ratio of extreme flows to average daily flow in New England.
(Mgd 3,785 m
3
/day).

QUANTITY OF WASTEWATER 57
FIGURE 3-3. Ratio of peak flow to average daily flow in Los Angeles. (cfs 1.7
m
3
/min.)
It would be possible to calculate pipe sizes based on simultaneous use
of all fixtures in a building. However, the likelihood of this scenario is
very small. Actual peak flow would be a function of the probability of
fixture use at any time. Dr. Hunter used probability theory to assess the
problem of plumbing design loads and assumed that the operation of the
principal fixtures in a plumbing system could be considered as random
events. His goal was to quantify, on the basis of probability, a means of
sizing waste conduits based on usage demand at a probable “not to
exceed” fixture rate (Breese 2001).

Although modified over the years, Hunter’s basic work is still used as
the basis for pipe sizing in a plumbing system and it appears in many
plumbing codes. However, the original intent of Hunter’s work was for
design of building interior water supply and drainage piping and appur-
tenances, not sanitary sewers. Furthermore, Hunter cautioned that judg-
ment must be exercised regarding which values to use in his probability
function to obtain satisfactory results. His own assumptions were for
58 GRAVITY SANITARY SEWER DESIGN AND CONSTRUCTION
FIGURE 3-4. Peak residential wastewater flow for the City of Toronto, Ontario,
Canada (m
3
/sec/ha 14.5 cfs/acre; L/cap/day 0.26 gal/cap/day; ha
2.5 acre). Source: Department of Public Works, Toronto, Canada, 1980.

nearly continuous use of toilets, bathtubs, showers, and faucets. This may
be true in large office buildings, hotels, and multi-family dwellings, but
may not be warranted for lower-density residential or commercial areas
(AWWA 2004).
Use of the probability function is based on assumed values for certain
parameters for water supply:
• Average duration of flow for a given type of fixture for one use (e.g.,
flushing a toilet).
• Average time between successive operations of a given fixture (e.g.,
time between flushing toilets).
• Flow from a given fixture for each use (e.g., gal/flush for a toilet).
These values were based on experimental observations in the late 1930s
for flush toilets and bathtubs only. For toilets, flow ⬵ 27 gpm (1.7 L/sec)
which gives ⬃4 gal/flush (15 L/flush) based on 9 seconds to fill. Today’s
toilets use much less water, as low as 1.6 gal/flush (6.1 L/flush). For other
fixtures controlled by faucets, such as lavatories and sinks, where flows
and times are a matter of personal habits or preferences, figures are
derived based on reasoning that flows from these fixtures would be much
less than the peaks from toilets and/or bathtubs. In Hunter’s original 1940
publication (Hunter 1940a), there is no discussion of showers, dishwash-
ers, and clothes washers, probably because such fixtures and appliances
were not in widespread use at that time.
According to Hunter, the same probability functions and fixture units
can be generally be applied to estimates of wastewater loads. Conse-
quently, it is possible to use a fixture unit count in a group of buildings to
estimate the peak wastewater flow rate. The general procedure is as fol-
lows for building water supply, which is a conservative estimate of waste-
water flow:
1. Estimate the number of fixture units according to tables in the Uni-
form Plumbing Code (UPC) or the applicable plumbing code for the
jurisdiction.
2. Use the curves in AWWA Manual of Practice M22 (AWWA 2004) to
estimate peak demands for indoor water use. This AWWA manual
also has a section on irrigation water use, which should not be used for
wastewater forecasts.
For drainage, the procedure is not based on deriving peak flow rates but
is an indirect derivation of pipe size as follows:
1. Estimate the number of drainage fixture units according to tables in the
UPC or applicable plumbing code for the jurisdiction.
QUANTITY OF WASTEWATER 59

2. Use tables in the UPC or applicable plumbing code to determine the
pipe size based on the maximum number of drainage fixture units that
are allowed on a horizontal pipe. In the UPC, the tables are based on a
pipe slope of 0.25 inch/ft (20.9 mm/m or ⬃0.021) and should be
adjusted for actual pipe slopes.
It is suggested that the fixture unit method be used to check results of
the previous forecasting methods and not be used as a primary forecast-
ing tool.
3.9.3. Summary
The following procedure could be used for the peaking method—
separately for the beginning and the end of the design period:
1. Tabulate the average flows for each subarea; this would include all of
the subarea flows—including residential, nonresidential, and I/I flows.
Each resulting flow is the estimate of average daily flow coming from
the subarea.
2. Accumulate the subarea average flows down through the entire sys-
tem. The resulting accumulated flows are the estimates of average
daily flows point-by-point (typically manhole-by-manhole) down
through the entire sewer system.
3. Apply peaking factors to each point (manhole) down through the sys-
tem, thus generating the peak 1-hour flows for all sewer reaches in the
system. The peak flows from Q
avq1
are the Q
min
values needed for self-
cleansing design; those from Q
avq2
are the Q
max
values needed for
capacity design.
3.10. UNCERTAINTY IN FORECASTS
Forecasts of population, housing, land use, and/or employment
described in Sections 3.3 and 3.4 may be based on the best available
information, but are not statements of fact. They are considered opin-
ions about the future of a community that cannot be verified until the
forecast dates arrive. Consequently, there is a level of uncertainty in
forecasting. Engineers can deal with this uncertainty in a logical, rational
manner.
• Two or more planning scenarios. Often, planners will have multiple
planning scenarios that result in multiple forecasts of population,
housing, land use, and/or employment. There may also be several
60 GRAVITY SANITARY SEWER DESIGN AND CONSTRUCTION

unit water factors from Section 3.5 and/or peaking factors from Sec-
tion 3.9.1. Engineers may then develop two or more wastewater
forecasts, typically a maximum and a minimum, to see how those
forecasts affect the choice of pipe size.
• Sensitivity analysis. With judicious use of computer software, multi-
ple planning scenarios can be analyzed quickly and efficiently. By
varying the any of the components of forecasts, such as population,
employment, unit factors, etc., the effect on pipeline size(s) can be
determined. This type of analysis can be used to answer questions
such as what happens to sewer capacity if, for example:
a. A certain development is approved (or not approved) in 10 years.
b. The jurisdiction annexes an adjacent area.
c. There is redevelopment in a certain area that significantly
increases water use.
Sensitivity analysis based on optimized designs (lowest cost for the
given flow rates and constraints) will provide valuable information to
decision makers. Optimization can give cost differential information
based on the specific system under design rather than on generalized
rules of thumb, and thus allow for better decisions as to capacity and
other variables.
REFERENCES
American Society of Civil Engineers (ASCE). (1999). Optimization of collection
system maintenance frequencies and system performance. ASCE/EPA Coop-
erative Agreement No. CX824902-01-0, ASCE, Reston, Va.
American Public Health Association, et al. (APHA) (1981). Glossary, Water and
wastewater control engineering, third edition, APHA, Washington, D.C.
American Water Works Association (AWWA). (2004). “Sizing water service lines
and meters.” Manual of Water Supply Practices M22, AWWA, Denver, Colo.
American Water Works Association Research Foundation (AWWARF). (1999).
Residential end uses of water. AWWARF, Denver, Colo.
Anderson, D. L., and Siegrist, R. L. (1989). “The performance of ultra-low-volume
flush toilets in Phoenix.” J. Am. Water Works Assoc., 81(3), 52–57.
Anderson, D. L., Mulville-Friel, D. M., and Nero, W. L. (1993). “The impact of
water conserving plumbing fixtures on residential water use characteristics in
Tampa, Florida.” Proc. Conserv93 Conf., December 12–16, Las Vegas, Nev.,
ASCE, AWRA, and AWWA.
Baumann, D. D., Boland, J. J., and Hanemann, W. M. (1998). Urban water demand
management planning. McGraw-Hill, New York, N.Y.
Boland, J. J. (1998). “Forecasting urban water use: Theory and principles.” Urban
water demand management planning, D. D. Baumann, J. J. Boland, and W. M.
Hanemann, eds., McGraw-Hill, New York, N.Y., 77–94.
Breese, J. (2001). “Solving the mixed system problem.” Plumbing Engr., 29(3), 39–48.
QUANTITY OF WASTEWATER 61

Brown and Caldwell. (1984). Residential water conservation projects. Research Rep.
903. U.S. Department of Housing and Urban Development, Office of Policy
Development, Washington, D.C.
City of Los Angeles. (1992). Sewer design manual, Part F. Los Angeles Bureau of
Engineering, Los Angeles, Calif.
Darmody, J. et al. (1996). “Water use surveys—An essential component of effec-
tive demand management.” Proc., 1996 Ann. Conf. American Water Works Asso-
ciation, Toronto, Ontario, Canada, June.
Deoreo, W. D. et al. (2001). “Retrofit realities.” J. Am. Water Works Assoc., 93(3), 58–72.
East Bay Municipal Utilities District (EMBUD). (2005). Draft urban water manage-
ment plan. EMBUD, Oakland, Calif.
Griffin, D., and Morgan, D. (Undated). “A new water projection model accounts
for water efficiency.” Canada Mortgage and Housing Corporation, Ontario,
Canada. Available online at http://www.cmhc-schl.gc.ca/en/inpr/su/waco/
waar/waar_001.cfm, accessed February 27, 2007.
Hunter, R. B. (1940a). Methods of estimating loads in plumbing systems. Rep. BMS65.
U.S. Department of Commerce, National Bureau of Standards, Washington, D.C.
Hunter, R. B. (1940b). Plumbing manual. Rep. BMS66. U.S. Department of Com-
merce, National Bureau of Standards, Washington, D.C.
Jones, C. V., et al. (1984). “Municipal water demand.” Statistical and management
issues. Studies in water policy and management, No. 4, Westview Press, Boulder,
Colo.
Maryland Department of the Environment. (2006). “Wastewater capacity manage-
ment plans.” 2006 Guidance Document. Available at www.mde.state.md.us/
assets/document/water/WastewaterCapacityMgmtGuidance.pdf, accessed
May 29, 2007.
Mays, L. W. (2004). Urban water supply management tools. McGraw-Hill, New York,
N.Y.
McKibben, J. W., Bramwell, D., and Gautsch, J. M. (1994). “Wastewater collection
system planning with GIS in a large system.” Proc., Urban and Regional Informa-
tion Assoc. Annual Conf., Milwaukee, Wisc.
Metcalf & Eddy, Inc. (1981). Wastewater engineering: Collection and pumping of waste-
water. McGraw-Hill, New York, N.Y.
Milwaukee Metropolitan Sewerage District (MMSD). (2005). Cost recovery proce-
dures manual. MMDS, Milwaukee, Wisc.
Rawn, A. M. (1937). “What cost leaking manhole?” Waterworks and Sewage,
84(12), 459.
Texas Water Development Board. (Undated). “Water Quality in Texas: Supply
and Demand Projections.” Available at www.texasep.org/html/wqn/
wqn_6fut.html, accessed May 29, 2007.
U.S. Environmental Protection Agency (EPA). (1978). Management of small waste
flows. EPA 600/2-78-173, EPA Municipal Environmental Research Laboratory,
Washington, D.C.
62 GRAVITY SANITARY SEWER DESIGN AND CONSTRUCTION

4.1. INTRODUCTION
Sanitary sewers are considered a corrosive environment where many
different forms of corrosion can occur. All corrosion processes found in
sewers adversely affect both the structure and function of a wastewater
collection system, some more than others.
There are many different ways for wastewater collection systems to be
damaged from corrosion. This chapter discusses the various types of cor-
rosion common to typical municipal wastewater collection systems and
offers proven mitigation alternatives. This chapter can assist the utility in
determining where in the collection system corrosion may be occurring
and what can potentially be done to correct or control the problem. The
information in this chapter is not intended to eliminate the need for pro-
fessional corrosion engineering assistance.
4.2. CORROSION
4.2.1. History of Corrosion
Humans have been trying to understand and control corrosion for as
long as they have been using metal objects as tools and implements. The
first corrosion noted by ancient humans was likely corrosion of early
metal tools. With significant effort by early man, these tools were
wrought from naturally occurring metal ores abundant in the Earth’s
crust. Unlike our perplexed early ancestors, we know much more about
these early identified corrosion processes and have found a few more in
the process.
CHAPTER 4
CORROSION PROCESSES AND CONTROLS
IN MUNICIPAL WASTEWATER
COLLECTION SYSTEMS
63

Sewers, collection structures, and pump stations experience unique
corrosion processes which not only affect metals but also can destroy con-
crete, steel, or the entire structure over time. Most of us know that steel
will rust and that rusting is accelerated by moisture. Since sewers convey
water, we should anticipate that all surfaces associated with sewers
should also be wet and we should thus take precautions with iron-based
metals. Sewers are also prone to the production of hydrogen sulfide gas,
which can be biologically oxidized to sulfuric acid directly on the walls
and surfaces of sewer pipes and structures. The combination of moisture
and acidic conditions makes sewers particularly corrosive and warrants
special attention and consideration.
There is also evidence that hydrogen sulfide gas concentrations in sew-
ers are increasing due to the reduction of metals in wastewater required
by the Clean Water Act. Metal ions in wastewater react with sulfide to
form an insoluble precipitate so it cannot be released as hydrogen sulfide
gas. Certain heavy metals also exhibit a toxic effect on the anaerobic bac-
teria that produce sulfide in sewers. Removing these metals has caused a
general increase in wastewater sulfide and hydrogen sulfide gas. Increases
in sewer hydrogen sulfide gas concentration cause an increase in sulfuric
acid production and corrosion.
4.2.2. Sources of Corrosion
Corrosion, as experienced in the municipal wastewater industry, can
be defined as:
Any unintentional chemical, physical, biological or electrical process
involving the gradual deterioration, degradation or destruction of collec-
tion system components that is due to the performance of the intended
function of the system.
Rust is simply metal (usually iron-based) that has been oxidized back to
its natural state by reacting with oxygen in the air. The presence of water
increases the rate of this reaction. Figure 4-1 illustrates external surface
oxidation of a steel sluice gate.
Other corrosion processes affecting metal components can also be elec-
trochemical in nature, having the essential features of a battery. If the con-
ditions of the situation allow a current to flow from an area of higher poten-
tial (anode) to an area of lower potential (cathode), significant damage to
both the anode and the cathode can occur. If a metal component is exposed
to different oxygen concentrations in different areas, electrons will flow and
cause corrosion. The part of the metal with the lowest oxygen concentration
will act like the anode while the higher oxygen concentration part will act
like the cathode. This is called an oxygen concentration cell. Depending
64 GRAVITY SANITARY SEWER DESIGN AND CONSTRUCTION

upon the particular situation, the metal can become pitted, flaky, chalky, or
discolored, or might disappear completely.
The flow of electrons can also occur between two different metals if
placed into contact with each other. The flow of electrons between two
metals in contact with each other is governed by the susceptibility of the
particular metals to lose or accept electrons; this is termed galvanic corro-
sion. This effect can be concentrated locally to form a pit or it can extend
across a wide area to produce general wastage. Pitting can also provide
sites for fatigue initiation and can allow external corrosive agents to pene-
trate deeper and further degrade the metal. Figure 4-1 also illustrates the
severe pitting of an aluminum handrail bolted to a reinforced concrete
walkway (the white element on the left side of the photo).
In this picture, electrons are leaving the aluminum (anode) and travel-
ing through the concrete to the reinforcing steel (cathode). The sacrifice of
electrons by the aluminum reduces or stops the oxidation of the reinforc-
ing steel.
The flow of electrons in metals can also be induced by unrelated local
sources, such as electrical substations, trolley or subway power feeds, or
even high-tension power lines. The presence of external stray currents
can cause the flow of electrons in metal sewer pipes, causing part of the
CORROSION PROCESSES AND CONTROLS 65
FIGURE 4-1. External surface oxidation of a steel sluice gate.

sewer to act as the anode and part as the cathode, resulting in increased
corrosion.
Some industrial discharges contribute to corrosion either by a physical
characteristic of the wastewater or through biochemical reactions and
interactions that take place in the sewer. Low pH, high biochemical oxy-
gen demand (BOD), high sulfate, and high temperatures can all con-
tribute to accelerated corrosion in wastewater collection systems.
One form of corrosion experienced in some collection systems is also
known as erosion. Although erosion may not appear to fall into the realm
of corrosion, it fits the classical definition of corrosion as discussed above.
In some circumstances, flowing water and the debris load carried in a
sewer can cause physical erosion and removal of the invert of the pipe.
Although rare, erosion has been known to cut through the reinforcing
steel of concrete pipe, causing structural degradation of the sewer.
Perhaps the most well-known collection system corrosion problem is the
destruction of concrete pipe and structures by acid produced from hydro-
gen sulfide gas. Billions of dollars are spent annually repairing sewer dam-
age caused by just this single corrosion process. The damage is not caused
by hydrogen sulfide gas alone; common bacteria present in all sewers have
the special ability to consume hydrogen sulfide gas and excrete sulfuric
acid. These bacteria live above the waterline in sewers where exposure to
moisture, carbon dioxide, and oxygen are present. Since bacteria cause this
type of corrosion, it is termed microbiologically induced corrosion (MIC).
In this chapter, corrosion processes have been separated into biological
and nonbiological processes for convenience of discussion. MIC unques-
tionably causes the most damage to collection systems and is the result of
complex biological and chemical reactions taking place in the sewer. Due
to the importance and complexity of MIC in wastewater collection sys-
tems, it is discussed in Section 4.3.3.2 and in more detail in Section 4.4.
4.3. NONBIOLOGICAL CORROSION PROCESSES
Although some of the most dramatic corrosion experienced in collec-
tion systems results from biological processes generating hydrogen sul-
fide gas and sulfuric acid, serious damage and loss of service life also
occurs through nonbiological corrosion processes. These processes
employ chemical, electrical, and physical methods to corrode both metals
and concrete; they are discussed in the following sections.
4.3.1. Oxidation of Metals
All metals exhibit a tendency to be oxidized, some more easily than
others. In their natural form as ores, most metals are highly oxidized and
66 GRAVITY SANITARY SEWER DESIGN AND CONSTRUCTION

are combined with other elements in a relatively stable energy state.
Workable metals are extracted from ores through the application of a con-
siderable amount of energy (heat) that allows metal atoms to come
together and then cool into a crystalline structure with strong electrical
bonds. This is what gives metals their unique strength, but it also changes
their energy state to a higher, unstable level. Metals are constantly trying
to return to their natural, low-energy state through oxidation, which is
what we call rusting in the case of iron-based metals. When these metals
are then placed in certain environments they will combine chemically
with oxygen and other elements, transfer electrons, and form oxidized
compounds in an attempt to return to their more natural state with lower,
stable energy levels.
Most metals, particularly iron, will start to corrode on contact with
water. The oxygen in the water reacts with the iron to form ferrous and
ferric hydroxides. Moisture in the air, along with acids, bases, salts, and
other solid and liquid compounds, can also cause or enhance oxidation.
Metals will also corrode when exposed to gaseous chemicals such as acid
vapors, formaldehyde gas, ammonia gas, and sulfur-containing gases.
Most metals commonly used in wastewater collection systems are diva-
lent cations, meaning they have two extra positive charges in their basic
atomic structure. The atoms are constantly seeking negative charges to sat-
isfy their electrical stability. It just so happens that oxygen (from water
molecules) and sulfide (both found abundantly in sewers) have two excess
negative charges (electrons) to trade. Both oxygen and sulfide form ionic
compounds upon contact with metals. Hydrogen sulfide will readily give
up its two weakly bonded hydrogen atoms to form a strong ionic bond
with sulfide (S
u
) to form a metal sulfide. This is what makes hydrogen sul-
fide exposure turn the surface of copper and brass to a black or dark blue
compound of copper and nickel sulfide. Figure 4-2 illustrates this process.
4.3.1.1. Oxidation Controls
The oxidation of metals occurs at the surface. Protecting the surface of
metals against contact with oxidizing compounds will prevent oxidation.
This simple solution is more difficult to achieve than it sounds. Some met-
als oxidize to form a thin coating of oxidation product which protects the
underlying bare metal. Aluminum is a prime example of this type of oxi-
dation. The thin patina of aluminum oxide on the surface of aluminum
protects it against further oxidation. If the surface of aluminum is
scratched or abraded to remove this patina, oxygen in the air will quickly
re-form this oxidation layer.
Ferrous metals must be protected with a coating to prevent oxidation
in the moist, sulfide-prone environment of a sewer. The coating and pro-
tection of ferrous metals is an industry unto itself with many techniques
CORROSION PROCESSES AND CONTROLS 67

and products available to the engineer. It should be noted that surface
profile and preparation are crucial to the success of any coating process.
One of the best ways to prevent metal oxidation in sewers is to avoid
the use of metals, or restrict metals to those that can withstand the corro-
sive environment of a sewer. The only common metal alloy that has been
shown to resist the corrosive sewer environment satisfactorily is Grade
316 stainless steel (316 SS). 316 SS is the standard molybdenum-bearing
grade of stainless steel, second in importance to 304 SS among the
austenitic stainless steels. Austenitic stainless steels have high ductility,
low yield stress, and relatively high ultimate tensile strength when com-
pared to typical carbon steel.
A carbon steel, on cooling, transforms from austenite to a mixture of
ferrite and cementite. With austenitic stainless steel, the high chrome and
nickel content suppress this transformation, keeping the material fully
austenitic upon cooling. (The nickel maintains the austenite phase upon
cooling and the chrome slows down the transformation so that a fully
austenitic structure can be achieved with only 8% nickel.) Along with
nickel and chrome, the addition of molybdenum gives 316 SS better over-
all corrosion resistance properties than 304 SS, particularly higher resist-
ance to low-concentration sulfuric acid environments such as sewers.
68 GRAVITY SANITARY SEWER DESIGN AND CONSTRUCTION
FIGURE 4-2. Color change of brass due to direct reaction with H
2
S.

Figure 4-3 shows a submersible pump station with 304 SS pump guide
rails that have corroded due to the presence of hydrogen sulfide gas.
Stainless steel has a very thin and stable oxide film rich in chrome. If
damaged, this film re-forms rapidly by reaction with the atmosphere. The
surface can also be chemically passivated to enhance corrosion resistance,
if desired (passivation reduces the anodic reaction involved in the corro-
sion process).
4.3.2. Electrochemical Corrosion
The following paragraphs summarize the basics of electrical corrosion
as it applies to the municipal wastewater industry. The discussion is not
intended to be a complete treatment of the subject of electrical corrosion,
but the reader will gain an appreciation of the causes and implications of
corrosion so that appropriate measures can be taken.
The type of corrosion mechanism and its rate of attack depend on the
exact nature of the environment (air, soil, water, seawater) in which the
corrosion takes place. In today’s wastewater collection systems, the waste
products of various chemical and manufacturing processes find their way
into the air and waterways, and sewers generate many other unfavor-
able substances. Many of these substances, often present only in minute
amounts, act as catalysts, accelerants, or inhibitors of the corrosion
CORROSION PROCESSES AND CONTROLS 69
FIGURE 4-3. Corrosion of 304 SS guide rails under moderate H
2
S exposure.

process. The corrosion engineer then needs to be on the alert for the
effects of these contaminants.
The first step in preventing material corrosion is understanding its spe-
cific mechanism. The second and often more difficult step is designing a
type of prevention.
4.3.2.1. Oxygen Concentration Cell Corrosion
One of the simplest examples of electrochemical corrosion is oxygen
concentration cell corrosion of metal pipe in a collection system. An oxygen
concentration cell can develop at any point on a metal surface where there
is a difference in oxygen concentration between two points. For instance, if
aerobic and anaerobic environments both exist on the surface of the same
piece of metal or pipe, an oxygen concentration cell can form. Typical loca-
tions of oxygen concentration cells in collection systems are iron or steel
gravity sewers or force mains flowing partially full. The area of the pipe in
contact with the anaerobic slime will contain no oxygen, whereas the upper
pipe is exposed to atmospheric oxygen and dissolved oxygen in the bulk
flow. Oxygen cells can also develop under gaskets, wood, rubber, plastic,
and other materials in contact with the metal surface where anaerobic
conditions can form. Corrosion will occur at the area of low oxygen con-
centration (anode), which can be anywhere at or below the waterline.
Oxygen concentration cell corrosion can be prevented by sealing the
entire surface of the pipe or structure from contact with oxygen with a
coating or lining or by using nonferrous materials. Although the condi-
tions for oxygen concentration cell corrosion exist everywhere, they are
typically not a significant corrosion concern in collection systems.
4.3.2.2. Galvanic Corrosion
Perhaps the best-known of all corrosion types is galvanic corrosion,
which occurs at the point of contact between two metals or alloys with
different electrode potentials. An example of this might be aluminum in
contact with steel or iron. The aluminum becomes anodic and suffers the
effects of oxidation while protecting the iron. Whenever two dissimilar
metals are in contact, the potential for the flow of electrons exists. And
whenever electrons flow, one of the metals is being oxidized.
A tabulation of the relative strength of this tendency to oxidize is called
the galvanic series. Knowledge of a metal’s location in the series is an
important piece of information to have in making decisions about its
potential usefulness in contact with other metals. Table 4-1 is a listing of
the galvanic series of common metals used in wastewater engineering.
An obvious area of concern is the use of one type of metal in bolts,
screws, and welds to fuse together pieces of another metal. The combina-
tion to be desired is the large anode–small cathode combination, rather
70 GRAVITY SANITARY SEWER DESIGN AND CONSTRUCTION

than the reverse. Bolts, screws, and so on should be made of the metal less
likely to be oxidized so that the bolt or weld is cathodically protected. For
example, you can bolt a large aluminum hatch cover down with steel
bolts, but do not use aluminum hangers to support a ductile iron pipe.
Similar electrical potentials may also be developed between two areas
of a component made of a single metal as a result of small differences in
composition, structure, or the conditions to which the metal surface is
exposed. Just as in the oxygen cell corrosion discussed above, that part of
a metal component which becomes the corroding area is called the
anode; that which acts as the other plate of the battery is called the cath-
ode and does not corrode, but it is an essential part of the system. Of
great importance is the conductivity of the corroding solution—in this
case, wastewater. When large areas of the surface are in contact with
wastewater of high conductivity, such as that containing seawater, the
attack on the anodic metal may spread far from its contact point with the
cathodic metal.
4.3.2.3. Stray Current Corrosion
Stray currents, which can cause corrosion in metals, may originate
from direct-current distribution lines, substations, or street railway sys-
tems, etc. and flow into a pipe system or other steel structure. Alternat-
ing currents very rarely cause corrosion. The corrosion resulting from
CORROSION PROCESSES AND CONTROLS 71
TABLE 4-1. Galvanic Series Listing
Alloy Voltage Range Versus Reference Electrode
a
Magnesium 1.60 to 1.63
Zinc 0.98 to 1.03
Aluminum Alloys 0.70 to 0.90
Cast Irons 0.60 to 0.72
Steel 0.60 to 0.70
Aluminum Bronze 0.30 to 0.40
Red Brass, Yellow Brass 0.30 to 0.40
Copper 0.28 to 0.36
400 Series Stainless Steels 0.20 to 0.35
Monel 0.04 to 0.14
300 Series Stainless Steels 0.00 to 0.15
Hastelloy C-276 0.10 to 0.04
Graphite 0.30 to 0.20
a
A saturated calomel electrode.

external stray currents is similar to that experienced from galvanic cells
(which generate their own current), but different remedial measures may
be indicated. Just like the galvanic cell, the corroding metal from stray
currents is again the anode from which current leaves to flow to the cath-
ode. Soil and water characteristics also affect the corrosion rate in the
same manner as with galvanic-type corrosion.
However, stray current strengths may be much higher than those pro-
duced by galvanic cells and, as a consequence, corrosion may be much
more rapid. Another difference between galvanic-type currents and stray
currents is that the latter are more likely to operate over long distances,
since the anode and cathode are more likely to be remotely separated
from one another. Seeking the path of least resistance, the stray current
from a foreign installation may travel considerable distances along a
pipeline, causing severe corrosion only where it leaves the line. Knowing
when stray currents are present becomes highly important when reme-
dial measures are undertaken, since a simple sacrificial anode system is
likely to be ineffectual in preventing corrosion under such circumstances.
Testing and monitoring can be performed to measure the potential threat
to metal pipelines from stray current corrosion. If in the vicinity of power-
ful direct current sources, metal pipelines should be thoroughly protected
against stray current corrosion by consulting with a qualified corrosion
professional.
4.3.2.4. Soil Corrosion
The response of iron and carbon steel to soil corrosion depends prima-
rily on the nature of the soil and certain other environmental factors, such
as the availability of moisture and oxygen. These factors can lead to
extreme variations in the rate of corrosion. For example, under the worst
conditions buried steel pipe may perforate in less than one year, whereas
archeological digs in arid desert regions have uncovered iron tools that
are hundreds of years old.
In general, some basic guidelines can be formulated to generally char-
acterize soil corrosion and its severity.
Soils with high moisture content, high electrical conductivity, high acidity, and
high dissolved salts will be most corrosive.
One important mechanism in the soil corrosion processes is oxygen con-
centration cell corrosion (also discussed above), in which the oxygen con-
centration in the soil varies from place to place. An underground pipe
that passes from clay to gravel will have a high oxygen concentration in
the gravel region and almost no oxygen in the impermeable clay. The part
of the pipe in contact with the clay becomes anodic and suffers damage.
72 GRAVITY SANITARY SEWER DESIGN AND CONSTRUCTION

A similar situation is found where a pipe passes under a road. The sec-
tion under the road (which is more difficult to get to for repair) is oxygen-
deprived and will suffer the greatest damage.
4.3.2.5. Electrochemical Corrosion Controls
Preventive measures for oxygen cell corrosion involve the use of pro-
tective coatings and modification of the moisture and oxygen environ-
ment. Coatings are the most common protection used to slow the rate of
atmospheric corrosion. Many other materials, such as plastics, ceramics,
rubbers, and even electroplated metals, can be used as protective barriers.
The corrosion resistance of a metal can be greatly increased by the proper
choice of alloys. For example, nickel, chrome, and molybdenum added to
steel will increase its corrosion resistance. This is why 316 SS is the pre-
ferred metal choice for collection systems.
What can you do to minimize galvanic corrosion? First, always try to
eliminate the cathodic metal by making all parts of a structure out of the
same material. When this is not possible, use nonmetallic, nonabsorbent
washers and insulators between the dissimilar metals to prevent current
flow. For example, use plastic or ceramic washers and sleeves to isolate
bolts as they pass through a plate of a different alloy instead of fiber and
paper washers, which absorb water.
Selection of the proper alloys and connectors is also critical in prevent-
ing damage from galvanic corrosion. Knowledge of the position of a
metal on the galvanic series is an important factor in the proper selection
of metals for collection system use. If dissimilar metals are to be in con-
tact, make the voltage difference between them as small as possible (see
Table 4-1, Galvanic Series Chart). When the two metals in a galvanic cou-
ple are close together on the series, such as yellow brass and copper, their
voltage ranges overlap and either one can be the anode, depending on the
exact exposure conditions. When the metals are far apart on the chart,
there is a greater tendency for electrons to flow from the anodic metal to
the cathodic metal. On rare occasions it may be necessary to use an
impressed current to stop galvanic corrosion. Connecting a low-voltage
direct current source to the metal to be protected provides a ready source
of electrons to the cathode and stops anodic oxidation.
Stray current corrosion can be minimized by identifying sources of stray
currents in the vicinity of buried metal infrastructure and insulating or
reducing their effect. In the absence of this knowledge, an impressed current
with a higher potential than the stray current(s) will protect the structure.
The cure for soil corrosion can be isolation from low-oxygen environ-
ments (wrapping pipe in plastic), cathodic protection, or both. Cathodic
protection involves the use of a sacrificial anode such as zinc or alu-
minum. In this situation, the metal to be protected is connected electrically
CORROSION PROCESSES AND CONTROLS 73

to a buried piece of scrap zinc or aluminum that will take its place as the
anode. The anode is destroyed by the corrosion reaction, leaving the cath-
ode intact. This technique is still used extensively to protect underground
gas, sewer, and water pipelines from many forms of electrochemical cor-
rosion. Wrapping pipe in plastic sheeting before burial insulates the pipe
from varying oxygen concentration soils and groundwater and reduces
the flow of electrons from the pipe.
4.3.3. Industrial Discharges
Some industries and other sewer users discharge materials into the col-
lection system that will adversely impact corrosion rates. Some utilities
regulate discharges into their collection system for the purpose of protect-
ing infrastructure and preventing upsets to the treatment plant. Many
chemicals that are not commonly regulated can have dramatic impact on
collection system corrosion.
4.3.3.1. Chemical Industrial Discharges
• Low pH. Low-pH discharges are commonly regulated primarily to
protect downstream biological treatment processes. Low-pH dis-
charges destroy natural alkalinity in the wastewater which is
needed by the treatment plant to offset the impacts of nitrification. If
added in sufficient quantity, they can depress the local pH of the
wastewater, causing damage to concrete and other cementitious
sewer materials. Typical Type II Portland cement concrete can with-
stand an external pH of 6 nearly indefinitely with only minor surface
damage; however, a pH shift to 5 increases the corrosion damage sig-
nificantly. Regulating discharges to a minimum pH of 6 at the point
of discharge is a reasonable and prudent means to prevent concrete
damage from low-pH discharges.
Low-pH discharges also impact metal corrosion by providing a
rich source of hydrogen ions (H
) to react with electrons lost from
metals in an oxygenated environment. By consuming electrons, the
hydrogen ions are completing the circuit and causing the flow of
electrons and accelerated corrosion of the metal. Low-pH waters
also enhance the rusting oxidation process by making the oxidized
iron more soluble, leading to accelerated corrosion. If the pH of
water in contact with aluminum drops below 6, the protective layer
of oxide is dissolved, which leads to surface metal loss and potential
damaging corrosion.
• High pH. High-pH discharges do very little harm to wastewater
infrastructure in the normal pH ranges between 7 and 9. Most utili-
ties regulate discharge pH to a maximum of 9 to prevent upset to the
74 GRAVITY SANITARY SEWER DESIGN AND CONSTRUCTION

downstream biological treatment facility. When the pH of waste-
water exceeds 9, there is greater risk of damage to immersed alu-
minum since the natural protective covering of aluminum oxide is
dissolved in high-pH solutions. Typically, wastewater pH values
above 10 would be required to damage immersed aluminum. The
use of aluminum should therefore be minimized around caustic
storage tanks and inside the spill containment zone. Aluminum
flashing should not be used over caustic piping insulation for this
same reason. Figure 4-4 shows what happens to aluminum in con-
tact with leaking caustic. Note that the metal is completely dissolved
and missing.
• Reverse Osmosis (RO) Water. Many industries that intensively use
metals make attempts to recover the metals for economic or regula-
tory reasons. Metal plating, photograph finishing, and microchip
CORROSION PROCESSES AND CONTROLS 75
FIGURE 4-4. Aluminum corrosion due to contact with high pH (caustic).

manufacturing are the most common industries recovering metals
today. Many times, reverse osmosis equipment is used to capture
these metals or other compounds for recovery or recycling. The RO
process produces essentially pure water as a reject stream when used
in this fashion. Pure water, with little or no buffering by other com-
pounds and elements, can be extremely corrosive to both concrete
and metals. When pure water produced by an RO system comprises
more than 10% of the flow in the receiving wastewater stream, it can
cause serious damage or collapse of a concrete or metal sewer. Con-
crete sewers have been completely destroyed in less than a year by
wastewater containing more than 50% RO-produced water. Utilities
should be aware of the serious impacts of pure water RO discharges
and should include this discharge on the list to be monitored and
controlled. RO water can be rebuffered by allowing it to come into
contact with carbonate-containing rocks for a sufficient time before
discharge to the sewer. The carbonate rocks will be destroyed in the
process and will need replacement.
• Solvents. Solvents are commonly regulated by receiving utilities,
although there is no standard list of prohibited solvents. Most often,
solvent discharges are regulated (based upon flammability and
health impacts) to concentrations low enough where municipal
wastewater systems are unaffected from a corrosion standpoint.
However, many more plastic- and petrochemical-derived materials
are being used in wastewater collection systems. Although rare,
some of these pipe materials can be damaged or dissolved by high
concentrations of some solvents and industrial waste products.
• High Sulfide. Wastewater with high sulfide concentrations should be
prevented due to the subsequent release of hydrogen sulfide gas
and microbiological corrosion. Many utilities regulate sulfide dis-
charges to 0.5 mg/L or less to mitigate corrosion caused by direct
sulfide discharges.
4.3.3.2. Microbiologically Induced Corrosion-Enhancing Discharges
Some industrial discharges can accelerate or aggravate MIC. For a
detailed discussion of how these industrial discharges accelerate corro-
sion and how to quantify their effects, see Section 4.4. Some common
MIC-enhancing industrial discharges include:
• High Biochemical Oxygen Demand (BOD). BOD is a food source for the
bacteria involved in sulfide generation and sulfide-related corro-
sion. Industrial discharges containing high BOD that result in elevated
sewer BOD concentrations above 250 mg/L can allow these bacteria
to flourish and generate elevated concentrations of sulfide, resulting
76 GRAVITY SANITARY SEWER DESIGN AND CONSTRUCTION

in elevated corrosion rates. Most utilities either regulate high-BOD
discharges or place a surcharge on customers based upon BOD.
Typically, the surcharge is based upon the cost of treatment at the
plant without regard to the increased odor and corrosion caused by
such discharges. The rate of MIC is proportional to wastewater BOD
concentration.
• High Temperature. High-temperature discharges accelerate biological
corrosion by increasing the metabolic rate of the bacteria causing the
corrosion. The rate of biological sewer corrosion will double with
each 13 °F (7 °C) rise in water temperature. The severity of sewer
corrosion will significantly increase downstream of high-temperature
discharges. Some utilities regulate the temperature of a discharge
without regard to the downstream temperature increase. Many util-
ities regulate the temperature of discharges to prevent more than a
5 °F (3 °C) rise in the downstream flow. Figure 4-5 presents data that
indicate an increase in sulfide production with increasing waste-
water temperature.
CORROSION PROCESSES AND CONTROLS 77
FIGURE 4-5. Water temperature effect on sulfide generation.
Adapted from Pomeroy, R., and F. D. Bowlus. (1946). “Progress Report on
Sulfide Control Research,” Sew. Works J., 18(4): 597–640.

• High Sulfate. The primary source of sulfide in wastewater collection
systems is sulfate that has been biologically converted (reduced) to
sulfide. Bacteria living in the submerged slime layer in the sewer use
sulfate (SO
4
u
) as a source of oxygen and discharge sulfide (S
u
) as a
by-product. High-concentration sulfate discharges allow these sul-
fate-reducing bacteria to flourish and produce elevated concentra-
tions of sulfide, resulting in increased MIC. Figure 4-6 shows data
from an experiment to determine the effect of initial sulfate concen-
tration on final sulfide concentration.
• Seawater. Although seawater is not an industrial discharge, it does
enter wastewater collection systems through infiltration and sea-
water-flush collection systems. The average seawater sulfate con-
centration is around 3,000 mg/L, so a little seawater significantly
increases the wastewater sulfate concentration. Sewers under the
influence of seawater always experience higher rates of sulfide gen-
eration, corrosion, and odor complaints than do other sewers. In
high-seawater-concentration systems, the increased conductivity
of the wastewater also often results in increased electrochemical
corrosion processes in metals. The high ionic strength of seawater
78 GRAVITY SANITARY SEWER DESIGN AND CONSTRUCTION
FIGURE 4-6. Sulfate effect on sulfide generation in sewers.
*Initial sulfate concentration.
Adapted from Pomeroy, R., and F. D. Bowlus. (1946). “Progress Report on
Sulfide Control Research,” Sew. Works J., 18(4): 597–640.

conducts electrons faster than fresh water, allowing more rapid
destruction of affected metals.
4.3.3.3. Industrial Discharge Controls
Regulating industrial discharges is a full-time job for most utilities.
Many federal, state, and local regulations pertain to the control, pretreat-
ment, and discharge of industrial wastes being discharged to publicly
owned treatment works (POTWs). Discharge regulations commonly con-
trol pH, temperature, fats, oil and grease, and BOD, and provide meas-
ures to monitor these parameters. Some typically unregulated constituents
of industrial wastewaters can dramatically impact downstream MIC. As
an example, most industries are not monitored for sulfate or sulfite con-
centrations. Excessive sulfate and sulfite discharges into municipal waste-
water provide a rich source of oxidized sulfur, which is used by the slime
layer biology and converted to sulfide. The increased sulfide leads to
increased hydrogen sulfide generation and increased sulfuric acid corro-
sion impacts. Figure 4-7 illustrates the change in hydrogen sulfide con-
centration downstream of a high-sulfate industrial source during a period
when the industry was not discharging. As the data suggest, the high-
sulfate discharge was responsible for more than 85% of the hydrogen sul-
fide being generated.
CORROSION PROCESSES AND CONTROLS 79
0
500
1000
1500
2000
2500
3000
6/26/00 12:00 AM
6/26/00 5:00 PM
6/27/00 1:00 AM
6/27/00 9:00 AM
6/27/00 7:00 PM
6/28/00 9:10 AM
6/28/00 2:30 PM
6/28/00 10:00 PM
6/29/00 5:30 AM
6/29/00 11:30 AM
6/29/00 5:30 PM
6/30/00 1:30 AM
6/30/00 8:30 AM
7/5/00 2:15 PM
7/6/00 2:00 PM
7/7/00 11:00 AM
7/10/00 11:15 AM
7/11/00 12:00 PM
7/12/00 9:30 AM
7/13/00 9:30 AM
7/13/00 10:00 PM
7/14/00 3:05 PM
7/17/00 2:52 PM
7/18/00 2:40 PM
7/19/00 1:40 PM
7/20/00 10:45 AM
7/21/00 9:45 AM
7/24/00 9:15 AM
7/25/00 9:15 AM
7/25/00 3:25 PM
7/26/00 1:55 PM
7/27/00 2:55 PM
Sample Date and Time
Sulfate at SL01 (mg/L)
0
5
10
15
20
25
Sulfide at SL02 (mg/L)
SULFATE AT SL01 Sulfide at SL02: Gastec Tube
Shutdown Peri o
d
FIGURE 4-7. Effect of industrial sulfate discharge on sewer sulfide generation
and hydrogen sulfide gas production.

Regulating industries for excessive sulfate and sulfide has begun
in some agencies. Because background wastewater sulfate concentra-
tions vary by location, regulating specific concentrations must be left
up to local authorities. Commonly, industrial discharges are allowed
to increase the local sewer background sulfate concentration by some
agency-established percentage to avoid excessive sulfide-related odor
and corrosion impacts.
4.3.4. High-Sulfate Groundwater
High sulfate groundwater concentrations (above 100,000 mg/L), when
continuously present, can cause damage over time to exposed concrete
and calcium carbonate aggregates. The sulfate reacts with the calcium of
concrete, turning it into structurally weak and soluble calcium sulfate
(gypsum). Sulfate corrosion is not to be confused with MIC, which is
caused by biological oxidation of hydrogen sulfide gas to sulfuric acid.
Concentrations of sulfate high enough to cause sulfate corrosion of concrete
rarely exist in domestic wastewater. Even if such high concentrations
were present inside the sewer, they would not support sulfate corrosion
due to the protective layer of bacteria covering the concrete surface. How-
ever, the high sulfate would cause severe odor and MIC problems.
Damaging concentrations of sulfate can be found in some groundwa-
ters, particularly those under the influence of geothermal or volcanic
geology. Scandinavian countries, Hawaii, Japan, and some localized areas
of China, Russia, and the United States have groundwater sulfate concen-
trations high enough to cause severe sulfate corrosion. The use of Type V
sulfate-resistant cements can often control sulfate attack from high-sulfate
groundwaters. In severe environments (sulfate 20,000 mg/L), the out-
side surfaces of concrete pipes are protected with a coating or liner at the
time of burial to protect against sulfate corrosion. Of course, if any of the
high-sulfate groundwater would enter the sewer through infiltration it
would accelerate MIC, similar to a high-sulfate industrial discharge.
4.3.5. Erosion
4.3.5.1. Water Erosion
A form of corrosion found in municipal wastewater collection systems
actually results from physical erosion of concrete and steel by wastewater
and its components. Sewer tunnels are in common use today. In order to
use these deep, large-diameter systems, the wastewater must be dropped
(sometimes considerable distances) into the tunnel. As the water falls
downward through the dropshafts, it gains kinetic energy which is dissi-
pated when it strikes the bottom. If the water impinges directly onto con-
crete or steel, the force of the water and the grit and debris in the water
80 GRAVITY SANITARY SEWER DESIGN AND CONSTRUCTION

will eventually physically erode the surface. If left to continue, the erosion
will eventually breach the pipe and potentially cause structural failure of
the pipe. Allowing the water to fall into a plunge pool causes the kinetic
energy of the water to be dissipated harmlessly by the water, as illus-
trated in Figure 4-8.
The plunge pool absorbs the kinetic energy of the falling wastewater
without damage to the concrete underneath. Similar erosion can be expe-
rienced along very steep-sloped sewers carrying wastewater at supercrit-
ical velocity.
4.3.5.2. Debris Erosion
Erosion can also destroy the invert of some collection system trunk
sewers and tunnels. All sewers convey a certain amount of grit, gravel,
and bottomload. When the conveyed materials are large enough and hard
enough, the impacts of tumbling hard debris can take a toll on the con-
crete invert of a sewer. Invert erosion is more likely in large interceptors
that receive flow from older corroding concrete pipe sewers with river
gravel (100% silicate) aggregate. Upstream MIC dissolves the concrete
matrix and loosens the acid-resistant river gravel aggregate, which then
falls into the flow and gets washed downstream. If the volume of the for-
mer aggregate is large, the impacts caused by tumbling rocks down the
sewer act like micro-jackhammers which, over time, will remove the con-
crete in the invert of the sewer. In one severe case, erosion actually cut
CORROSION PROCESSES AND CONTROLS 81
FIGURE 4-8. Typical plunge dropstructure for energy dissipation.

through the concrete and the reinforcing steel in the bottom of the pipe,
causing structural compromise. It is possible for erosion to cut completely
through a concrete, steel, or plastic pipe. Erosion has been most often
associated with major concrete sewers downstream of corroding, unpro-
tected concrete pipe with river gravel or granite aggregate. Most erosion
has been noticed in pipes with a diameter range between 42 and 84 inches
(1,067 mm and 2,134 mm) and average daily flow velocities greater than
2.5 ft/sec (0.75 m/sec).
4.3.5.3. Erosion Controls
Control of erosion can be accomplished by intercepting the tumbling
aggregate in gravel or sand traps constructed in-line on the sewer. Replac-
ing or sliplining the sewer will restore the pipe to pre-erosion structural
conditions with a possible loss of pipe carrying capacity; however, the
erosion will continue unless the debris is removed or prevented from
entering the sewer. It is unlikely that any material that could be reason-
ably applied to the invert of a sewer would resist erosion for any signifi-
cant period of time without removal of the debris. Figure 4-9 is a tracing
of measured invert erosion in a 72-inch- (1,830-mm)-diameter reinforced
concrete pipe (RCP) trunk sewer.
The erosion profile in Figure 4-9 indicates nearly 1.25 inches (32 cm) of
concrete and reinforcing steel missing from a steep-sided V-notch only
82 GRAVITY SANITARY SEWER DESIGN AND CONSTRUCTION
FIGURE 4-9. Measurement of invert erosion compared to original pipe.

3 to 4 inches (75 to 100 cm) wide. Outside this range there was little invert
erosion. Sewers with diameters smaller than 84 inches (2,134 mm) are
more prone to invert erosion due to the effect of concentrating the impacts
along the centerline of the pipe. In a small-diameter pipe, the rock is con-
tinually forced back along the centerline of the pipe due to the curvature
of the invert. The curvature keeps the impacts concentrated along the
centerline. In larger-diameter pipes the angle of the curvature is less,
allowing the impacts to wander over a larger area, which spreads out the
damage and does not create deep grooves.
4.4. MICROBIOLOGICALLY INDUCED CORROSION PROCESSES
4.4.1. Description
MIC results from a complex series of chemical, physical, and biological
reactions that naturally occur in all municipal wastewater collection sys-
tems to some extent. The root cause of MIC is sulfate in the wastewater
being biologically converted to sulfide, which in turn is chemically con-
verted to hydrogen sulfide gas, which is then biologically converted to
sulfuric acid. The following discussion describes all of these conversions
in more detail and provides methods to calculate the MIC potential of any
collection system.
4.4.2. Generation Processes
4.4.2.1. Dissolved Sulfide Generation
Sulfide generation is a biochemical process occurring in the submerged
portion of sanitary sewers. Fresh domestic sewage entering a wastewater
collection system is usually free of sulfide. Due to conditions that natu-
rally develop within virtually all collection systems, dissolved sulfide
soon begins to appear. These conditions are: development of an active
biological slime layer below the water surface in pipes; low dissolved
oxygen content in the slime layer; long detention times; and warm waste-
water temperatures. The sulfide generation and corrosion process is illus-
trated in Figure 4-10. The first step in the sulfide generation process is the
establishment of a slime layer below the water level in a sewer pipe. This
slime layer is composed of bacteria and inert solids held together by a bio-
logically secreted polysaccharide “glue” called zooglea. When this biofilm
becomes thick enough, dissolved oxygen cannot fully penetrate and an
anoxic zone develops within it. Approximately two weeks are required to
establish a fully productive slime layer in new concrete pipes.
Within the anoxic zone, sulfate-reducing bacteria use the sulfate ion
(SO
4
u
)—a common component of wastewater—as an oxygen source for
CORROSION PROCESSES AND CONTROLS 83

the assimilation of organic matter, in the same way dissolved oxygen is
used by aerobic bacteria. Sulfate is readily abundant in normal domestic
wastewater because it is commonly present in drinking water in more
than sufficient quantities to produce sulfide. Even if there were no sulfate
in drinking water, the sulfate released by the hydrolysis of sulfur-bearing
proteins in sewage is enough to generate enough sulfide to produce
severe corrosion. When these bacteria utilize sulfate, the sulfide ion (S
u
) is
the by-product. The rate at which sulfide is produced by the slime layer
depends on a variety of environmental conditions, including the concen-
tration of organic food source (BOD), wastewater dissolved oxygen con-
centration, temperature, wastewater velocity, and the normally wetted
perimeter of the pipe.
As sulfate is consumed, the sulfide ion by-product is released back into
the wastewater stream where it immediately establishes a dynamic chem-
ical equilibrium between four forms of sulfide: the sulfide ion (S
u
), the
bisulfide ion (HS
U
), aqueous hydrogen sulfide [H
2
S
(aq)
], and hydrogen
84 GRAVITY SANITARY SEWER DESIGN AND CONSTRUCTION
FIGURE 4-10. Sulfide generation in sewers.

sulfide gas [H
2
S
(g)
]. The particular dominant sulfide specie is greatly
dependent upon wastewater pH, as illustrated in Figure 4-11.
• Sulfide Ion (S
u
). The sulfide ion carries a double negative charge,
indicating that it can react by giving up two electrons in the outer
shell. It is a colorless ion in solution and cannot leave wastewater in
this form. It is not present in significant concentrations in the normal
pH range of domestic wastewater and does not contribute to odors
when in this ionic form.
• Bisulfide Ion (HS
U
). The bisulfide (or hydrosulfide) ion carries a sin-
gle negative charge. This is because one of the negative charges of
the sulfide ion is taken up by a positively charged hydrogen ion
(H
U
). The hydrogen ion is obtained from a water molecule (H
2
O),
leaving one hydroxyl ion (OH
U
) behind. It is a colorless, odorless
ion that can only exist in solution. It also does not contribute to
odors in the ionic form.
• Aqueous Hydrogen Sulfide [H
2
S
(aq)
]. Hydrogen sulfide can exist as a
gas dissolved in water. After reacting with one more hydrogen ion
and leaving behind one more hydroxyl ion, the hydrogen sulfide
molecule is complete. The polar nature of the hydrogen sulfide mol-
ecule makes it soluble in water. In the dissolved aqueous form,
hydrogen sulfide does not cause odor. However, this is the only
form of sulfide that can leave the aqueous phase to exist as a free
CORROSION PROCESSES AND CONTROLS 85
pH OF WASTEWATER
PERCENT OF DISSOLVED SULFIDE
7.1
% H
2
S
% HS & S
-
=
120
100
80
60
40
20
0
010
14
FIGURE 4-11. pH effect of wastewater on sulfide specie present.

gas. The rate at which hydrogen sulfide leaves the aqueous phase is
governed by the partial pressure of the gas (Henry’s Law), the
degree of turbulence of the wastewater, and the pH of the solution.
It is important to note that for every mole of sulfate that is biologi-
cally converted to hydrogen sulfide gas, two moles of hydroxide
alkalinity are produced.
• Gaseous Hydrogen Sulfide [H
2
S
(g)
]. Once hydrogen sulfide leaves the
dissolved phase and enters the gas phase, it can cause odor and cor-
rosion. Hydrogen sulfide gas is a colorless but extremely odorous
gas that can be detected by the human sense of smell in concentra-
tions as low as 0.00047 ppm. It is also very hazardous to humans in
86 GRAVITY SANITARY SEWER DESIGN AND CONSTRUCTION
FIGURE 4-12. Hydrogen sulfide gas toxicity spectrum. Source: “Hydrogen
sulfide.” (1977). Report by the Subcommittee on Hydrogen Sulfide of the
Committee on Medical and Biologic Effects of Environmental Pollutants,
National Research Council, Washington, D.C.

high concentrations and can cause a number of health-related prob-
lems, including death. A hydrogen sulfide odor and toxicity spec-
trum is presented in Figure 4-12.
In concentrations as low as 10 ppm, hydrogen sulfide gas can cause
nausea, headache, and conjunctivitis. Above 100 ppm, it can cause serious
breathing problems and loss of the sense of smell, along with burning of
the eyes and respiratory tract. Above 300 ppm, death can occur within a
few minutes. For these reasons, the Occupational Safety and Health
Administration (OSHA) has established an 8-hour, time-weighted, per-
sonal exposure limit of 10 ppm. Because it can remove the sense of smell
in concentrations above 100 ppm, it is a particularly dangerous gas that
tricks its victims into thinking that it is no longer present. It is the cause of
death in numerous wastewater accidents every year.
Due to the continuous production of sulfide in wastewater, hydrogen
sulfide gas rarely, if ever, re-enters the liquid phase. Sulfide continuously
produced by the slime layer replaces that which is lost to the atmosphere
as hydrogen sulfide gas in the collection system. In addition, once the
hydrogen sulfide gas is released, it usually disperses throughout the
sewer environment and never reaches a high enough concentration to be
forced back into solution.
The four sulfide chemical species are related according to the following
equilibrium:
pKa 7 pKa 14
H
2
S
(g)
3 H
2
S
(aq)
3 HS
U
3 Su
Hydrogen Sulfide Hydrogen Sulfide Bisulfide Sulfide
Gas (dissolved) Ion Ion
4.4.2.2. Hydrogen Sulfide Release
As indicated by the equilibrium equations above, once hydrogen sul-
fide is released into the gas phase, the bisulfide ion is immediately trans-
formed into more aqueous hydrogen sulfide to replace that which is lost.
Concurrently, sulfide ion is transformed into bisulfide to replace that lost
to aqueous hydrogen sulfide. Through this type of continuously shifting
equilibrium, it is possible, through stripping, to completely remove all
sulfide from wastewater as hydrogen sulfide gas. This is generally not
recommended or advantageous due to odor releases and the accelerated
corrosion that can take place.
The pKa values above the equilibrium symbols indicate the pH value
at which the respective sulfide species on either side of the symbol are in
equilibrium (e.g., 50% of the total sulfide on each side of the symbol). The
most critical pKa is between the HS
U
and H
2
S
(aq)
species where the con-
version to the releasable form of hydrogen sulfide is pronounced. Note
CORROSION PROCESSES AND CONTROLS 87

that the pH value is 7 for this equilibrium, which is in the range of most
domestic wastewaters. This means that at the pH of most wastewaters,
hydrogen sulfide is very capable of releasing as hydrogen sulfide gas.
4.4.2.3. Biological Sulfuric Acid Generation
Aerobic bacteria, which commonly colonize pipe crowns, walls, and
other surfaces above the waterline in wastewater pipes and structures,
have the ability to consume hydrogen sulfide gas and oxidize it to sulfuric
acid. This process can only take place where there is an adequate supply
of hydrogen sulfide gas (1 ppm), high relative humidity, and atmos-
pheric oxygen. These conditions exist in virtually all wastewater collec-
tion systems. The pH of surfaces exposed to severe hydrogen sulfide
environments (50 ppm in air) has been measured as low as 0.3, which is
approximately equivalent to a 7% sulfuric acid solution (by weight). The
simplified and balanced equation for the biological metabolic process
which converts hydrogen sulfide to sulfuric acid is:
Bacteria
H
2
S
(g)
2 O
2
1 H
2
SO
4
Hydrogen Sulfide Atmospheric Sulfuric
Gas Oxygen Acid
4.4.3. Corrosion Processes
4.4.3.1. Metals Corrosion
Most metals will suffer corrosive reactions when exposed to a low-pH
environment. A low-pH environment is rich in hydrogen ions ( charge)
that are seeking an electron ( charge) to stabilize their internal charge
balance. We know that when metals lose electrons they become oxidized,
which reduces their strength. The low-pH environment therefore
enhances the corrosion of metals. It is important to note that sacrificial
anodes used to protect metals from the galvanic loss of electrons do not
protect metals in sewers from oxidation by acids.
Almost all metals used in sewers are susceptible to low-pH corrosion.
With the exception of some rare and costly alloys (Monel, Hastelloy C,
etc.), only 316 SS can withstand the low-pH environments in sewers. It is
important to point out that not all stainless steels are similarly corrosion-
resistant. Often 304 SS (also known as “carpenter stainless”) is used in
sewers where no particular grade of stainless steel is specified. The 304 SS
cannot resist low-pH environments as well as 316 SS and will exhibit
signs of rusting oxidation very quickly. Similarly, 416 SS does not perform
as well as 316 SS in these environments. Only 316 SS can cost-effectively
perform in a low-pH environment in sewers. This makes 316 SS the pre-
ferred metal to use in the presence of hydrogen sulfide gas in sewers.
88 GRAVITY SANITARY SEWER DESIGN AND CONSTRUCTION

Aluminum is also susceptible to low-pH corrosion for the same rea-
sons. The aluminum metal is oxidized back to aluminum sulfate (alum) in
the presence of low pH caused by sulfuric acid. There are various alloys of
aluminum, some of which offer better low-pH corrosion protection than
others. The 6000 series of aluminum alloys (e.g., 6061) is slightly more
resistant to acid conditions. Anodizing aluminum hardens the surface but
provides only slight extra resistance to acid attack. Aluminum is also sus-
ceptible to corrosion in high pH (10).
4.4.3.2. Concrete Corrosion
The effect of sulfuric acid on surfaces exposed to the sewer environ-
ment can be significant. Entire sewer segments have been known to col-
lapse due to loss of structural stability from corrosion. However, the
process of concrete corrosion is a step-wise process that can sometimes
give misleading impressions. The following discussion briefly describes
the general process of concrete corrosion in the presence of a sewer
atmosphere containing hydrogen sulfide gas.
Freshly placed concrete has a pH of approximately 12 or 13, depending
upon the mix design. This high pH is the result of the formation of cal-
cium hydroxide [Ca(OH)
2
] as a by-product of the hydration of cement.
Calcium hydroxide is a soluble, very caustic crystalline compound that
can occupy as much as 25% of the volume of concrete. A surface pH of 12
or 13 will not allow the growth of any bacteria. The pH of the concrete is
lowered over time through the effects of carbon dioxide (CO
2
) and hydro-
gen sulfide gas (H
2
S). These gases are both known as acid gases because
they form relatively weak acid solutions when dissolved in water. CO
2
produces what is called carbonic acid and H
2
S produces various sulfur
products depending upon conditions. These gases dissolve into the water
on the moist surfaces above the sewage flow and react with the calcium
hydroxide to slowly reduce the pH of the surface. Eventually, the surface
pH is reduced to a level that can support the growth of bacteria.
The time it takes to reduce the pH is a function of the concentration of
carbon dioxide and hydrogen sulfide in the sewer atmosphere. It can
sometimes take years to lower the pH of concrete from 13 to 9; however,
in some severe situations this can be accomplished in a few months.
Once the pH of the concrete is reduced to approximately 9, biological
colonization can occur. More than 60 different species of bacteria are
known to regularly colonize wastewater pipelines and structures above
the water line. Most species of bacteria in the genus Thiobacillus have the
unique ability to convert hydrogen sulfide gas to sulfuric acid in the
presence of oxygen. Because each specie of bacteria can only survive
under a specific set of environmental conditions, the particular species
inhabiting the colonies changes with time. Since the production of sulfu-
ric acid from hydrogen sulfide is an aerobic biological process, it can only
CORROSION PROCESSES AND CONTROLS 89

occur on surfaces exposed to atmospheric oxygen. The relationship
between inorganic pH reduction and biological pH reduction is illus-
trated in Figure 4-13.
As a simplified example, one specie of Thiobacillus only grows well on
surfaces with a pH between 7 and 5.5. However, when the sulfuric acid
waste product decreases the pH of the surface below 5.5, the bacteria die
off and another specie (which can withstand lower pH ranges) thrives.
The succeeding specie grows well on surfaces with a pH between 5.5 and 4.
When the acid produced by this specie drops the pH below 4, a new
specie takes over. The process of successive colonization continues until
species that can survive in extremely low pH conditions take over. One
such specie is Thiobacillus thiooxidans. This organism has been known to
grow well in the laboratory while exposed to a 7% solution of sulfuric
acid. This is equivalent to a pH of approximately 0.5. It is not uncommon
to measure pH values below 1 on surfaces exposed to aggressive corro-
sion in wastewater systems. An airborne concentration of hydrogen sul-
fide gas above 30 ppm is sufficient to generate a surface pH of 1 under
some conditions.
Sulfuric acid attacks the matrix of the concrete, which is primarily
composed of calcium silicate hydrate gel (CSHG), calcium carbonate
90 GRAVITY SANITARY SEWER DESIGN AND CONSTRUCTION
FIGURE 4-13. Concrete corrosion and pH relationship in sewers.

from aggregates, and unreacted calcium hydroxide. Although the reac-
tion products are complex and result in the formation of many different
compounds, the process can be generally illustrated by the following
reactions:
H
2
SO
4
Ca,Si 1 CaSO
4
Si 2 H
H
2
SO
4
CaCO
3
1 CaSO
4
H
2
CO
3
H
2
SO
4
Ca(OH)
2
1 CaSO
4
2 H
2
O
The primary product of concrete decomposition by sulfuric acid is cal-
cium sulfate (CaSO
4
), commonly known by its mineral name, gypsum.
From experience with this material in the form of drywall board, we
know that it does not provide any structural support, especially when
wet. It is usually present as a pasty white mass on concrete surfaces above
the scour line. In areas where diurnal or other high flows intermittently
scour the walls above the water line, concrete loss can be particularly
rapid. It has been demonstrated that in washing off the “protective” coat-
ing of gypsum, fresh surfaces are exposed to acid attack, which acceler-
ates the process.
The color of corroded concrete surfaces can also be various shades of
yellow, caused by the direct oxidation of hydrogen sulfide to elemental
sulfur. This only occurs where a continuous supply of atmospheric oxygen
or other oxidants is available. The upper portions of manholes and junc-
tion boxes exposed to high hydrogen sulfide concentrations are often yel-
low because of the higher oxygen content there. This same phenomenon
can be observed around the outlets of odor scrubbers using hypochlorite
solutions to treat high concentrations of hydrogen sulfide gas.
The rate of concrete loss is dependent upon a number of factors, of
which hydrogen sulfide gas concentration is only one. It is fairly common
to see a rate of concrete loss of 1 inch (2.54 cm) per year in high-sulfide
environments.
The production of sulfuric acid by biological oxidation of hydrogen
sulfide gas can cause significant damage to structures associated with a
wastewater collection and treatment system. Both concrete and steel can
be attacked and destroyed by long-term exposure to even low concentra-
tions of hydrogen sulfide gas. Manholes, concrete pipe, concrete wet
wells, and even force mains and submerged sewers (see Section 4.4.3.2.1.,
Crown Corrosion) have been damaged and have failed from biogenic sul-
furic acid attack. The prevention of this type of corrosion is the major rea-
son for upstream sulfide controls in many wastewater collection systems.
Corrosion of gravity sewer pipe made of cement-bonded materials is
not uniform. Lack of uniformity is due in part to the air currents that con-
trol the rate of dissolved sulfide release and transfer of H
2
S to the pipe
wall. The greatest corrosion is generally observed where turbulent force,
CORROSION PROCESSES AND CONTROLS 91

main discharge conditions exist and for a distance downstream. The dis-
tance downstream that corrosion caused by force main discharges can
extend is a function of the velocity of the air in the sewer headspace and
the rate of biological uptake by acid-forming bacteria. Where steep slopes
flatten and air velocities slow, the rate of transfer will increase. Corrosion
is also greatest at the downstream soffit of the gravity sewer manhole, as
this is where a greater mass of hydrogen sulfide physically impacts the
surface. Test specimens hung in a sewer manhole may provide informa-
tion on the relative corrosion rates of different materials, but they will not
indicate how fast a pipe wall will corrode.
There is normally a flow of air down the sewer but, in addition, trans-
verse currents are set up by temperature differences. The pipe wall is
normally cooler than the water, especially in the summer when sulfide
concentrations are at a maximum. The air that is cooled by the walls
moves downward and slightly warmer air rises from the center of the
stream surface. As a result, the maximum rate of transfer of H
2
S to the
pipe wall is at the crown.
Uneven distribution of corrosion also results from the migration of
acid-containing condensate down the pipe wall, particularly when there
is a high rate of acid production. In the zone that is intermittently washed
by the wastewater during diurnal flow variations, the pasty decomposi-
tion products are cleaned away. As a result, the pipe wall is laid bare to
the attack of the acid when the water level is low. Deeper penetration may
therefore be observed in this zone.
Corrosion of force mains occurs when an air pocket exists in the pipe,
usually at high points in the line where air release valves are inadequate
or nonexistent, or in long downhill stretches. If the air pocket exists for
any length of time, sulfide-oxidizing bacteria will produce sulfuric acid
and corrosion will occur.
A more dramatic effect of force main-related corrosion may be noticed
in manholes and lift station wet wells where force mains discharge. If the
discharge of the force main is turbulent, great quantities of hydrogen sul-
fide are stripped from the wastewater. The resulting high concentrations
of H
2
S feed the acid-producing bacteria and can cause severe corrosion to
surfaces above the normal high water level. The washing effect of the
fluctuating wastewater level provides some measure of protection for
surfaces between the high- and low-water levels, and corrosion does not
usually occur below the low-water level since those surfaces are always
submerged.
Corrosion of gravity sewers is also influenced by the moving mass of
air in a sewer. As air moves down a gravity sewer, its inertia forces it
against the outside of a turn or bend in the pipe. The increased presen-
tation of hydrogen sulfide gas to the outside of a bend causes the pro-
duction of more acid and increased corrosion at that location. The
92 GRAVITY SANITARY SEWER DESIGN AND CONSTRUCTION

down
stream soffit of manholes is also prone to increased corrosion for
the same reason.
4.4.3.2.1. Crown Corrosion
Since the production of sulfuric acid requires oxygen, carbon dioxide,
hydrogen sulfide gas, and water, it would typically be assumed that MIC
would not be present in a full-flowing gravity sewer. Full pipes typically
do not allow gases to be present. However, a recently identified phenom-
enon called crown corrosion has been found in concrete pipes which
intentionally flow full. The process starts when entrained air bubbles in
the flow coalesce on the top of the crown and move to a point in the pipe
where the bubble can remain in place. This is typically at a joint in RCP or
any high spot in the line where hydraulic shear cannot dislodge the air
bubble. All of the conditions required for MIC will exist inside this bubble
of air. As acid is generated in the bubble, concrete corrodes and makes the
air pocket larger. Over time, the pocket can become quite large and even
breach the crown of the pipe. Figure 4-14 is a photograph of some crown
corrosion in a normally full-flowing gravity pipe. Note that the corrosion
starts at a joint and then proceeds upward as the bubble gets larger and
more acid is generated. The corrosion does not extend downstream of the
CORROSION PROCESSES AND CONTROLS 93
FIGURE 4-14. Typical crown corrosion in a full-flowing pipe.

joint where the bubble originally formed since it is continuously wet and
not exposed to gases.
4.4.3.2.2. Corrosion of Cementitious Materials
The corrosion of concrete and other cementitious materials is of pri-
mary concern in wastewater systems. Concrete is an extremely versatile
and inexpensive construction material, particularly for large hydraulic
structures and pipes. Therefore, when this universal building material
cannot perform adequately, it presents a significant challenge for the
designer.
In general, with conventional concrete mix designs using typical Port-
land cements, concrete has the ability to withstand moderately low pH
surfaces for long periods of time. The generally accepted ranges for corro-
sion categories and surface pH values are:
• Severe Corrosion. This category of concrete corrosion is characterized
by significant measurable concrete loss or active corrosion. There is
exposed aggregate and occasional exposed reinforcing steel. The
original concrete surface is not distinguishable. The surface is cov-
ered with soft, pasty corrosion products where active scouring is not
present. There is generally a depressed wall pH (3), indicating
active corrosion.
• Moderate Corrosion. This category of concrete corrosion is character-
ized by some concrete loss with aggregate slightly exposed, but the
original concrete surface is still distinguishable. The surface may
have a thin covering of pasty material which is easily penetrated.
There is generally a depressed wall pH (3, 5), indicating moder-
ately corrosive conditions.
• Light Corrosion. This category of concrete corrosion is characterized by
a slightly depressed pH (5, 6) and a concrete surface that can be
scratched with a sharp instrument under moderate hand pressure
with the removal of some concrete material. The original concrete sur-
face is fully recognizable and aggregate may or may not be exposed.
• No Corrosion. This category of concrete corrosion is characterized by
normal pH ranges (6) and a normal concrete surface which cannot
be penetrated or removed by a sharp instrument under moderate
hand pressure. The surface of the concrete may have biological
growth and moisture but the concrete is normal and the aggregate is
not exposed.
4.4.3.2.3. Hydrogen Sulfide Gas Concentrations
The principal driving force for MIC in wastewater systems is biogenic
sulfuric acid production. The precursor for sulfuric acid is hydrogen sul-
fide gas. Without hydrogen sulfide gas, there would be no sulfuric acid.
94 GRAVITY SANITARY SEWER DESIGN AND CONSTRUCTION

The question remains: How low do the hydrogen sulfide gas concentra-
tions need to be before corrosion stops? Another way of asking this same
question is: What is the highest concentration of hydrogen sulfide gas that
can be tolerated in a collection system before giving rise to concern about
corrosion?
There are two definitive works on the subject. One was a paper pro-
duced by the Los Angeles County Sanitation Districts that demonstrated
that a H
2
S gas concentration of 2 ppm or less did not allow the growth of
Thiobacillus and therefore prevented serious pipe damage. Once Thiobacil-
lus bacteria colonize, significant pipe damage can occur.
Another study from South Africa related that Thiobacillus bacteria
could exist in concentrations between 2 to 5 ppmv. This tends to make one
believe that Thiobacillus bacteria become substrate-limited at H
2
S gas con-
centrations below 2 ppmv. Thus, 2 ppmv would be a good number to use
for continuous concrete pipe exposure in a sewer environment without
producing sulfuric acid.
The problem with using this approach is that the hydrogen sulfide gas
concentration in a sewer is never constant. It is always changing—rising
or falling. In fact, recent studies on the effect of the Clean Water Act on
sulfide production in domestic wastewater show that sulfide concentra-
tions are rising dramatically as a result of regulations.
4.5. CORROSION PREDICTION MODELS
The power of computers has allowed a much faster evaluation of the
rather complicated equations required to predict corrosion. The following
discusses the development of corrosion models and their limitations.
4.5.1. Corrosion Model Development
The equations most commonly used to estimate the rate of corrosion
due to hydrogen sulfide-induced corrosion come from research con-
ducted by the U.S. Environmental Protection Agency (EPA 1992). These
empirical equations were originally presented in a joint publication by the
EPA, ASCE, and the American Concrete Pipe Association (EPA 1992).
The corrosion prediction model can be used to identify, locate, and
define areas susceptible to corrosion and estimate (not predict) rates of cor-
rosion. Reasonable assumptions must be made in order for the model to
provide reasonable results. The more data that is based on actual inspec-
tion and testing, the more reliable the model results will be. Any reliable
dissolved sulfide prediction model can be used to provide average dis-
solved sulfide concentrations for different wastewaters, at different times
of the year, and under different conditions. Model predictions should be
confirmed with as much field data as possible.
CORROSION PROCESSES AND CONTROLS 95

The average rate of sulfide-related corrosion is calculated through the
use of two primary equations. The first equation calculates the sulfide flux
(the rate transfer of hydrogen sulfide from the wastewater to the sewer
pipe). A common form of the flux equation used in the model is:
Flux 0.45 [(s v)
3/8
] ( j) DS (b/p)
where
Flux rate of hydrogen sulfide transfer to walls; g/m
2
-hr
0.45 conversion from meters to feet
s energy grade line
v velocity of stream; ft/sec
j factor relating the fraction of dissolved sulfide present as H
2
S
(g)
to pH
DS dissolved sulfide concentration; mg/L
b stream width; ft
pperimeter of pipe exposed to atmosphere; ft.
Following input of the system physical parameters, the model calcu-
lates b and p, as well as velocity and the j factor. The sulfide concentration
and wastewater pH are required. The average rate of corrosion of the
exposed pipe perimeter is calculated based the sulfide flux. The form of
the equation is:
C
avg
0.45 (k) flux
A
where
C
avg
average rate of corrosion, inches/year
0.45 conversion factor from meters to feet
k incomplete acid reaction factor, ranging from 0.3 to 1
A concrete alkalinity, expressed as calcium carbonate, equivalent
decimal fraction.
The k factor estimates the efficiency of the acid reaction considering the
estimated fraction remaining on the wall. The k factor approaches unity
for nearly complete reaction. Pipes with frequent flushing or with high
humidity and high rates of sulfide production would have lower k values
because acid would tend to rinse or drip off the wall before reacting. The
A value for granitic aggregate concretes ranges from 0.17 to 0.24; for cal-
careous aggregate concretes, A ranges from 0.9 to 1.1. The equivalent A
value for mortar-lined pipes is 0.4, for asbestos cement, 0.5, and for fer-
rous pipe a value of 0.5 should be used to account for the attack of the sul-
furic acid as well as the direct attack of the hydrogen sulfide gas.
96 GRAVITY SANITARY SEWER DESIGN AND CONSTRUCTION

The average rate of corrosion represents the total loss of pipe over the
total surface area considered. As discussed above, the crown of the pipe
tends to have a greater rate of corrosion than the intermediate perimeter.
Corrosion is also higher in areas of greater turbulence because of
increased sulfide release. In order to calculate the maximum rate of corro-
sion, these two factors must be taken into account. The following equation
is used to calculate the maximum rate of corrosion:
C
max
C
avg
CCF TCF
where
CCF crown corrosion factor, typically 1.5 to 2
TCF turbulence corrosion factor, typically 1 to 2.5 for well-designed
dropstructures and 5 to 10 for drops or other turbulent junctions.
Example Analysis
Based upon some field sampling data and some estimated values, a
prediction of corrosion rates was performed for the sewers downstream
of various force main discharges for a large East coast municipality. Table
4-2 contains corrosion model predictions for a typical collection system.
The universal estimated data for all model runs was:
Acid Reaction Factor (k) 0.85 (indicates moderate reaction)
Concrete Alkalinity (A) 0.80 (normal for concrete pipe with lime-
stone aggregate)
Crown Corrosion Factor (CCF) 1.5 (moderate)
Turbulence Correction Factor (TCF) 5.0 (high for gravity sewers)
Slope 0.10 (ft/ft)
CORROSION PROCESSES AND CONTROLS 97
TABLE 4-2. Example Results of Corrosion Modeling
on Gravity Sewers Downstream of Force Mains
Wastewater Average Maximum Sewer
Sulfide Rate Rate Diameter
Location pH (mg/L) (in./yr) (in./yr) (in.)
Horse Pen Pump Station 7.4 2.3 0.0219 0.1642 36
Muirkirk Pump Station 7.4 1.1 0.0086 0.0597 18
Atwood Grinder System 7.9 3.8 0.0038 0.0286 8
Arcola Pump Station 7.5 1.4 0.0048 0.0359 12
Olney Pump Station 7.3 5.6 0.0530 0.3973 36
Squaw Hill Grinder System 7.9 6.8 0.0114 0.0853 8
Seneca Pump Station 7.4 2.0 0.0294 0.2204 48
Willow Ridge Grinder System 7.4 8.5 0.0495 0.3716 12

The information most likely contains some degree of inaccuracy due
to estimations; however, it represents a comparison of the relative corro-
sion rates with most factors held constant. It also indicates the possible
magnitude and relative severity of the corrosion problems in common
concrete pipe.
4.6. SULFIDE CORROSION CONTROL
4.6.1. Chemical Controls
There are many different chemical control options that could be used
effectively to reduce or eliminate odors in collection systems. The major-
ity of these chemicals are used specifically for the treatment of sulfide-
related odors and corrosion. Although chemicals have been used very
effectively to control collection system odors in many applications, a thor-
ough evaluation of all odor control options must be performed before
selecting a chemical treatment for corrosion control. Each case is unique,
with site-specific parameters which may or may not make chemical treat-
ment feasible or economical. When an evaluation indicates that chemical
control options are viable, the results can be economical and provide
effective odor and corrosion control.
In situations where sulfide is causing both odor and corrosion in the
collection system, cost/benefit analyses which include the reduction of
corrosion often indicate that it is more cost-effective to add chemicals to
the collection system than scrub odorous air at the treatment plant. It
should be recognized that corrosion and hydrogen sulfide gas concentra-
tions in wastewater collection systems vary both diurnally and seasonally.
To achieve efficient and economical odor control using chemicals, regular
monitoring of sulfide concentrations and adjustment of chemical dosage
rates are required. This requires an investment in training for operations
personnel and the necessary sampling and analytical equipment.
Chemical additives come in many forms and react to control odors in
several different ways. The following sections briefly discuss the various
chemical treatments for odor and corrosion control in greater detail, but
do not include their chemistry, process description, or operational and
maintenance considerations. The interested reader is directed to Chapter
10 of the Water Environment Federation’s Manual of Practice 25—Control
of Odors and Emissions from Wastewater Treatment Plants, which contains
much more information on the specifics of chemicals used for sulfide con-
trol in sewers.
Chemical additives work in different ways to stop or reduce sulfide
production by bacteria in the slime layer; they do not react with hydrogen
98 GRAVITY SANITARY SEWER DESIGN AND CONSTRUCTION

sulfide gas directly. This is a valid mechanism, since without sulfide pro-
duction there will be no hydrogen sulfide gas. Some chemical additives
increase the oxygen concentration of the wastewater. We know that oxygen
is used preferentially by the slime layer bacteria instead of sulfate when
present, hence there is less sulfide production in aerobic wastewater. The
oxygen can come in the form of atmospheric air sparged into the waste-
water, pure oxygen injection, or chemically bound oxygen found in prod-
ucts such as nitrate solutions.
Some chemical additives combine with the sulfide before it can be
released as hydrogen sulfide gas. Iron compounds are most commonly
used for this purpose, although zinc, nickel, copper, and many other
metal ions will also perform as well as or better than iron. The main dif-
ference is the toxicity of zinc and other metals and the fact that the Clean
Water Act prohibits them. Iron compounds combine with the dissolved
sulfide and form a relatively insoluble precipitate of iron sulfide, which
can no longer be released as hydrogen sulfide gas. This is a stoichiomet-
ric reaction, so if the sulfide concentration is high it will require more
iron solution.
Still other chemical additives are strong oxidants which react with
sulfide and other reduced compounds in wastewater. In these reactions,
the sulfide is typically oxidized to other sulfur-containing compounds
which are not volatile (sulfate, sulfite). Examples of these types of chemi-
cals are hydrogen peroxide, potassium permanganate, and various forms
of chlorine. Most of the oxidant chemicals are also hazardous to handle
and store.
Due to the large number of chemicals that could be used and their
many specific reactions, chemicals used for hydrogen sulfide control in
sewers must be selected with assistance from a professional. The subject
cannot be treated in a detailed manner in this chapter.
4.6.2. Coatings
The class of products that are applied to concrete surfaces as liquids or
semi-solids and then allowed to chemically cure to a final product are
called coatings; they generally fall into the categories of epoxies and ure-
thanes. Many different formulations and combinations are available.
Evaluation of the many different formulations is not possible within the
context of this discussion—they must be evaluated on a case-by-case
basis. The construction of these materials often leaves microscopic pin-
holes in the coating, even when applied under strict supervision and
inspection. It is extremely difficult to spray or apply coatings under the
unfavorable conditions of sewage, temperature, and humidity found in
sewers. The pinholes and other defects formed in the coating provide a
CORROSION PROCESSES AND CONTROLS 99

route for the acid to penetrate to the concrete and cause failure of the coat-
ing’s anchor or attachment mechanism. In some instances, the organic
components of various coatings have been found to be biodegradable and
digested by the aggressive biological environment in a sewer.
Some general guidelines for coatings use for corrosion protection in
wastewater collection systems are:
• Surface preparation is critical to achieving a successful coating. A
certified corrosion engineer should assist with all phases of coating
application, particularly surface preparation.
• An appropriate primer (typically 100% solids epoxy) should always
be used. This is particularly critical when coating concrete.
• The topcoat should be applied in two separate coats of equal thick-
ness with appropriate set/cure time between coats. The topcoat
should be compatible with the primer system and suitable for the
service required.
• The finished coating system should be spark-tested to detect pin-
holes. All pinholes or defects should be corrected.
In general, coatings with fillers or extenders which serve no corrosion
protection function should not be used. An example of an organic extender/
filler is coal tar. Coatings also contain varying amounts of silica dust and
other inorganic materials as fillers. Coatings should be used sparingly in
sewers where visual inspection is difficult and periodic, since failures can
occur quickly and cause significant damage. Coatings generally work bet-
ter in manholes and wet wells where visual inspection is more frequent.
The primary concern with coatings is to catch the failure before damage
can occur. It is not a question of will a coating fail as much as when a coat-
ing will fail.
4.6.3. Liners
The other general class of concrete protection methods consists of a
thick, pinhole-free, manufactured sheet of polyethylene (PE/HDPE),
polyvinyl chloride (PVC), or other impervious plastic material that is
securely fastened to the concrete surface. The primary difference between
coatings and liners is the virtual absence of pinholes in a sheet of plastic
manufactured under ideal factory conditions. Another advantage that lin-
ers have over coatings is resistance to hydrostatic head and vapor pres-
sures generated by groundwater at great depths. Coatings must anchor to
the concrete substrate, which means that hydrostatic and vapor pressures
exerted through the porous concrete wall must be 100% physically resis-
ted by the coating material. Coatings have not demonstrated the ability to
100 GRAVITY SANITARY SEWER DESIGN AND CONSTRUCTION

withstand these types of forces. Practically 100% of inspected coatings
under similar conditions have blisters and failures within two years of
application. Most liner systems do not work by resisting hydrostatic and
vapor pressure effects, but instead allow water and air a relief pathway
from the concrete to the sewer environment—this does not defeat the cor-
rosion protection mechanism. The methods of pressure relief provided by
different liner systems are often unique and inventive; however, this is an
extremely important aspect of liner design.
In 1953 the City of Los Angeles installed a large-diameter concrete pipe
with plastic sheet liners attached to it to prevent hydrogen sulfide-related
corrosion (Ameron T-Lock™). That 50 year-old sewer is showing every
indication that it will perform for another 50 years with zero corrosion.
Since no commercially available coating has remained in continuous serv-
ice without maintenance for this period of time, it is clear that liners pro-
vide a long-term advantage that cannot be offered by coatings. For this
reason, coatings are not discussed further in this chapter as a viable
method for large-diameter sewer corrosion protection.
4.6.3.1. Liner Systems
There are many different types of liners that are intended for many dif-
ferent types of sewer applications. Some liner systems have been devel-
oped for small-diameter sewer rehabilitation, such as the fold-and-form
type of expandable liners. These liners are mostly PE or polypropylene
(PP) and are folded and pulled into the sewer to be rehabilitated. Once in
place, the pipe is expanded with air or water pressure to fit tightly against
the host pipe. Some grouting of the annular space may be required to pre-
vent dislocation. Other types of liner systems utilize a cured-in-place tech-
nology where a circular felt bag full of chemical resins is inserted in the
pipe, expanded against the host pipe, and subsequently cured with hot
water or air. These liners are only suitable for smaller-diameter sewer
rehabilitation since they require significant installation and curing time
which necessitates full-flow bypass pumping, and therefore are not
appropriate for this subject matter.
Some types of liners, called slip liners, are intended for large-diameter
sewer rehabilitation only and do not require full-flow bypass pumping.
These liners are thin shells of corrosion-resistant piping [PVC, PE, glass-
reinforced plastic (GRP), fiberglass-reinforced plastic (FRP)] which have
an outside diameter roughly equal to the inside diameter of the pipe
being rehabilitated. By pushing these pipe shells one after the other into a
corroded pipe, the sewer is effectively lined against corrosion. Grouting of
the annular space secures the sections in place. Slip liners can be designed
to provide both corrosion protection and structural enhancement of the
deteriorated pipe if necessary.
CORROSION PROCESSES AND CONTROLS 101

The following discussion will focus primarily on those liner systems
that are appropriate for new concrete sewer construction and concrete
sewer rehabilitation. More specifically, the liner systems discussed are
those liners that are not intended to provide structural enhancement of
the host pipe. Therefore, these liner systems are appropriate only for situ-
ations where the host concrete pipe is new or still fully capable of sup-
porting the intended static and dynamic design loads and does not
require structural enhancement. Although many of the liner systems dis-
cussed in this chapter are capable of providing some additional measure
of structural enhancement, designing these systems for this purpose is not
the focus of the technology. Identifying liner systems that provide corro-
sion resistance, security of attachment, and long-term protection of a con-
crete sewer infrastructure are the primary discussion topics.
4.6.3.2. Rehabilitation Versus New Construction
When considering sewer corrosion protection, it is always more eco-
nomical to provide protection during the original design and installation
of the sewer as opposed to rehabilitation. The average cost increase for
liner protection systems when installed as part of the original construc-
tion ranges from 4% to 10% of the cost of the pipe on an installed basis.
Typical rehabilitation costs for large-diameter, deep sewers can range
from $2,200 to $3,800 per linear meter (depending upon diameter and
method used)—nearly equal to the original cost of installation. How-
ever, there is ample need for sewer rehabilitative services and liners are
still the preferred choice, and there are several liner systems more adapted
to rehabilitation than new construction. Rehabilitating a large-diameter,
deep sewer presents construction challenges that are often difficult and
costly to overcome. Access shafts must often be dug to allow insertion of
construction equipment and materials. Wastewater flow must be accom-
modated by working wet or bypass pumping. The working environment
is a confined space and must be accommodated by the appropriate safety
and breathing equipment. Because of the increased difficulty of con-
struction and inspection, the quality of work performed in an active
sewer environment is often not equal to that obtainable on the surface.
4.6.3.3. Selecting and Designing Liner Systems
Liners are well-suited for both initial protection of new concrete pipe
and structures as well as for rehabilitation and protection of existing cor-
roded sewers. Attachment details for liners vary from application to
application based upon the specific needs of the particular situation. Dif-
ferent design criteria are used to select liners for concrete rehabilitation
purposes, as opposed to new concrete installations. Although many of
the criteria, such as acid resistance and security of attachment, are practi-
102 GRAVITY SANITARY SEWER DESIGN AND CONSTRUCTION

cally identical, some of the most important criteria for these separate pur-
poses are:
Rehabilitation Protection
Flow capacity reduction of method Years in similar service
Constructability Joint treatment details
(overlaps)
Method of attachment Hydrostatic head handling
Grout design Ease of construction
(joint welds)
Installation with no flow interruption Resistance to scour/abrasion
Confined space work Degree of coverage (270 degrees
versus 360 degrees)
Unique conditions exist in large-diameter, deep tunnels that do not
exist in smaller sewer lines. When selecting a liner system for deep tun-
nels, special considerations must be made because of the unique condi-
tions. Among these considerations are:
• High hydrostatic pressure from groundwater due to the depth of the
tunnel.
• Surcharged conditions (intentional or unintentional) often exist in
deep sewer systems. If an annular space exists between the concrete
pipe and the liner, and this space is significant enough to contain
water, then the rapid dewatering of the tunnel may impose forces on
the liner from the stored water in the annulus.
• The inability to easily bypass flow in a deep tunnel requires work to
be done under live flow conditions in a confined space. Pumping
wastewater up and around a bypass for construction in a deep tun-
nel sewer can be prohibitively expensive, or expensive enough to
give a competitive price advantage to a rehabilitation method that
does not require bypass pumping.
• The diameter of access structures (manholes) in deep tunnels is gen-
erally much smaller than the diameter of the tunnel. This restricts
the size of the equipment that can be inserted into the tunnel for con-
struction purposes.
• The location of the deep tunnel property limits (easement) may
affect the rehabilitation liner system selection, depending on how
certain methods may require additional land area for material lay-
down and construction equipment storage.
• The distance between existing access locations (manholes) affects
the liner system selection. Depending upon the rehabilitation liner
system, some have more difficult construction staging requirements
and maximum distances that can be accommodated.
CORROSION PROCESSES AND CONTROLS 103

• Large-diameter, deep sewers under the influence of extensive sur-
face collection systems can experience rapid and dramatic flow vari-
ations due to wet weather impacts (see the bullet item Surcharged
Conditions, above). These flow variations can impart very high,
transient hydraulic forces upon a liner and can also cause pressure
waves that induce alternating pressure/vacuum cycles against a
liner and its attachment mechanism.
4.6.3.4. Types of Liner Products Available
There are several different types of liner products that can be basically
classified by material of construction and method of attachment. The
basic types of liners, as well as more detailed information that can be used
to evaluate each liner system and descriptions of the application pro-
cesses, are discussed in the following sections.
4.6.3.4.1. Cast-in-Place Liners
These types of liners have knobs, tees, ribs, or other types of protrusion
from one side of the liner sheet, which are embedded into concrete or
grout during construction. When the forms are removed, the smooth liner
surface is revealed to provide an acid barrier. Proprietary examples are
T-Lock™ (PVC), Bekaplast™ (PE), Studliner™ (PE), and Agru Sure-
Grip™ (PE). These types of liners can be used for either new construction
or rehabilitation, although they are most often used in new construction.
Some of these liners are gaining acceptance as viable rehabilitation meth-
ods due to advances in grouting technology and in-pipe construction
techniques [e.g., T-Hab™ (PVC), Danby (PVC), Bekaplast (PE)].
Whether cast-in-place liners are used for new or rehabilitation service,
they relieve hydrostatic and vapor pressure by providing a pathway for
escape into the sewer without sacrificing corrosion protection. Since the
anchors are the only part of the liner embedded in the pipe wall, the flat
surface of the liner is held close against the concrete but not tightly
adhered to it. This allows weep water and vapor pressure to equalize into
the sewer flow without creating an open airspace where gases can accu-
mulate. Figure 4-15 shows a typical T-Lock™ cast-in-place liner detail on
a vertical wall. The tee-shaped extensions are usually oriented vertically
in structures and horizontally in sewers. Figure 4-16 shows how the coni-
cal anchors of Bekaplast(tm) liner secure the liner to the concrete.
Recommendations for Cast-in-Place Liners. Cast-in-place liners work best
in sewers when installed on precast concrete pipe sections at the factory.
Superior performance with cast-in-place liners has been experienced
when the pipe sections are wet-cast and steam-cured, as opposed to dry-
cast pipe construction. It is not recommended to install cast-in-place liners
104 GRAVITY SANITARY SEWER DESIGN AND CONSTRUCTION

CORROSION PROCESSES AND CONTROLS 105
FIGURE 4-15. Typical cast-in-place liner profile on wall (plan view).
FIGURE 4-16. Bekaplast™ attachment using conical anchors. Courtesy of
Georg Steuler Industriewerke GmbH, Hors Grenzhausen, Germany.

using the dry-cast method of pipe manufacture due to potential problems
with proper embedment of the attachment anchors. Careful attention to
the degree of coverage for the liner is recommended. It has often been
found that 270 degrees of coverage is generally not sufficient to protect
the concrete below the liner during some flow events. From 300 to 320
degrees of coverage is recommended as a minimum to protect pipes.
Three hundred sixty-degree coverage is not recommended because it
makes walking or standing in the pipe dangerous. Regardless of the cir-
cumference of coverage, openings must be provided for relief of the weep
water and vapor pressure so the liner is not bulged or pressurized.
When used in a rehabilitation mode, cast-in-place liners must be
grouted in place over the prepared surface of the host pipe. This requires
an internal form that can pass wastewater during the placement and
grouting procedure. Design of the grout mix and the placement tech-
nique are critical to the success of any rehabilitation application using
cast-in-place liners. The grout must be specially designed for nonshrink
characteristics, flow characteristics, and strength. No expense should be
spared in providing the best grout mix. In order to prevent the buildup of
hydrostatic pressure at the concrete–grout interface and to transmit weep
water directly to the grout–liner interface, the grout must have a perme-
ability (to water) equal to or less than the permeability rate of the host
concrete pipe. This requires a special mix design for the grout.
In addition to care in installation, care is also required in welding the
liner sheets to each other. It is very important that the welding be per-
formed by expert, trained welders and that the final project be inspected
by experienced inspectors familiar with the product. Unless the welding is
done properly, there will be “cold joints,” gas will get behind the liner, and
concentrated corrosion will occur. Improper welding and poor inspection
techniques have led to failure of sheet liners in some installations.
4.6.3.4.2. Chemically Attached Liners
These liners come in two basic forms. One type has protrusions on one
side of a PVC liner which are pressed into freshly applied epoxy mastic
on the concrete. The mastic flows around the protrusions to provide the
attachment mechanism when cured (Arrow-Lock
®
). Another form of
chemically attached liner is a PVC sheet, flat on both sides, which is
pressed into a freshly applied polyurethane mastic (Linabond
®
). A
chemical additive in the PVC sheet allows chemical fusion and cross-
polymerization to occur between the urethane and the PVC, resulting in a
very secure bond between the two. These liners can be applied over new
concrete; however, they are more commonly used in rehabilitation. There
are other more secure and economical methods for new construction than
chemically attached liners. One of the potential drawbacks to chemically
attached liners is the requirement to physically resist all hydrostatic and
106 GRAVITY SANITARY SEWER DESIGN AND CONSTRUCTION

vapor pressure exerted against the liner–host pipe interface. Since the
liner is glued to the pipe wall with an epoxy or urethane mastic, the
attachment of the epoxy or urethane to the pipe wall is critical to liner per-
formance. The ability to resist anticipated hydrostatic and vapor pres-
sures should be adequately demonstrated. Figure 4-17 shows a typical
chemically attached liner profile on a vertical concrete wall.
Recommendations for Chemically Attached Liners. The weakest link in the
chemically attached liner process is the reliance on a physical–chemical
bond between the epoxy or urethane mastic and the host pipe. This bond is
not unlike the bond required for coatings, which have often demonstrated
an inability to withstand hydrostatic and vapor pressure forces exerted in
a deep sewer environment. The bond is enhanced by using a thick layer of
mastic with a high modulus of elasticity so that bridging and hoop stresses
are generated to help withstand the hydrostatic forces. Some chemically
attached liners use a polymer concrete that has an extremely high modulus
of elasticity and should be able to withstand anticipated hydrostatic and
vapor forces if properly designed and applied.
Due to the reliance on a mechanical–chemical bond, the preparation of
the host pipe surface is very important to a successful application. In addi-
tion, the selection of the primer to be used under the mastic or polymer
CORROSION PROCESSES AND CONTROLS 107
FIGURE 4-17. Typical chemically attached liner profile.

concrete can be critical to the success of the liner/mastic system. It is very
difficult for coating systems to resist hydrostatic and vapor forces when
applied directly at the concrete–mastic bond. In order to prevent the
buildup of forces against the mastic material at this point, a low-viscosity,
100% solids epoxy primer with good wetting characteristics (hydrophilic)
is applied just prior to mastic application. The primer drives the interface
between hydrostatic forces and the mastic deeper into the matrix of the
concrete where the primer has cured. This lessens the dependence upon
the mechanical bond with the host concrete surface and makes the interior
of the concrete host pipe carry some of the hydrostatic load.
4.6.3.4.3. Mechanically Attached Liners
These liners can be almost any material, although rigid (unplasticized)
PVC and HDPE are most common. The most significant variation is the
method of attachment, which can vary from small expansion-type
anchors to stainless steel batten strips with epoxy grout anchors. The high
degree of flexibility offered by mechanically attached liners makes them
adaptable to a wide variety of conditions. Attachment systems can be
designed that will safely accommodate the anticipated hydraulic and
hydrostatic forces. Liner thicknesses can also be easily varied for addi-
tional hoop strength to adjust to specific design needs. These liners have
been used primarily for new construction, although numerous rehabilita-
tions have been reported with equal success.
Mechanically attached liners, like the cast-in-place liners, do not resist
hydrostatic and vapor forces but pass them harmlessly to the sewer envi-
ronment. Like the cast-in-place liners, the flat inner surface of the liner is
held closely against the interior of the concrete pipe but is not fastened to
it. This allows water to flow harmlessly into the sewage and not create a
localized high-pressure area that could bulge and fail. Figures 4-18 and
4-19 illustrate how mechanically attached liners are secured in a pipe and
on a wall.
Scale buildup has been reported behind mechanically attached liners.
When groundwater leaches through concrete it picks up minerals, includ-
ing calcium hydroxide [Ca(OH)
2
], a by-product of the hydration of
cement. The groundwater arriving at the interior of concrete pipe can
have a pH as high as 13 or 14, primarily as a result of the dissolved cal-
cium hydroxide. If even a small air space exists between the liner and the
concrete wall, this air space will contain carbon dioxide gas (CO
2
). Carbon
dioxide dissolves into water, producing carbonic acid (H
2
CO
3
), which
then reacts with the calcium hydroxide to form calcium carbonate
(CaCO
3
) and water according to this simple acid–base reaction:
CO
2
H
2
O 3 H
2
CO
3
(carbonic acid)
H
2
CO
3
Ca(OH)
2
1 CaCO
3
2 H
2
O
108 GRAVITY SANITARY SEWER DESIGN AND CONSTRUCTION

CORROSION PROCESSES AND CONTROLS 109
FIGURE 4-18. Typical mechanically attached liner in pipe.
FIGURE 4-19. Typical mechanically attached liner to surface.

The production of calcium carbonate by this reaction is exactly the same
process that forms stalactites and stalagmites in caves. Calcium carbonate
is deposited on the surfaces between the concrete wall and the liner, form-
ing thin, fragile flakes that often bridge between the liner and the pipe
wall. When fluctuating water levels in the pipe cause flexure of the liner,
flakes of calcium carbonate fall off and, being heavier than water, accu-
mulate in the lower portion of the annular space between the liner and
pipe wall. Significant accumulation of this material can restrict or prevent
the movement of water into and out of the annular space, leading to
hydrostatic pressure relief problems.
Recommendations for Mechanically Attached Liners. Particular care must
be exercised during liner design to provide adequate structural support
for the liner (thickness, hoop strength, and attachment security) to with-
stand the anticipated loads with a safety factor of 2. Serious failures have
resulted when these design issues and other anticipated forces and loads
upon the liner were not addressed. Designs must consider all hydraulic
scenarios, particularly surcharging, in deep sewers and tunnels, and must
account for the successful handling of both hydrostatic pressures and
hydraulic shear forces, pressure waves, and shear forces. Spacing, type,
size, and material of construction of the attachment anchors are critical
factors for successful mechanically attached liner installation. Mechani-
cally attached liners should not have spacers intentionally placed
between the liner and the pipe wall. Spacers increase the volume of water
behind the liner during a surcharge event and can add to forces trying to
push the liner off the wall when water levels fall.
4.6.4. Inert Materials
The selection of the proper pipe material for a new large-diameter
sewer or tunnel must consider corrosion impacts. When corrosion resist-
ance alone is considered, pipe material selection favors plastic materials
such as PE/HDPE, PVC, or various resin-based, composite materials such
as GRP or FRP. However, when the cost of producing such large-diameter
plastic pipes [72-inch (1,830-mm) diameter] is considered, it is quickly
found that the cheapest material by far is RCP. The relatively low cost and
high strength of concrete makes it economically attractive for large-diam-
eter, deep sewers, but the corrosion resistance of concrete is minimal.
Concrete is readily attacked and destroyed by strong mineral acids like
H
2
SO
4
, hence the need for liners.
Inert pipe materials are still economical for pipe diameters less than
about 72 inches (1,830 mm), which comprises the vast majority of the total
service area of the typical collection system. The vast number of plastic
pipe types, formulations, and configurations makes a complete discus-
110 GRAVITY SANITARY SEWER DESIGN AND CONSTRUCTION

sion in this chapter impossible. However, care should be exercised to
determine the specific formulation of plastic pipes, since all plastics are
not equal. For instance, PVC pipe is manufactured using a number of dif-
ferent filler materials. This is due to the cost of the resins used and the
strength of the particular resin. Fillers are added to provide bulk and
mass to the pipe and reduce excessive resin consumption. Some filler
materials can be attacked by acidic conditions that leach the fillers from
the pipe and reduce the structural capacity.
REFERENCES
U.S. Environmental Protection Agency (EPA). (1992). “Detection, control, and cor-
rection of hydrogen sulfide corrosion in existing wastewater systems.” EPA
832 R-92-0001, EPA, Washington, D.C.
CORROSION PROCESSES AND CONTROLS 111
This page intentionally left blank

5.1. INTRODUCTION
The functional purpose of a sanitary sewer is to safely convey waste-
water to its destination. Sanitary sewer analysis and design is sometimes
viewed as a simple task. In fact, many and varied local land use, topo-
graphical, subterranean, structural, and hydraulics problems combine to
make projects very challenging. Computer-based sewer analysis and
design systems are powerful tools now commonly used to assist engi-
neers in sewer analysis and design. However, users should be well-
informed of and alert to the appropriateness and adequacy of hydraulic
principles incorporated into design systems. Although design codes and
guidelines are valuable and often provide a safety net against problems
resulting from poor engineering and bad judgment, engineers need to be
alert to situations where codes and guidelines are inadequate—by being
either too restrictive or not restrictive enough.
Prime functional goals for sewers are to (1) carry maximum flows with-
out significant surcharge, and (2) achieve adequate self-cleansing during
low-flow periods. At a point in a sanitary sewer, flow rates may vary
greatly within a given day and much more over the service life of the
sewer (see Chapter 3). Gravity-flow sanitary sewers are usually designed
to flow full or nearly full at design peak flow rates. In some cases at
extreme peak flows, it is permissible for sanitary sewers to operate as a
low-pressure conduit where the hydraulic grade line (water surface)
intermittently rises up into manholes to some acceptable height above the
crown of the sewer. This type of operation is usually limited to deep sani-
tary sewers with no service connections at low elevations where backflow
into buildings might occur.
CHAPTER 5
HYDRAULICS OF SEWERS
113

Pressure sanitary sewers and force mains are pressure pipelines that
carry wastewater in situations where open-channel gravity flow is not
possible. Deep tunnels, inverted siphons, and submerged outfalls are
other examples of pressure sewers. In such pressure conduits, large flow
rate variation often makes solids deposition a significant consideration in
design and operation.
Wastewaters contain a wide variety of soluble and solid particles to be
conveyed to treatment facilities. Solids buildup can retard and even block
the flow, and may foster generation of hydrogen sulfide and methane. In
designing sewer systems, possible solids deposition during low-flow peri-
ods should always be considered. Wherever possible, designers should
use accurate low-flow projections and sound hydraulic principles to
design sewers for adequate self-cleansing to minimize solids deposition
and avoid longer-term solids buildup. Since self-cleansing is not possible
in all cases, sewer cleaning can be considered an acceptable backup posi-
tion to be used as seldom as possible. The tractive force approach to self-
cleansing has been adopted widely internationally and is now advocated
by ASCE and the Water Environment Federation (WEF) in the United
States. This approach is presented later in this chapter. It is a more refined
and accurate approach to self-cleansing design than full-pipe-velocity and
related approaches, but its application requires a significant paradigm
shift and accompanying incorporation into codes and guidelines.
Sewer hydraulics is a rather complicated subject because of many pos-
sible conduit entrance and exit conditions, the range of sewage flows that
change over time and by location, water surface profiles, the issue of self-
cleansing, and more. Fortunately, steady, uniform flow principles are suf-
ficient for analysis and/or design of most sanitary sewers. All hydraulic
principles necessary to deal with all design situations and problems can-
not be covered in depth in this chapter. The approach here is to present
important hydraulic principles of particular value in sanitary sewer
design, providing the engineer with concepts and tools that foster an
appropriate analysis and design for the case at hand. For more discussion,
see Yen (2001).
5.2. TERMINOLOGY AND SYMBOLS
A cross-section area, L
2
A
c
cross-section area at critical depth
A
f
total area of closed conduit, L
2
A
n
cross-section area at normal depth, L
2
C
HW
Hazen-Williams equation coefficient
D conduit diameter, L
D
0
normal depth, L
114 GRAVITY SANITARY SEWER DESIGN AND CONSTRUCTION

d particle diameter, mm
d
m
hydraulic depth A/T, L
E specific energy, L
E
m
minimum specific energy, L
F
n
Froude number, dimensionless
F force
f friction factor in Darcy-Weisbach equation, dimensionless
G acceleration of gravity, LT
2
H total head, L
H
L
head loss, L
h
L
head loss at manhole, L
k unit conversion factor. In Manning’s equation, k 1 in metric
units, and k 1.486 in English units (1.486
3
兹苶苶3.28苶, where 3.28 is
the number of feet in 1 meter)
K head loss coefficient, dimensionless
n Manning’s roughness coefficient
n
f
Manning’s roughness coefficient specifically for pipe full
p pressure intensity, FL
2
P wet perimeter of cross section, L
Q discharge, L
3
T
1
Q
min
design minimum discharge, L
3
T
1
Q
max
design maximum discharge, L
3
T
1
R
e
Reynolds number, dimensionless
R
f
hydraulic radius for pipe full, L
R
h
hydraulic radius A/P, L
S slope of energy grade line, dimensionless
S
0
slope of invert, dimensionless
S
w
slope of water surface, dimensionless
S
–
average energy grade line slope
T width of the water surface, L
V mean velocity (Q/A), LT
1
V
1
, V
2
velocity at upper and lower reaches or different conduit cross
sections
V
c
critical velocity, LT
1
V
n
velocity at normal depth
X distance along conduit or channel, L
Y height above invert, L
y
1
,y
2
conjugate depths before and after a hydraulic jump, L
y
c
critical depth, L
y
n
normal depth, L
z height of invert above datum, L
z¯
1
, z¯
2
distance from the centroid to the free surface at section 1 or 2
momentum coefficient, dimensionless
water specific weight, FL
3
HYDRAULICS OF SEWERS 115

difference operator
angle of sewer invert from horizontal, radians
angle in radians; see Fig. 5-3
pipe roughness, L
absolute viscosity, FTL
2
kinematic viscosity, L
2
T
1
water density, ML
3
0
average shear stress between fluid and conduit wall, FL
2
c
critical shear stress, FL
2
5.3. HYDRAULIC PRINCIPLES
5.3.1. Types of Flow
Hydraulically, there is little to distinguish wastewater from stormwa-
ter or potable water. Herein, the words water or liquid imply wastewater,
and conduit implies any type of sanitary sewer. Open-channel flow means
that atmospheric pressure (zero gauge pressure) exists at the surface of
flow, and pressure flow means that water completely fills the conduit and
the gauge pressure at the conduit crown is greater than zero. Flows in
sewers vary both spatially and temporally; they are described at any point
as unsteady flow, and from location to location as spatially varied flow.
However, these variations are of negligible importance in the design of
open-channel sewer conduits as long as capacity and self-cleansing are
addressed for each reach in the system.
The traditional and usually accepted approach to achieving adequate
capacity and self-cleansing design is to assume one-dimensional, incom-
pressible, steady, uniform flow. To accomplish these goals, for each reach
in a system good estimates of flow rates are needed for design maximum
flow (design capacity flow) for capacity evaluation and design minimum
flow for self-cleansing evaluation.
5.3.2. Equations for Fluid Flow
5.3.2.1. One-Dimensional Steady Flow
Equations of motion for one-dimensional steady flow along a conduit
are rather simple. Special forms of general equations for one-dimensional,
spatially varied, unsteady flow must be used in special cases. The general
equations must be used for more complex flows, such as waves in open-
channel flow (Sturm 2001); passage from free surface flow to pressure
flow; unsteady flow in pressure conduits (Yen 2001); and water hammer
(Martin 1999). In sewers that have large, concentrated, extraneous inflow,
rapid filling may occur during rain events, with the flow passing rapidly
116 GRAVITY SANITARY SEWER DESIGN AND CONSTRUCTION

from free surface flow to pressurized flow, possibly resulting in surcharg-
ing manholes and structural damage. The use of the full dynamic equa-
tions or the Preissman slot model is needed to analyze such situations
(Yen 2001; Cunge and Wegner 1964). Calculations for many of the com-
plex cases are now practical, largely due to modern computer speed (see
Table 5-8; Zhao 2001; Stein and Young 2001; and Yen 1999).
5.3.2.2. Continuity Principle
The continuity principle as commonly used in water flow is based on
the general conservation of mass model. For steady flow (constant over
time) with no storage changes along a section, inflow equals outflow. For
incompressible flow, continuity is often expressed as in Eq. (5-1).
Q V
1
A
1
V
2
A
2
. . . V
n
A
n
(5-1)
where Q is the volumetric flow rate, V is the average velocity, and A is the
cross-sectional area normal to the velocity vector, V.
5.3.2.3. Energy Principle
At any section in a flowing fluid, total energy is the sum of the poten-
tial energy—generally consisting of elevation and pressure terms—and
the kinetic energy. The most common way of expressing total energy at a
point in open-channel flow is given in Eq. (5-2):
(5-2)
In this formulation, H is energy per unit weight and has units of FL/F,
or net units of L (height). H is often referred to as total head or energy line
(EL) and the three terms on the right-hand side of Eq. (5-2) are referred to
as elevation head, z, depth head, y, and velocity head, V
2
/2g. The plot of the
sum of z and y along conduit is the free water surface and is also called the
hydraulic grade line (HGL).
More accurately, the depth head term, y, in the equation should be writ-
ten y cos
2
, where is the slope angle of the channel, but must be greater
than about 2 degrees (slope 0.035) to change the third significant num-
ber in values for that term. Likewise, the velocity head term would be
more accurately given as V
2
/2g, where accounts for the effect of the
velocity distribution in the cross section on the kinetic energy. For sewer
flow, the value of the velocity coefficient, , ranges from 1.10 to 1.20 (Chow
1959). Given these small deviations from 1.0 and the fact that velocities are
normally low in sewers—making the velocity head term rather small com-
pared to the depth term— is normally assumed to be 1.0.
Hzy
V
g
2
2
HYDRAULICS OF SEWERS 117
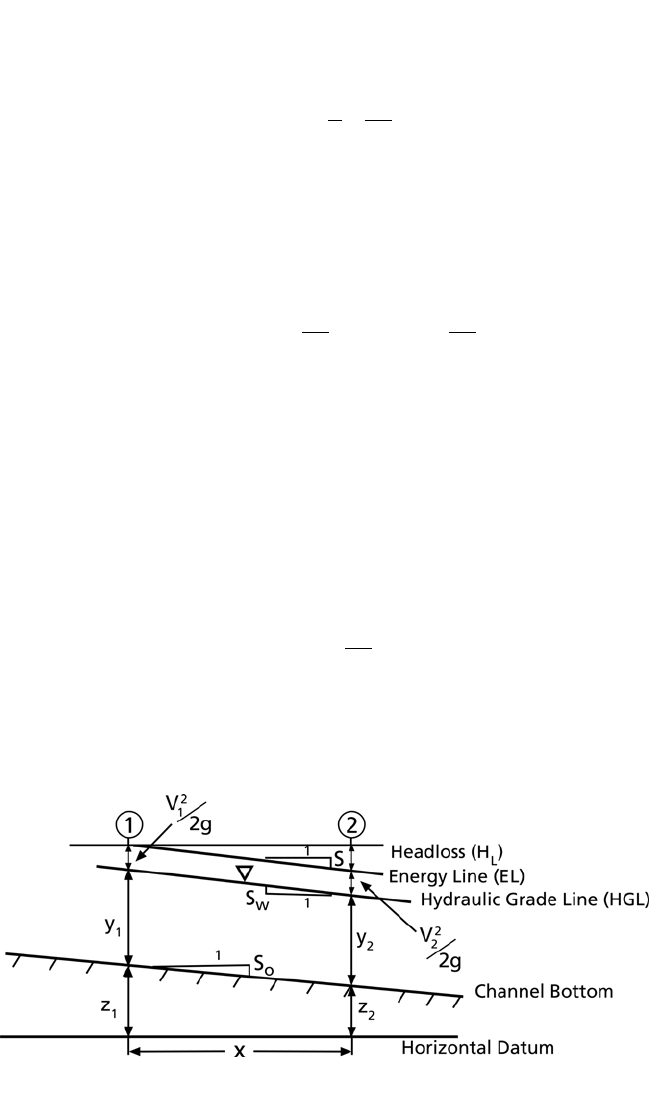
In pressure conduits, the energy equation is modified to give Eq. (5-3):
(5-3)
where z is the elevation of the cross-section centroid and p/ is the pres-
sure head at the area centroid of the pressure conduit.
The difference in total head at two different sections is equal to the
energy losses between those sections, as given in Eq. (5-4):
(5-4)
Figure 5-1 depicts slope and energy relationships for open-channel
flow. For uniform flow, then S S
0
S
W
; for varied flow, they are not
equal.
5.3.2.4. Specific energy, alternate depths, and critical depth
Specific energy is defined as energy relative to the invert (bottom)
of the channel. The common expression for specific energy is given in
Eq. (5-5):
(5-5)
Specific energy is of no direct value in the hydraulic analysis or design
of sewers, although it is of theoretical interest and can be used in deriva-
Ey
V
g
2
2
Hzy
V
g
zy
V
g
L
11
1
2
22
2
2
22
⎛
⎝
⎜
⎞
⎠
⎟
−
⎛
⎝
⎜
⎞
⎠
⎟
Hz
p
V
g
2
2
118 GRAVITY SANITARY SEWER DESIGN AND CONSTRUCTION
FIGURE 5-1. Slope and energy relationships for open-channel flow.

tion of the critical depth equation or in calculation of water surface pro-
files, as discussed later in this chapter. Given a channel cross section and a
flow rate, a plot of the specific energy versus depth of flow is referred to
as a specific energy curve. An example for an 8-inch (200-mm) pipe is given
in Fig. 5-2. The curve illustrates that, in general, for any depth of flow
there is another depth of flow that has the same energy. These two depths
are called alternate depths. However, in a closed conduit the second depth
may not be possible. The fact that two depths exist at the same energy is of
limited practical significance in open channels, including sewers, because
a different slope and/or roughness would be needed to cause the other
depth to occur as a uniform flow depth.
The minimum value point on a specific energy curve identifies the crit-
ical depth, a singular point at which the alternate depths merge into a sin-
gle depth. It is of passing interest that, near critical depth, relatively large
variations in depth of flow, y, are associated with small variations in
energy and flow rate.
In a channel, flow at depths deeper than critical depth (and thus veloc-
ities smaller than critical velocity) is referred to as subcritical flow, and
flow at shallower depths (and thus velocities larger than critical velocity)
HYDRAULICS OF SEWERS 119
FIGURE 5-2. Examples of specific energy curves for a circular conduit—Q in cfs.

as supercritical flow. Two of the more important considerations associ-
ated with these flow regimes are (1) when supercritical flow occurs, a
hydraulic jump will occur when the flow downstream is subcritical; and
(2) when considering water surface curves, the control point (i.e., the
starting point depth of a water surface profile calculation) is upstream
and the surface curve develops going downstream when the actual depth
of flow is in the supercritical range. Conversely, the control point is
downstream and the surface curve develops back upstream when in the
subcritical range.
For a general cross section, the specific energy [Eq. (5-5)] can be differ-
entiated with respect to y and equated to zero to determine the minimum
point. The resulting relationship many be written as Eq. (5-6):
(5-6)
When V
c
A
c
replaces Q, this equation may also be rewritten as Eq. (5-7):
(5-7)
where the cross-sectional area at critical depth is A
c
and width of the
water surface is T. The ratio A/T is called the hydraulic depth, d
m
, so Eq. (5-7)
may be modified to give Eq. (5-8):
(5-8)
The Froude number, F
n
, may be stated as the ratio of the actual velocity
to the critical velocity as given in Eq. (5-9):
(5-9)
For subcritical flow, F
n
1 and for supercritical flow, F
n
1, with F
n
1 at
the critical point.
In Eq. (5-9) for either a unit width or for a rectangular channel, d
m
becomes depth y
c
and at the F
n
1 critical point the equation can be writ-
ten as Eq. (5-10).
(5-10)
V
g
y
c
c
2
22
F
V
gd
n
m
Vgd
cm
V
gA
T
c
c
Q
g
A
T
c
2
3
120 GRAVITY SANITARY SEWER DESIGN AND CONSTRUCTION

Because the specific energy is the sum of the depth y and the velocity head
V
c
2
/2g, for a rectangular channel the relationship at critical depth becomes
Eq. (5-11):
(5-11)
For complex cross sections (such as circular or elliptical), equations,
tables, or plots are often used to determine the hydraulic depth, d
m
. For a
round conduit, the relationship is given in Eq. (5-12) for the variables as
shown in Fig. 5-3.
(5-12)
where is in radians and D is the conduit diameter.
5.3.2.5. Momentum Equation
For steady flow, Newton’s second law, F ma, can be written as F
(m/t)V and applied to a fluid control volume (volume between two sec-
tions) and expressed as Eq. (5-13):
(5-13)
where 兺F is the sum of all forces acting on the control volume, including
pressure forces 兰pdA at each end section, the weight of the fluid, and the
peripheral forces the conduit applies to the fluid to constrain and guide
the flow. The density is /g.
FVVQ()
22
d
D
m
4
12 2
/ (sin )
sin
⎛
⎝
⎜
⎞
⎠
⎟
Ey
min c
3
2
HYDRAULICS OF SEWERS 121
FIGURE 5-3. Circular conduit geometry.

This equation is called the momentum equation. It is a vector equation
and the forces and velocities have both magnitude and direction. In cases
where velocity variations across the cross section are large and/or high
accuracy is desired, a momentum coefficient may be used, replacing V
with V. In sewers, values range between about 1.03 and 1.07 (Chow
1959). The fact that values are so near to 1 and are generally about the
same at both sections leads to usually assuming they are 1.
Momentum can be used to evaluate a hydraulic jump. Figure 5-4 shows
a general hydraulic jump. The depths y
1
and y
2
are called conjugate depths;
y
2
is also known as the sequent depth to y
1
.
If conduit friction is small compared to the pressure forces, P
1
and P
2
(this will be the case unless the conduit is extremely rough), the momen-
tum equation [Eq. (5-13)] can be written in one dimension (along the con-
duit) for a hydraulic jump to give Eq. (5-14):
(5-14)
where z¯
i
is the distance normal to the free surface to the centroid of the
area A. Equation (5-14) is a general form of the one-dimensional hydraulic
jump equation for a general conduit cross section.
Hydraulic jumps are interesting but are of little practical value in
design of sewer conduits. This is the case since each reach is designed to
flow at its normal depth of full pipe or less. If upstream flow is supercriti-
cal and downstream is subcritical, the hydraulic jump that develops will
simply be the natural transition from the first depth to the second depth.
In essentially all cases in sewer flow, jumps are very small and energy loss
Q
gA
zA
Q
gA
zA
2
1
11
2
2
22
122 GRAVITY SANITARY SEWER DESIGN AND CONSTRUCTION
FIGURE 5-4. A hydraulic jump in a channel of small slope.

is likewise very small. In larger sewers [24 inches (610 mm) in diameter]
they may need to be evaluated. One concern about hydraulic jumps is that
the turbulence may localize the release of malodorous and corrosive
gases, when present.
5.4. FLOW RESISTANCE
5.4.1. Energy Losses
Conceptually, friction losses are simply the energy converted to heat
(lost) due to viscous shear friction along the conduit walls. Since steady,
uniform flow is normally assumed for hydraulic design, the loss rate is just
the pipe slope. In a pressure conduit of constant diameter, where velocity
head is constant, the energy gradient (rate of head loss) is the change in
z p/ over the length and is (z p/)/L. For uniform open-channel
flow, the energy gradient, S, is equal to the sewer slope, S
0
, and the slope of
the water surface, S
W
. If one takes a water element dx long between two
sections and considers (1) static equilibrium for the element, and (2) its
weight and shear forces the walls are exerting upon the element, then the
average shear stress,
0
, can be expressed as given in Eq. (5-15):
(5-15)
For open-channel, uniform flow, the last part of the equation can be
replaced by conduit slope to give Eq. (5-16):
(5-16)
where R
h
is the hydraulic radius and is defined as the ratio of area A to wet-
ted perimeter P for the cross section, as given in Eq. (5-17):
(5-17)
For a full circular conduit, R
h
D/4.
Equation (5-16) is also known as the tractive force equation; it gives the
average shear stress exerted on the channel by the flowing water. This
0
can be used to evaluate self-cleansing in conduits as presented in more
detail later in this chapter. The shear stress necessary to move a design
particle down the sewer is entered into the equation to determine the min-
imum sewer slope needed for self-cleansing for the given diameter and
design minimum flow rate, Q
min
.
R
A
P
h
00
RS
h
0
R
d
dx
p
z
h
⎛
⎝
⎜
⎞
⎠
⎟
HYDRAULICS OF SEWERS 123

5.4.2. Energy Loss Equations
When open-channel flow is steady and uniform, slopes of the water
surface and energy grade line are equal to the slope of the conduit. Vari-
ous empirical equations have been developed over the years to relate
slope (energy loss) to channel size and material and average velocity.
Continuity is then used (Q VA) to determine the flow rate. For uniform
flow and a given discharge, there is just one depth at which the flow equa-
tion is satisfied—the normal depth, y
n
.
The Chézy equation was probably the first flow friction formula. It was
developed by Antoine Chézy around 1768. Nearly 100 years later, Kut-
ter’s equation established a mathematical relationship for the Chézy
constant. It was published about 1869 and received wide acceptance for
estimating open-channel flows. Both the Chézy and the Kutter equations
are now rarely used in practical applications and are mentioned here for
historical interest.
5.4.2.1. The Manning Equation
The Manning equation is widely used and is one of the best open-chan-
nel hydraulics equations. It was developed by the Irish engineer Robert
Manning and first published in 1890 (Yen 1992a). Over time, it has largely
replaced the Chézy and Kutter equations in engineering practice because
of its relative simplicity. The Manning equation can be written as:
(5-18)
where k 1.486 for BG units (Imperial units) and 1.000 for SI units [1.486
is a unit conversion factor, the cubic root of 3.28 (i.e., the number of feet in
a meter), so the Manning n is the same for both BG and SI units]. The vari-
able n is called the Manning roughness coefficient. Although the n value is
commonly perceived as just a function of conduit roughness, it is actually
a function of several other factors (Yen 1992b). This perception of n being
just a function of the conduit roughness is acceptable in cases where it is
sufficient to have velocity and flow rate accurate to within perhaps 20% or
so of true values. If greater accuracy in the Manning n estimate (and hence
the discharge) is desired, then other factors have to be considered. These
will be presented later in this chapter.
Usual ranges of n for various conduit materials are listed in Table 5-1.
A more complete table can be found in Chow (1959).
Figure 5-5 is a nomograph for the solution of the Manning equation for
circular pipes flowing full. An example of its use is illustrated by the bro-
ken lines. The nomograph can be used for other shapes of closed conduits
and open channels if the discharge scale is ignored and the diameter scale
is taken as four times the hydraulic radius of the actual cross section.
Q
k
n
AR S ()
//23 12
124 GRAVITY SANITARY SEWER DESIGN AND CONSTRUCTION

For example, if Q is given with depth to be determined, then the choice
of S and n will indicate a point on the transfer line. By pivoting from this
point, sets of values of 4R
h
and V may be obtained. By successive trials, a
compatible set of values for the given Q and the cross section may be
found, which furnishes the correct depth of flow, y. Such approaches are
now largely replaced by computer programs, available in numerous
forms for both calculators and digital computers, which can make such
calculations with relative ease.
HYDRAULICS OF SEWERS 125
TABLE 5-1. Typical Values for Manning Equation n
Conduit Material Manning n
a
Closed Conduits
Asbestos-cement pipe 0.11–0.015
Brick 0.13–0.017
Cast iron pipe
Cement and seal-coated 0.011–0.015
Concrete (monolithic)
Smooth forms 0.012–0.014
Rough forms 0.015–0.017
Concrete pipe 0.011–0.015
Corrugated Metal Pipe
1
⁄
2
in. (13 mm) 2
2
⁄
3
in.
(68 mm) Corrugations
Plain
Paved invert 0.022–0.026
Spun asphalt 0.018–0.022
Plastic Pipe (Smooth) 0.011–0.015
Polyethylene 0.011–0.015
Polyvinyl Chloride 0.009
b
Vitrified Clay Pipe 0.010
b
Vitrified Clay Liner Plates 0.011–0.015
0.011–0.020
Open Channels—lined
Asphalt 0.013–0.017
Brick 0.012–0.018
Concrete 0.011–0.020
a
Modified from American Society of Civil Engineers (ASCE). (1982). “Gravity sewer design
and construction.” ASCE Manual and Reports of Engineering Practice No. 60, ASCE,
Reston, Va., unless otherwise noted.
b
French, R. H. (2001). “Hydraulics of open channel flow.” Stormwater collection systems
design handbook, L. W. Mays, ed., McGraw-Hill, New York, with permission.

126 GRAVITY SANITARY SEWER DESIGN AND CONSTRUCTION
FIGURE 5-5. Nomograph for the Manning equation applied to circular conduits.
5.4.2.2. The Darcy-Weisbach Equation
The equation most widely used for all Newtonian fluid flow is the
Darcy-Weisbach equation, which can be stated as given in Eq. (5-19):
(5-19)
S
H
L
f
D
V
g
L
2
2

where H
L
is energy loss in a uniform conduit of length L and diameter D,
and f is the friction coefficient. The f factor is a function of the Reynolds
number and the relative roughness. Traditionally, f values are determined
from the Moody diagram shown in Fig. 5-6 or from Eq. (5-20), the Cole-
brook-White formula (Colebrook 1939):
(5-20)
This formula is applicable for Reynolds numbers of R
e
VR
h
/ 4,000.
When viscous effects are negligible (high Reynolds numbers, R
e
approximately 10
4
), Eq. (5-20) becomes Eq. (5-21):
(5-21)
Since Eq. (5-20) is implicit in terms of f, many explicit relationships
have been proposed. Among these is the Swamee-Jain (Swamee and Jain
1976) equation, written as Eq. (5-22):
(5-22)
The apparent conduit roughness, , is sometimes referred to as the
hydraulic roughness or else the effective absolute roughness. For open-channel
flow, D is replaced with 4R
h
. The dimensionless Reynolds number is for-
mulated as given in Eqs. (5-23) and (5-24):
(5-23)
(5-24)
where is the kinematic viscosity. Equation (5-24) is used for a general
cross section.
Introducing S in Eq. (5-19) into Eq. (5-16), and noting that R
h
D/4,
yields Eq. (5-25):
(5-25)
where /g is the fluid density.
0
2
8
fV
R
RV
e
h
4
R
DV
e
f
DR
e
1 325
574
090
2
.
log
.
.
ε
3.7
⎛
⎝
⎜
⎞
⎠
⎟
⎡
⎣
⎢
⎢
⎤
⎦
⎥
⎥
1
20
f
R
h
−
⎡
⎣
⎢
⎤
⎦
⎥
. log
ε
14.83
1
20
252
4f
R
Rf
h
e
−
⎡
⎣
⎢
⎢
⎤
⎦
⎥
⎥
. log
.ε
14.83
HYDRAULICS OF SEWERS 127

128 GRAVITY SANITARY SEWER DESIGN AND CONSTRUCTION
FIGURE 5-6. Moody diagram. Source: L. F. Moody. (1944). Trans ASME,
Vol. 66.

It is important to note that most applied water hydraulics design situa-
tions, including pressure flow and open-channel flow, fall into the
Reynolds number range of 10
5
to 10
6
and relative roughness range of 10
4
to 10
_6
(0.0001 to 0.000001). As can be found in Fig. 5-6, this zone is near
to or on the hydraulically smooth boundary. In this zone, rather large dif-
ferences in conduit roughness cause only slight differences in f values for
the normal range of manufactured and constructed channel or pipe
roughness used in sanitary sewers. This outcome results from the pres-
ence of a laminar sublayer near the conduit wall that is thick enough in
this zone that the physical roughness is largely or completely submerged
within this sublayer, and the resistance is essentially fluid flowing on a
fluid boundary, which is the smoothest that the boundary can be.
The Darcy-Weisbach equation is applicable to both pressure and open-
channel flow, but in civil engineering practice it has been used sparingly
and usually for pressure flow. Going forward into the future, the Darcy-
Weisbach equation should be used much more, perhaps to the point of
being rather exclusive, for both pressure and open-channel applications.
The reason for this transition to more general use is that modern calcula-
tors and computers make the Darcy-Weisbach equation just as easy to
apply as other less accurate and more limited equations. Ironically, such
equations were initially developed and used because, in precomputer
times, they were less unwieldy than the Darcy-Weisbach equation. Some
argue that the Darcy-Weisbach equation cannot be used in sewer design
since buildup of a slime layer in sewers has an unknown effect on the
f value—that is, the ε/D or ε/(4R
h
) is hard to estimate. As addressed in the
preceding paragraph, this is a negligible concern since value variation
over a reasonable range results in little change in the f value.
5.4.2.3. The Hazen-Williams Equation
The Hazen-Williams equation (5-26) has been used as a practical equa-
tion for water flow in pressure conduits, similar to the use of the Manning
equation for open-channel flow. Both equations may be used for both
pressure and open-channel flows as long as velocities are moderate and
the conduit diameter is not too small.
Q kC
HW
AR
0.63
h
S
0.54
(5-26)
where k 1.32 in BG units and 0.850 in SI units. The nomenclature is the
same as used above; C
HW
is the Hazen-Williams coefficient, which is also
considered to depend mainly on just conduit roughness.
Values for the coefficient vary from about 40 for a badly tuberculated,
smaller-diameter pipe to about 160 for a very smooth pipe. Normal appli-
cation values range from about 100 to 140. However, the Hazen-Williams
equation is being used less because, again, the more accurate and versatile
HYDRAULICS OF SEWERS 129

Darcy-Weisbach equation is now easily used on calculators and comput-
ers. Although the Hazen-Williams equation can be used for open-channel
calculations, such use is rare. If it is used for partially full conduits, the
hydraulic elements in Fig. 5-7 can be used as it is in the other equations.
Values of C
HW
can be found in Lansey and El-Shorbagy (2001) and many
other sources.
5.4.2.4. Partial Depth Calculations
Fluid flow equations are used for conduits of all shapes flowing either
full or partly full. For conduits with complex cross sections, equations,
tables, or graphs must be available that give relationships between size
and depth of flow and the area and hydraulic radius. For a circular shape
(as shown in Fig. 5-3), the equations relating the pertinent variables are
given as Eqs. (5-27), (5-28), (5-29), and (5-30). Since the depth, y, is more
convenient than to measure or use directly, Eq. (5-28) can be used to
determine for a given conduit diameter and flow depth. This , meas-
ured in radians, can then be used in Eqs. (5-29) and (5-30) to calculate the
partially full area and hydraulic radius.
(5-27)
y
D
2
1( cos )
130 GRAVITY SANITARY SEWER DESIGN AND CONSTRUCTION
FIGURE 5-7. Hydraulic elements plot for circular conduits. Modified from: T. R.
Camp. (1946). “Design of sewers to facilitate flow.” Sew. Works Jour. 18(3).

(5-28)
(5-29)
(5-30)
Simultaneous solution of these geometric elements and the selected
flow equation is rather unwieldy, but is much easier now via calculators
and computers. To bypass using these equations, hydraulic elements
graphs are still used at times to facilitate applying flow equations to par-
tially full flow. Figure 5-7 graphically depicts the geometric as well as
velocity and flow rate relationships between full pipe and partial depth
flows. Figure 5-7 is used by calculating the full pipe area, the hydraulic
radius, and full-pipe velocity and flow rate using the selected flow equa-
tion—usually the Manning equation. Depending on which variables are
known, values are identified on the appropriate curves and unknowns
are calculated from the associated ratio values taken from the plot.
For example, for y/D 0.8, which corresponds to the depth of maxi-
mum velocity, one reads from Fig. 5-7 that A 0.86A
f
and R
h
1.22R
f
.
Noting that A
f
D
2
/4 and R
f
D/4, then AR
h
2/3
0.306D
8/3
and Man-
ning’s equation becomes:
(5-30A)
from which
(5-30B)
This relation can be used for the determination of the diameter for a
given Q, n, and S so that the flow occurs at 80% depth.
For full pipe,
(5-30C)
If the engineer wants to design for some other partial depth of flow, then
A and R
h
values for the partial depth desired could be put into Eq. (5-
30A) to yield the desired equation for the calculated diameter for the
given Q, n, and S values.
D
nQ
kS
1 548
12
38
.
/
/
⎡
⎣
⎢
⎤
⎦
⎥
D
nQ
kS
1 559
12
38
.
/
/
⎡
⎣
⎢
⎤
⎦
⎥
Q
k
n
DS 0 306
83 12
.
//
R
D
h
4
1
2
2
sin
⎛
⎝
⎜
⎞
⎠
⎟
A
D
2
4
1
2
2sin
⎛
⎝
⎜
⎞
⎠
⎟
cos
−
⎛
⎝
⎜
⎞
⎠
⎟
1
12
y
D
HYDRAULICS OF SEWERS 131

5.4.3. Manning n Values from the Darcy-Weisbach Equation
The Darcy-Weisbach equation is generally accepted as the most accu-
rate equation for fluid flow. If the Manning and Darcy-Weisbach equa-
tions are combined (Yen 1992b) by setting S H
L
/L and D 4R
h
in the
Darcy-Weisbach equation, the result is Eq. (5-31):
(5-31)
where k 0.0926 for BG units and 0.1129 for SI units.
This relationship indicates dependence of n on hydraulic radius and
f (diameter, velocity, viscosity, and pipe roughness.) Equations (5-22),
(5-24), and (5-31) can be used to evaluate these relationships. For full-pipe
flow and the range of variables D: 6 to 48 inches (153 to 1,220 mm); V: 1.5
to 12 fps (0.5 to 3.5 mps) for constant values for ε 0.0001 ft (0.03 mm);
and at 60 °F (15 °C), calculated n values range from the lowest of n
0.0076 for a 6-inch- (153-mm)-diameter conduit at 12 fps (3.7 mps), to the
highest of n 0.0106 for a 48-inch- (1,220-mm)-diameter conduit at 1.5 fps
(0.5 mps) (Merritt 1998). Figure 5-8 illustrates the relationships between n
value, velocity, roughness, and diameter. Water temperature also affects
n value via viscosity in the Reynolds number, but the effect is relatively
small over the 50 °F to 75 °F (10 °C to 23 °C) temperature range normally
nkRf
h
16 12//
132 GRAVITY SANITARY SEWER DESIGN AND CONSTRUCTION
FIGURE 5-8. Manning n versus velocity for selected roughness values for an
8-inch (200-mm) pipe.

encountered in sewage. Likewise, for the normal range of sewer conduit
roughness—from about 0.0001 ft (0.03 mm), a value for smooth-finish
concrete, to about 0.000005 ft (0.0015 mm) for plastics—roughness differ-
ences cause relatively very small differences in n. However, for increasing
roughness values [greater than about 0.0001 ft (0.03 mm)], n values begin
to increase very significantly, as these increasing ε values move the flow
regime away from the hydraulically smooth boundary and /D values
become important.
5.4.4. Variation in Manning n with Partial Flow Depths
If Eqs. (5-27) through (5-31) are used for partial depths to evaluate
n variation with depth of flow, results show essentially no variation in
n until the partial flow ratio (y/D) is less than about 15%, at which the n/n
f
ratio begins to increase. The n increase is not significant at two significant
digits until the conduit is less than about 10% full (Merritt 1998). This
observation is supported by experimental findings of others (e.g., Schmidt
1959; Tullis 1986) and indicates that n value variation with depth of flow
in circular sewer conduits [as tentatively postulated by Camp (1946)] and
included in recent editions of this Manual is in error. As a practical mat-
ter, constant or slightly variable n with depth of flow is of little conse-
quence in hydraulic design of sewers as long as an appropriate n value is
used for capacity calculations.
5.4.5. Manning n Recommended Values
Most sewer design codes and reference sources for n are based on
observations and judgments made nearly 100 years ago. They typically
recommend a Manning n 0.013 be used for all sanitary sewer design.
Subsequent empirical results from full-scale setups and operating sewers
using modern pipe and joints report that n actually ranges from about
0.008 to 0.011 (May 1986; Straub et al. 1960; Tullis 1986). These values are
about the same as those calculated from Darcy-Weisbach relationships. It
should be noted that values calculated from the Darcy-Weisbach relation-
ships are empirical (not theoretical), since they are based on actual water
flow experiments in open channels. Thus, it appears that for operating
sewers Manning n values are very close to values predicted by the Darcy-
Weisbach relationships, although they range from about 15% to 40% less
than the traditional value of 0.013.
Proponents of higher Manning n values argue that in operating sewers
a higher n value covers possible significant flow retardation, which can be
caused by pipe misalignment and joint irregularities, interior corrosion or
coating buildup, cracks and breaks, protruding or interfering laterals,
sediment buildup, etc. Although these factors do cause higher operating
HYDRAULICS OF SEWERS 133

n values, when they are moderate [in combination, in the smaller diame-
ters of perhaps less than 24 inches (610 mm)], they cause far less increase
than exhibited by the traditional 0.013 value. For larger diameters, values
are closer to the traditional 0.013 value. Designers should recognize that
with good installation and maintenance, actual pipe capacities will
be larger than calculated values resulting from use of a traditional high
n value. Regulatory agencies are encouraged to allow informed discretion
in selecting n values. Values given in Table 5-2 are suggested (Haestad
et al. 2004). Agencies are encouraged to adopt similar values into their
codes and guidelines.
The Extra Care values are based on the Darcy-Weisbach equation; Typi-
cal values are 15% higher; and Substandard values are 30% higher. The use
of n values given in Table 5-2 acknowledges the significant variation of
n with pipe diameter, while ignoring the smaller variations caused by
velocity, relative roughness, and temperature. A cautionary note: If the
actual conduit roughness is greater than about 0.0001 ft (0.03 mm)
(rougher than smooth-finish concrete), n values begin to increase signifi-
cantly, as shown in Fig. 5-8; however, even then the presence of a normal,
thin slime film moderates the increased roughness.
5.5. SELF-CLEANSING IN SANITARY SEWERS
5.5.1. Sanitary Sewer Solids
Solids encountered in sanitary wastewater can be classified in the fol-
lowing categories (Ashley and Hvitved-Jacobsen 2002):
1. Large fecal and other organic matter.
2. Paper, rags, and miscellaneous sewage litter (tampons, sanitary towels,
etc). Garbage grinders also contribute higher organic solid loadings.
Other substances may be added from industrial sources.
3. Fine fecal and other organic particles.
134 GRAVITY SANITARY SEWER DESIGN AND CONSTRUCTION
TABLE 5-2 Suggested Values of Manning n for Sewer Design Calculations
Pipe Diameters in inches
Condition 6. 8. 10. 12. 15. 18. 24. 30. 36. 48. 60.
Extra Care: 0.0092 0.0093 0.0095 0.0096 0.0097 0.0098 0.0100 0.0102 0.0103 0.0105 0.0107
Typical: 0.0106 0.0107 0.0109 0.0110 0.0112 0.0113 0.0115 0.0117 0.0118 0.0121 0.0123
Substandard: 0.0120 0.0121 0.0123 0.0125 0.0126 0.0127 0.0130 0.0133 0.0134 0.0137 0.0139
Note: Extra care values are calculated from the Darcy-Weisbach equation for 60 °F, 2 fps velocity, ε 0.0001 ft.
Typical values are 15% higher than Extra Care values; Substandard values are 30% higher than Extra Care values.
After Haestad, M., et al. (2004). Wastewater collection system modeling and design, Haestad Press, Waterbury,
Conn., with permission.

In the United States, the concentration of suspended solids in domes-
tic sewage varies from 100 to 350 mg/L (Metcalf & Eddy, Inc. 2003). Typ-
ical sanitary sewage contains about 210 mg/L of suspended matter, of
which about 160 mg/L is mineral and 50 mg/L is organic (Tchobanoglous
et al. 2003). Table 5-3 lists sewer sediment characteristics as classified in
the UK.
Self-cleansing sewers are capable of transporting most solids to the
desired point, usually a treatment facility. When slopes are relatively flat,
and thus the pipe’s self-cleansing power is marginal, large variations in
sewage flow in a reach may result in solids deposition at times of low
flows. These deposits are usually eroded and transported later at times of
higher flows. As noted in Chapter 4, organic solids deposited during low
flows may trigger the generation of hydrogen sulfide and methane gas
from anaerobic decomposition This condition, if persistent, can create
hazardous conditions, corrode concrete and iron pipes, and make any
overflow or exfiltration from incontinent sewers more objectionable.
Excess sedimentation may result in clogging, possible surcharge, and
more persistent anaerobic decomposition with the attendant problems
mentioned above. These factors accentuate the necessity of constructing
self-cleansing sewers wherever possible.
5.5.2. Traditional Approach to Self-Cleansing
Traditionally, an experience-based criterion of 2 fps (0.61 mps) for full-
pipe flow was adopted and incorporated into most codes and guidelines
as the minimum velocity requirement for self-cleansing. This criterion
established a rather simple way to calculate minimum slopes based on
full-pipe calculations, but 2 fps was not originally intended to be the
required velocity for shallow depths of flow; it was intended just for full
pipe. The intent was that the lower velocities at shallow depths of flow
would still avoid serious sedimentation problems.
HYDRAULICS OF SEWERS 135
TABLE 5-3. U.K. Sewer Sediment Characteristics
Normal
Concentration Median Particle
Transport
(mg/L) Size d
50
(m) Specific Gravity
Type Mode Low Med High Low Med High Low Med High
Sanitary Solids Suspension 100 350 500 10 40 60 1.01 1.4 1.6
Stormwater Suspension 50 350 1,000 20 60 100 1.1 2.0 2.5
Solids
Grit Bedload 10 50 200 300 750 1,000 2.3 2.6 2.7
Butler, D. et al. (1996a). “Sediment transport in sewers—Part 1. Background.” Proc., Inst. Civil
Engrs., Water, Maritime and Energy, 118, 103–112, with permission.

Hager (1999) recommends a minimum velocity between 2 and 2.3 fps
(0.6 to 0.7 mps). The 1982 edition of this Manual (ASCE 1982) recom-
mends a minimum full-pipe velocity of 2 fps and indicates a preferred
velocity as high as 3 fps (0.91 mps) at maximum discharge, whenever pos-
sible, to scour the sands and grit that may have accumulated in the sewer.
That Manual also stated that an actual velocity of 1 fps (0.30 mps) at low
flows only prevents deposition of the lighter sewage solids but serious
deposition of sand and gravel is possible. The tractive force approach
given in Section 5.5.3 in this Manual is now recommended since it
addresses self-cleansing more accurately. However, during the conver-
sion period some projects may require an analysis of the velocity at actual
depth of flow. The procedure to check the velocity for a given Manning n
and given maximum discharge Q
max
and slope is as follows:
1. Estimate the diameter to carry the maximum discharge. For full-pipe
condition, use Eq. (5-30C). For maximum velocity occurring at 80% of
the depth, the sewer diameter will be given by Eq. (5-30B).
2. Round up the calculated diameter to the next commercially available
size.
3. Calculate the left-hand side of the following equation:
(5-31A)
and solve for the normal depth y
n
at the maximum discharge. This can
be done by computer program, graphically (Chow 1959; Sturm 2001),
or by trial and error. For the latter method, select trial values of y/D,
calculate successively from (5-28), A from (5-29), R
h
from (5-30), and
AR
h
2/3
until the latter value matches the calculated left-hand side of the
above equation.
4. For the normal depth obtained in the previous step, calculate V Q/A
(which will be close to the full-pipe velocity) and verify that this veloc-
ity satisfies the prescribed 2 fps minimum velocity criterion so that the
sewer is self-cleansing at approximately full-pipe discharge (or 80%
depth). If not, the slope may have to be increased until a satisfactory
velocity is obtained.
This 2 fps (0.61 mps) criterion was also commonly combined with n
0.013 in the Manning equation to generate minimum allowable slopes for
each conduit size. For example, Table 5-4 uses these values to calculate the
minimum slopes contained in the widely followed Great Lakes Upper
Mississippi River Basin (GLUMRB) standards. Such guidelines have gen-
erally resulted in adequate self-cleansing, but result in higher self-cleansing
nQ
kS
AR
h
12
23
/
/
136 GRAVITY SANITARY SEWER DESIGN AND CONSTRUCTION

power than is needed in many cases (particularly in smaller-diameter
pipes in which low-flow depths are deeper than about 20% full), and in
inadequate self-cleansing power in others (particularly in larger-diameter
pipes flowing less than about 30% full and smaller-diameter pipes flow-
ing less than about 20% full).
Yao (1974) and others have shown that the use of the same full-pipe, min-
imum-velocity criterion for all conduit sizes often results in overdesign
(steeper slopes than needed) of small-diameter pipes and underdesign (flat-
ter slopes than needed) of larger ones. A problem exists with traditional crite-
ria since velocity magnitude alone is a poor indicator of self-cleansing power.
Nevertheless, these guidelines are conservative enough that they result in
adequate self-cleansing in most sewers. The breakpoint between small and
large sewers used here is about 18 inches (457 mm), but the transition is con-
tinuous with the smallest diameter having the most conservative minimum
HYDRAULICS OF SEWERS 137
TABLE 5-4. Recommended Minimum Sewer Slopes,
Per Ten-State Standards
Pipe Diameter Slope, ft/100 ft (m/100 m)
Inch mm Equivalent Calculated
a
GLUMRB
b
6 152 0.49 —
8 203 0.34 0.40
10 254 0.25 0.28
12 305 0.2 0.22
15 381 0.15 0.15
18 457 0.12 0.12
21 533 0.093 0.10
24 610 0.077 0.08
27 686 0.066 0.067
30 762 0.057 0.058
33 838 0.05 0.052
36 915 0.050 (2.1)
c
0.046
39 991 0.050 (2.2)
c
0.041
42 1,067 0.050 (2.3)
c
0.037
a
Calculated with the Manning equation, n 0.013, velocity 2 fps (0.61 mps).
b
Great Lakes Upper Mississippi River Board (1997).
c
Recommended that 0.050 be the minimum slope for large-diameter pipe. Number in paren-
theses indicates velocity in fps.

slope and the largest diameter having the most troublesome minimum slope,
if based on a full-pipe velocity of 2 fps (0.61 mps).
The reliance on full-pipe minimum velocity as a self-cleansing
requirement was also widely used internationally, but now tractive force
criteria are being increasingly used. Since sediment deposition problems
still occur in some sewers designed for about 2 fps (0.61 mps), particu-
larly with increasing sewer size, often the response was to require
steeper and steeper minimum slopes to achieve higher and higher full-
pipe velocities. By the 1990s this trend generally culminated with some
countries promoting minimum slopes that give full-pipe velocities of
some 2.5 to 3.5 fps (0.75 to 1.1 mps) for sanitary sewers and 3.5 to 5 fps
(1.1 to 1.5 mps) for storm sewers (Nalluri and Ghani 1996). The British
Construction Industry Research and Information Association (CIRIA)
(Ackers et al. 1996) approach is based on a many-year effort to identify
full-pipe velocities that would nearly always ensure self-cleansing for a
range of commonly encountered conditions. This approach is outlined in
the appendix at the end of this chapter.
More recently, some countries have also begun making a transition to a
tractive force design approach that considers actual low flows, which then
allows flatter minimum slopes for sewers with relatively large minimum
flow rates and requires steeper minimum slopes for those with relatively
small minimum flow rates.
According to Ackers et al. (1996), conditions in a sewer should be suffi-
cient to:
• Transport a given concentration of fine-grained or lower-density
particles in suspension.
• Transport coarser particles as bedload (temporary small depth of
deposition may be acceptable).
• Erode deposits from the bed which may exhibit cohesivelike properties.
In residential sewersheds, bedload sediment transport is usually the con-
trolling transport mechanism in sanitary sewers as well as storm sewers.
Peak flows associated with diurnal and weekly flow rate fluctuations are
usually sufficient to cause bedload movement and prevent buildup of cohe-
sive deposits. Therefore, to achieve self-cleansing a conduit needs to peri-
odically achieve a critical shear stress sufficient to transport the bedload
before the bedload has had sufficient time to congeal or become cohesive.
This concept underpins the approach presented in following paragraphs.
Note that for very large collectors and combined sewers, a more sophisti-
cated identification of the sediment load may be desirable (Ota and Nalluri
2003); however, the approach given below yields essentially the same
results unless the wastewater contains an unusually large quantity of larger
sediment and/or has an unusually high cohesive propensity.
138 GRAVITY SANITARY SEWER DESIGN AND CONSTRUCTION

5.5.3. Tractive Force Approach to Self-Cleansing
ASCE and WEF now advocate a transition to the tractive force
approach for self-cleansing design. Minimum velocity and minimum
slope guidelines that are similar to those in Table 5-4 will likely continue
to be used for some time; however, they are inferior to the tractive force
approach for setting minimum slopes for self-cleansing. Proper applica-
tion of the tractive force method strongly depends on selection of an
appropriate design sediment particle and good, realistic estimates of
design minimum flow rates, Q
min
, for each reach designed. See Chapter 3 for
information on determining Q
min
values.
The average shear stress exerted by flowing fluid on a conduit can be
expressed as Eq. (5-16) (
0
R
h
S). Although this shear stress has also
been referred to as tractive tension, drag shear, and others, the term trac-
tive force will be used herein. Tractive force design, as developed in this
chapter, is based on the concept that if a conduit is to adequately transport
solids, there exists a design discrete-grit particle that must be transported
often enough that it does not accumulate into a permanent sediment layer
along the bottom. All other solids are more easily transported than this
design particle. In concept, at the design low-flow Q
min
this design particle
is not suspended by turbulence, as are most of the larger, less dense, and
smaller, equally dense particles. Instead, it is dragged along the conduit
invert as moving bedload. This occurs since the shear stress acting on it is
larger than the maximum frictional resistance it can develop against the
conduit invert.
The design particle does not have to be continuously moved along the
conduit as long as it is moved often enough that slight accumulations,
which might begin to entrap some organic debris, do not congeal to the
point where their resistance to movement is greater than the design shear
stress.
5.5.4. Sediment Transport Capacity—Magnitude
of Tractive Forces Required
Various efforts have been made to identify the tractive forces required
to transport various sizes and types of particles in sewer conduits (Med-
ina and Vega 2002). However, for sanitary sewers, more data on sediment
quantities, characteristics, and movement vis-à-vis tractive force will help
to fine-tune future refinements to this approach. For example, data can be
developed regarding the slight differences in tractive force values neces-
sary to ensure movement of the design sediments as a function of other
parameters, such as actual representative sediment analysis of the waste-
water to be transported or the presence of unusually large amounts of cer-
tain cohesive materials.
HYDRAULICS OF SEWERS 139

Some applicable results come from experiments done by Raths and
McCauley (1962). A least-squares fit of their results (Haestad et al. 2004)
yields Eq. (5-32):
(5-32)
where k 0.0181 for BG units (
c
in lb/ft
2
) and 0.867 for SI units (
c
in
N/m
2
), and d is the nominal diameter (in mm) for a discrete mineral par-
ticle having a specific gravity of 2.7. Actual domestic sewage was used in
their experiments in a full-scale, 8-inch- (200-mm)-diameter vitrified clay
pipe with slip seal joints. The experimental sewer was constructed at the
Mason, Michigan Sewage Treatment Plant.
1
It is likely that pipe with a
new-condition interior surface rougher than vitrified clay may initially
exhibit slightly higher frictional resistance to bedload sand particles; how-
ever, the very small, sharp projections (which might cause slightly higher
resistance along the pipe invert) are likely to be quickly sanded away by
the bedload sediments in sewage. Therefore, differences in commercial
sewer pipe roughness as affecting particle friction may be largely dis-
counted and the experimental sewer pipes used should be essentially the
same in physical-friction resistance as other commercial pipes.
In Raths’s and McCauley’s experiments, sand particles sized between
0.2 mm and 9.5 mm with an average specific gravity (SG) of 2.7 were fed
into the experimental sewer line through top tees located at 8-ft (2.4-m)
intervals. The largest particle size to pass through the pipe without depo-
sition was identified for a number of slopes and flow rates. The sewage
used as the carrying water in these experiments is considered typical for
residential areas in the United States.
Equation (5-16) can also be applied to existing sewers to calculate the
shear stress for a particular flow rate. Then Eq. (5-32) can be used to deter-
mine the largest particle that will move down the conduit as bedload for
the given flow rate. The experiment from which Eq. (5-32) was developed
addresses only the bedload sediment for sewage with typical suspended
solids levels and typical solids cohesion. Therefore, if the sewage in a
sewer system has significantly adverse combinations of very high organic
solids load and larger sediment loads, a slight decrease in the bedload
sediment carrying capacity might occur.
5.5.4.1. Appropriate Design Particle Size
Consensus seems to be converging toward a 1-mm design particle for
typical sewage; this size is in about the middle of sizes that have been sug-
c
kd
0 277.
140 GRAVITY SANITARY SEWER DESIGN AND CONSTRUCTION
1
Mason is a growing suburban town of 7,200 people (2005) located minutes from
Lansing and East Lansing, Michigan.

gested. From Eq. (5-32), a 1-mm design particle is associated with a critical
shear stress of 0.0181 lb/ft
2
(0.867 N/m
2
). Reasons for using a 1-mm parti-
cle include (1) essentially all of the grit is smaller than this size in typical
sewage, and (2) shear stresses generated in smaller-diameter sewers—say
between 6 and 12 inches (152 to 305 mm) in diameter—placed at tradi-
tional minimum slopes transport a 1-mm particle at about 20% relative
flow depth. Conventional wisdom from the past indicates that small sew-
ers at traditional minimum slopes generally have no significant sedimen-
tation problems if they regularly flow greater than 20% full. In sewers
where larger quantities of larger grit occur, it would be judicious to
increase the design particle size somewhat, maybe to 1.5 to 2 mm, or even
larger in extreme cases where an extraordinary amount of larger grit is
expected in the sewer.
Note that when using Eqs. (5-16) and (5-32), pipes flowing full at tra-
ditional minimum slopes [based on 2 fps (0.61 mps)] would transport a
10-mm particle in an 8-inch- (200-mm)-diameter conduit at its minimum
slope of 0.00334, decreasing to a 1-mm particle in a 60-inch- (1,500-mm)-
diameter conduit at its minimum slope of 0.00023. It is impractical in most
cases, where a sewer needs to be as flat as possible, to make minimum
slopes steep enough to transport very large grit particles at extremely
shallow depths of flow. For example, to transport 10-mm particles in an
8-inch- (200-mm)-diameter pipe at 10% full would require a slope four
times steeper (or 0.0134), since the hydraulic radius at 10% full is about
one-quarter of that for a full pipe.
Figures 5-9 through 5-12 are similar to Fig. 2-22 in Haestad et al.
(2004). These graphs give the relationships between design minimum
flow rates and necessary minimum slopes to achieve self-cleansing for
1-mm, 2.7-SG particles in various pipe sizes. Figures 5-9 and 5-11 are
based on n values 1.15 times the values calculated from the Darcy-Weis-
bach relationships—”good” sewer conditions as referenced in Table 5-2.
Figures 5-10 and 5-12 are based on a constant Manning n value of 0.013.
Equations that may be used in lieu of Figs. 5-9 through 5-12 are given
in Tables 5-5 and 5-6. These equations are limited to the range 0.1 par-
tial depth 0.5; Q
min
is the design minimum flow rate as presented in
Chapter 3.
It is important to note that if tractive force is applied as outlined, it
addresses self-cleansing for the projected worst week in the life of the
sewer. All other times would be better (higher flows/higher tractive force
and greater self-cleansing power). By the end of the design life, normal
long-term growth conditions would substantially increase flow rates for
most pipes in a system, resulting in substantially higher self-cleansing
power than early in its life, since the Q
max
value will be at least several
times larger than the design Q
min
in each sewer reach.
HYDRAULICS OF SEWERS 141

5.6. DESIGN COMPUTATIONS
5.6.1. Capacity Design
Each reach in a sewer must have a size and slope sufficient to (1) not
violate minimum or maximum sewer depths, (2) carry its design capacity
flow rate, and (3) be self-cleansing. The capacity requirement is designed
by using the selected flow equation and the design capacity flow rate,
Q
max
. Usually the Manning equation (Eq. (5-18) is used, but the Darcy-
Weisbach equation is an acceptable replacement in determining the
appropriate n value for the Manning equation. Table 5-2 earlier in this
chapter gives n values calculated from the Darcy-Weisbach equation. The
given Q
max
, selected size (usually diameter), and selected n value are used
to calculate the necessary full-pipe slope to carry Q
max
. Some codes require
that the capacity design be at some percentage of full pipe. It seems more
rational to determine the best possible estimate for Q
max
, including any
safety margin selected, and use full-pipe design. However, a percentage
flow requirement may be accommodated by using Fig. 5-7 to determine
the flow ratio for the percent full needed and increasing the original Q
max
by dividing it by this decimal value. The modified Q
max
can then be used
for the full-pipe design.
The pipe slope necessary to go from the upstream invert depth to the
minimum depth at the next manhole is then calculated and compared to
the necessary pipe slope for capacity. The steeper of the two slopes is
selected at this point. Other sizes may be considered for the reach, as rea-
sonable, with each size being identified with its slope.
Maximum velocity criteria are also important, since extremely high
velocities are troublesome for a number of reasons, including being a haz-
ard to workers and to the structural integrity of the systems, particularly
at manholes. Full-pipe maximum velocity limits for normal sewer con-
duits in the 10 to 15 fps (3 to 4.5 mps) range are often found in codes,
although if the flow goes straight through at essentially the upstream
grade, somewhat higher values would be acceptable. It is judicious to use
lower maximum velocity values and take extra precautions in cases
where flows are increasingly larger.
5.6.2. Self-Cleansing Design
After a diameter and its slope for capacity are determined for a reach,
the slope needs to be checked to determine whether a steeper slope is
required for self-cleansing. If it is, the self-cleansing slope becomes the
design pipe slope and the reach is controlled by self-cleansing rather than
by capacity or sewer minimum invert depth constraints. If the engineer is
required to use the traditional minimum slope approach, the slope found
142 GRAVITY SANITARY SEWER DESIGN AND CONSTRUCTION

in Section 5.6.1 immediately above is compared to the required value and
the larger slope is used for the reach.
If the engineer uses the recommended tractive force approach, the
same check and outcome procedure is followed, except the self-cleansing
slope is determined as outlined in the following sections.
5.6.2.1. Procedure for Calculating Minimum Sewer Slope Using
Tractive Force Design for Self-Cleansing
Several different approaches might be used for self-cleansing based on
the relationships given earlier in this chapter. These approaches are sum-
marized below.
The recommended approach is to use the equations from the variable n
column of Table 5-5 or Table 5-6 to calculate the needed S
min
for the design
Q
min
. These equations result from a least-squares fit for the Q
min
versus
S
min
data for a depth range of 0.10 to 0.40 full. The equations have correla-
tion coefficients above 99%. They are for a 1-mm, 2.7-SG design particle.
A second approach is to use the appropriate curve from Figs. 5-9, 5-10,
5-11, or 5-12. These curves give essentially the same results as the equa-
tions in Tables 5-5 and 5-6, but with a moderate loss in accuracy due to the
graphical nature of this approach.
A third approach can be used for any desired design particle (tractive
force), not just the 1-mm particle used for the tables and figures provided
here. It is applied as follows:
1. Determine the design minimum flow rate, Q
min
, for the reach (see
Chapter 3 for procedures to establish Q
min
). A good estimate of design
minimum flow, Q
min
, for each reach is crucial to accurately achieving
the self-cleansing objective
2. Select a design particle size, normally between about 0.5 and 2 mm (1 mm
is suggested as appropriate for most areas) and use Eq. (5-32) to calcu-
late the critical shear stress as applicable to your design situation. For a
suggested 1-mm particle,
c
is 0.0181 lb/ft
2
(0.867 N/m
2
).
3. Select a trial pipe size.
4. Select an appropriate Manning n value. Use n 0.013 if required; oth-
erwise select an appropriate value from Table 5-2.
5. Iterate on depth of flow, y—select a y value (less than half full) and
solve Eqs. (5-27), (5-28), and (5-30) for R
h
.
.
Put R
h
into Eq. (5-16), solve
for S, and calculate A using Eq. (5-29). Calculate flow rate, Q, using
Eq. (5-26) or another flow equation. Continue to iterate on y until Q
equals the design minimum flow rate, Q
min
. The associated slope, S
min
,
is the minimum slope for self-cleansing for the reach.
For any of the three approaches used, the resulting S
min
value is then
compared to the S
max
value from capacity calculations above. S
min
replaces
HYDRAULICS OF SEWERS 143

144 GRAVITY SANITARY SEWER DESIGN AND CONSTRUCTION
FIGURE 5-9. Self-cleansing slopes as a function of Q
min
calculated Manning
n (BG units).

HYDRAULICS OF SEWERS 145
FIGURE 5-10. Self-cleansing slopes as a function of Q
min
Manning n
0.013 (BG units).

146 GRAVITY SANITARY SEWER DESIGN AND CONSTRUCTION
FIGURE 5-11. Self-cleansing slopes as a function of Q
min
Manning n calcu-
lated (SI units).

HYDRAULICS OF SEWERS 147
FIGURE 5-12. Self-cleansing slopes as a function of Q
min
Manning n
0.013 (SI units).

S
max
if it is larger than S
max
. The resulting slope is that to be used for the
pipe reach considered. Its value might have been determined by (1) slope
to satisfy minimum depth needs, (2) slope needed for peak flow capacity,
or (3) slope needed for self-cleansing. The largest slope of these three
slopes is the design slope.
5.6.2.2.1. Alternate Tractive Force Procedure
This procedure does not use the empirical relationship [Eq. (5-32)] or
a design particle size but, instead, assumes a minimum critical shear
stress for self-cleansing. Hager (1999) and Yao (1974) recommend a crit-
ical shear stress
c
of 0.04 lb/ft
2
(2 Pa) for self-cleansing in separate sani-
tary sewers. This shear-stress level is about what occurs in an 8-inch
(200-mm) pipe when flowing from 45% full to full at 2-fps (0.6-mps)
velocities.
148 GRAVITY SANITARY SEWER DESIGN AND CONSTRUCTION
TABLE 5-5. Design Equations for S
min
BG Units
Q in cfs
Diameter Variable n value* n 0.013
6 inch S
min
0.000801Q
min
0.5687
S
min
0.000729Q
min
0.5600
8 inch S
min
0.000848Q
min
0.5707
S
min
0.000776Q
min
0.5600
10 inch S
min
0.000887Q
min
0.5721
S
min
0.000813Q
min
0.5600
12 inch S
min
0.000921Q
min
0.5731
S
min
0.000846Q
min
0.5600
15 inch S
min
0.000966Q
min
0.5744
S
min
0.000887Q
min
0.5600
18 inch S
min
0.001004Q
min
0.5754
S
min
0.0009221Q
min
0.5600
21 inch S
min
0.001038Q
min
0.5761
S
min
0.0009529Q
min
0.5600
24 inch S
min
0.001069Q
min
0.5768
S
min
0.0009804Q
min
0.5600
27 inch S
min
0.001097Q
min
0.5774
S
min
0.001005Q
min
0.5600
30 inch S
min
0.001123Q
min
0.5778
S
min
0.001028Q
min
0.5600
36 inch S
min
0.001169Q
min
0.5787
S
min
0.001069Q
min
0.5600
42 inch S
min
0.001212Q
min
0.5812
S
min
0.001106Q
min
0.5617
48 inch S
min
0.001255Q
min
0.5865
S
min
0.001143Q
min
0.5665
54 inch S
min
0.001296Q
min
0.5905
S
min
0.001177Q
min
0.5700
60 inch S
min
0.001334Q
min
0.5936
S
min
0.001210Q
min
0.5728
72 inch S
min
0.001405Q
min
0.5975
S
min
0.001271Q
min
0.5763
*Manning n value calculated from Darcy-Weisbach relationships for 60 °F and e 0.0001 ft,
then multiplied by 1.15 to give n values identified as “typical” in Table 5-2.

After inserting this critical shear stress in Eq. (5-10), the slope becomes:
With this value of the slope, Manning’s equation for the velocity V
c
,
corresponding to the critical shear stress
c
, is:
(5-32A)
This equation can be rewritten in a dimensionless form as:
(5-32B)
The left-hand side may be thought of as a dimensionless self-cleansing
velocity V
c
* corresponding to the critical shear stress,
c
. Figure 5-12A
V
Vn
k
g
D
R
D
c
c
c
h
*
/
/
/
⎛
⎝
⎜
⎞
⎠
⎟
⎛
⎝
⎜
⎞
⎠
⎟
12
16
16
1
V
k
ng
R
c
c
h
⎛
⎝
⎜
⎞
⎠
⎟
12
16
/
/
S
R
o
c
h
HYDRAULICS OF SEWERS 149
Table 5-6. Design Equations for S
min
SI Units
Q in lps
Diameter Variable n value* n 0.013
150 mm S
min
0.00538Q
min
0.5691
S
min
0.00473Q
min
0.5596
200 mm S
min
0.00574Q
min
0.5712
S
min
0.00503Q
min
0.5599
250 mm S
min
0.00603Q
min
0.5725
S
min
0.00527Q
min
0.5599
300 mm S
min
0.00629Q
min
0.5736
S
min
0.00548Q
min
0.5599
350 mm S
min
0.00651Q
min
0.5744
S
min
0.00566Q
min
0.5599
400 mm S
min
0.00672Q
min
0.5751
S
min
0.00583Q
min
0.5600
450 mm S
min
0.00690Q
min
0.5757
S
min
0.00598Q
min
0.5600
500 mm S
min
0.00707Q
min
0.5763
S
min
0.00611Q
min
0.5600
600 mm S
min
0.00738Q
min
0.5772
S
min
0.00635Q
min
0.5600
800 mm S
min
0.00790Q
min
0.5786
S
min
0.00676Q
min
0.5600
1000 mm S
min
0.00833Q
min
0.5795
S
min
0.00676Q
min
0.5600
1200 mm S
min
0.00893Q
min
0.5863
S
min
0.00755Q
min
0.5661
1500 mm S
min
0.00972Q
min
0.5934
S
min
0.00817Q
min
0.5723
2000 mm S
min
0.01078Q
min
0.5998
S
min
0.00898Q
min
0.5778
*Manning n value calculated from Darcy-Weisbach relationships for 20 °C and e 0.000031 m,
then multiplied by 1.15 to give n values identified as “typical” in Table 5-2.
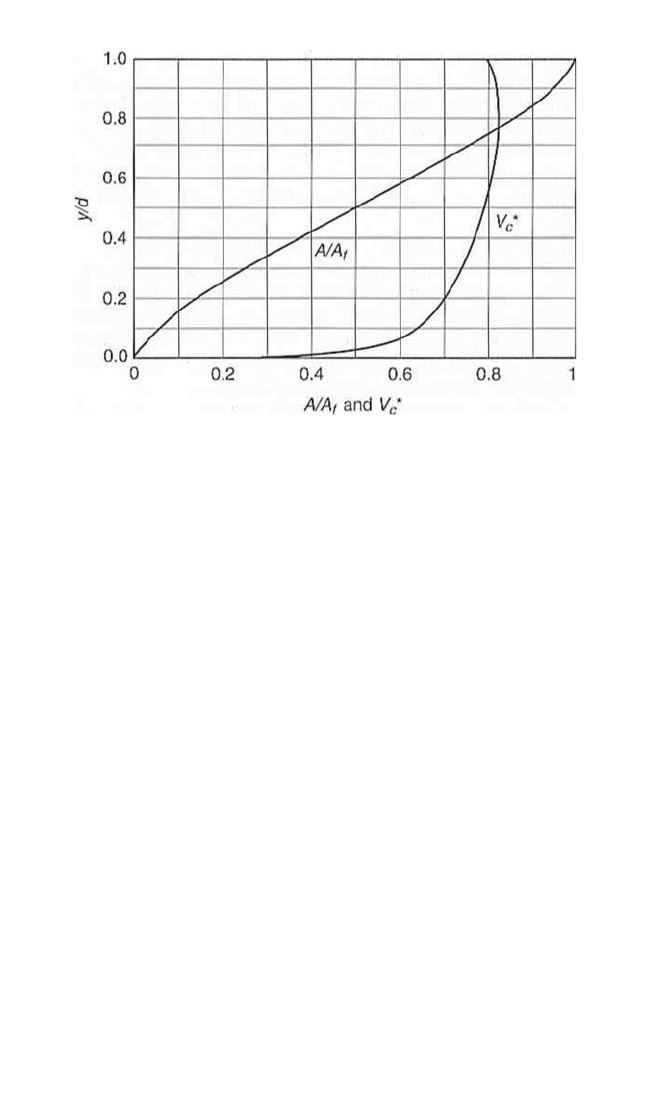
shows a plot of V
c
* versus y/D. It can be seen that V
c
* is approximately
equal to 0.8 for y/D 0.4. Also shown in the figure is a plot of the ratio of
the flow area at a given depth to the pipe full area, A/A
f
versus y/D.
The calculation procedure for checking whether the design discharge is
self-cleansing is as follows:
1. For the given design discharge, trial diameter, and slope, calculate the
normal depth. This can be done by computer, graphically (Chow 1959;
Sturm 2001), or by trial and error. For the latter method, select trial val-
ues of y/D
0
, calculate successively from Eq. (5-28), A from Eq. (5-29),
R
h
from Eq. (5-30), and AR
h
2/3
until the latter value matches (nQ)/(kS
1/2
)
[see Eq. (5-31A)].
2. For the calculated normal depth, calculate the flow cross-section area A
and the velocity V Q/A.
3. Calculate V
c
from Eq. (5-32A) using
c
0.04 lb/ft
2
or 2 Pa, or read V
c
*
from Fig. 5-12A. If the actual velocity V is equal to or greater than the
velocity V
c
corresponding to the critical shear stress, the sewer is self-
cleansing. If this condition is not satisfied, the slope may be increased
to increase the actual flow velocity and the associated shear stress.
It is not recommended that this approach be applied to depths of flow
less than about 45% full since it would require a downward adjustment of
the shear-stress
c
value with increasingly shallower depths to avoid
150 GRAVITY SANITARY SEWER DESIGN AND CONSTRUCTION
FIGURE 5-12A. Plot of V
c
* and A/A
f
versus y/D.
Reproduced with permission from the McGraw-Hill Companies. Figure 4.11
page 124 in Terry W. Sturm, Open Channel Hydraulics, 2001.

requiring unnecessarily high actual velocities and unduly steep slopes at
shallower and shallower depths of flow. The Q
min
and design-particle
approach covered above addresses these shallower depths of flow more
accurately. The main result of using this alternate approach would be
increasingly steeper minimum slopes with increasing pipe sizes as com-
pared to the traditional minimum slopes based on full-pipe flow at 2 fps
(0.6 mps).
5.6.3. Observations on the Tractive Force Relationships
As shown in the figures above, when design minimum flow rates are
larger than about 0.04 cfs for 6-inch pipe (0.001 m
3
/s for 152-mm pipe),
0.06 cfs for 8-inch pipe (0.002 m
3
/s for 200-mm pipe), 0.12 cfs for 10-inch
pipe (0.003 m
3
/s for 254-mm pipe), and so forth, the required S
min
values
will be increasingly smaller than traditional minimum slopes; the curves
start at 0.10 y/D values and end with 0.50 y/D (half-full) values. Note that a
substantial Q
min
range for each pipe size requires steeper slopes than the
traditional values for full-pipe, 2-fps (0.6-mps) velocity. The curves are not
extended below 0.10 relative depths, since flow rates are relatively so small
and flow equation accuracy so uncertain that the results are misleading. In
such situations, the pipe should be placed as steep as is feasible, preferably
as steep as indicated for 0.10 full point; the reach should be flagged; and the
pipe cleaned more frequently if planned monitoring indicates it is needed.
Additional important observations from the tractive force approach
and Figs. 5-9 through 5-12 include:
• If a larger pipe is selected in order to gain a smaller minimum slope
according to a code, the self-cleansing situation is actually worse
than if a smaller size were used at the larger pipe’s minimum slope.
For example, for Q
min
0.06 cfs, an 8-inch-diameter pipe would
require a 0.004 slope for self-cleansing, whereas a 10-inch-diameter
pipe would need an ⬃0.006 slope rather than the 0.0028 minimum
slope required by the code. Based on Eq. (5-32), the 10-inch-diameter
pipe would only carry a 0.3-mm design sand particle at the 0.0028
slope when the flow is 0.06 cfs, whereas an 8-inch-diameter pipe at
the same slope and flow rate would handle a 1-mm particle.
• S
min
values are quite sensitive to changes in Q
min
, especially for the
smaller diameters and lower flow rates. This fact highlights the need
to establish the best possible estimates for Q
min
so that the S
min
values
selected are likewise appropriate.
• Relatively speaking, traditional minimum slopes for larger diame-
ters do not self-cleanse as well as those for smaller diameters. As
observed above, Yao (1974) and Merritt (1998) have also shown that
the use of the same full-pipe, minimum-velocity criterion for all
HYDRAULICS OF SEWERS 151

sizes often results in slopes steeper than needed for small-diameter
pipes and slopes flatter than needed for larger ones.
• An incidental observation is that one of the main motivations for
the use of egg-shaped sewers, or other type of narrowed cross sec-
tion at the bottom, is that the hydraulic radius stays relatively
larger with decreasing flow rates. Therefore, such shapes self-
cleanse better at low flows than does a circular conduit with the
same total cross-section area and design minimum flow rate.
5.7. HYDRAULIC CONTINUITY THROUGH MANHOLES
Flow through new manholes should be designed to pass through
smoothly to minimize turbulence and energy loss. Changes in slope,
direction, diameter, and multiple tributaries often combine to require a
drop into the outflowing pipe invert elevation in order to maintain a
smooth energy line and water surface through the manhole, and not
cause backup in tributary conduits. Figure 5-13 shows a schematic dia-
gram of entering and exiting pipes.
When the energy equation, Eq. (5-2), is applied from an inflowing con-
duit to the outflowing conduit, the result is Eq. (5-34), which gives the
necessary continuity drop, z, through the manhole:
(5-34)
where y
1
and y
2
are normal depths of flow in the conduits. Hydraulics
programs, which can be used to quickly calculate normal depths and
zyy
V
g
V
g
h
L
()
21
2
2
1
2
22
+
⎛
⎝
⎜
⎞
⎠
⎟
152 GRAVITY SANITARY SEWER DESIGN AND CONSTRUCTION
FIGURE 5-13. Hydraulic continuity through a manhole.

velocity heads, facilitate calculations for circular conduits that are quite
laborious if done by hand.
If two or more tributary conduits join at the same manhole, then each
one should be analyzed separately and the lowest calculated elevation for
the exit invert should be used. This continuity analysis should be done for
design capacity flow rates since these largest flow rates are most likely to
cause backup into entering conduits. The setting most likely to require
fairly large drops (sometimes exceeding a foot) is a manhole with two or
three joining tributaries and/or a transition from steep to flat slopes. Most
drops are fairly small [usually less than 0.10 ft (3 cm)] and rises are not
allowed because of possible grit accumulation in the depression.
Some codes and guidelines call for routine manhole drops of some 0.10
to 0.30 ft (3 to 9 cm), usually as a function of the number of inflowing
tributaries. Continuity calculations using Eq. (5-34) usually result in signif-
icantly smaller values, but sometimes these values are larger. Using arbi-
trary drops when not needed hydraulically is of negligible concern when
terrain is relatively steep and sewers are near minimum depth; however, in
relatively flat terrain unnecessary drops sometimes force sewers much
deeper than needed because the unneeded drops accumulate downstream.
Manhole head losses are reviewed below. For curved and streamlined
manhole channels, flow through manholes experiences very small head
losses, typically less than 0.02 ft (0.6 cm). When flow depths are consider-
ably greater than about half-full for design capacity flow rates, flows may
begin overtopping their manhole channels and larger head losses occur.
However, this is usually of little concern and significantly larger drops are
not justified, since these high flows are of short duration—just for a few
minutes or so during the highest flows of the diurnal cycle. When non-
streamlined manholes are used, more detailed techniques should be used
to determine manhole head losses. See, for example, Haestad et al. (2004).
If manhole drops are not needed for continuity reasons and head losses
are negligible, it may still be prudent to use a drop through manholes of
about 0.05 ft (1.5 cm), both to accommodate some small head loss and to
act as a construction tolerance so that slight horizontal misalignment of
the manhole will not result in an outlet at a higher elevation than the low-
est inlet. Even then such drops are not needed when the sewer is, and is
very likely to remain, essentially a flow-through pipe at the manhole.
5.8. HEAD LOSS IN MANHOLES
Local energy losses are often estimated using Eq. (5-35) or (5-36):
(5-35)
hK
V
g
L
2
2
2
HYDRAULICS OF SEWERS 153

or
(5-36)
For contoured flow-through manholes where each inflow is guided
through channels cast into the manhole base, head loss is very small—
typically less than 0.02 ft (0.6 cm). When nonstreamlined manholes are
used, a more detailed evaluation is needed to estimate the head loss (see
Haestad et al. 2004). As a worst-case scenario, the upper bound on a head
loss estimate would assume a total loss of the incoming kinetic energy;
therefore, the downstream kinetic energy must come from potential
energy (depth and/or elevation drop), written as (y z) V
2
/2g. This
represents a change of only 0.06 ft for 2 fps and 0.14 ft for 3 fps; however,
since this change is proportional to V
2
, it increases rapidly with higher
velocities to about 1 ft for 8 fps.
5.9. WATER SURFACE PROFILES
Non-uniform flow (varying depth with distance) in open channels can
be categorized as gradually varied flow (GVF) or rapidly varied flow (RVF).
GVF is used to calculate water surface profiles for a conduit. For GVF,
slopes of the energy line and water surface are curved and not parallel.
Before the advent of digital computers, great emphasis was placed on var-
ious mathematical integration techniques for water surface dy/dx relation-
ships. With modern computers, finite step methods are used with ease,
which (for relatively small y) steps closely approximate integration of
the differential equation describing the water surface curvature. One
common form of the GVF equation is given in Eq. (5-37).
(5-37)
where E is the specific energy for selected depths y
1
and y
2
along a chan-
nel, and S
–
is the average energy line slope between the two y depths,
which will be a calculated distance x apart.
A selected flow friction equation, such as the Manning equation, is
used to calculate the S
–
value, either by averaging the two S values calcu-
lated at the ends of the section as if they were each uniform flow or, more
commonly, by using average areas, hydraulic radii, and velocities to cal-
culate S
–
. When increasingly smaller y increments are used in the calcula-
tion, the two approaches converge. The answers are only slightly different
for fairly large y increments.
x
EE
SS
12
0
hK
V
g
L
()
2
2
154 GRAVITY SANITARY SEWER DESIGN AND CONSTRUCTION

Water surface profiles for GVF are classified relative to critical depth,
y
c,
and the normal depth, y
n
, from the uniform flow equation used. Each
channel section is given an alpha code based on its uniform flow regime:
Mild (M) if subcritical; Critical (C) if at critical (a singular point); Steep (S)
if supercritical; and Horizontal (H) or Adverse (A) if the bottom slope is
negative. The second identifier is one of three zones based on the actual
water depth in the section. Zone 1 is where actual water depth is above
both critical and normal depths. Zone 2 is where actual water depth is
between critical and normal depths. Zone 3 is below both. Essentially all
textbooks and hydraulics reference books have diagrams showing the
shapes of all possible GVF surface profiles.
To calculate profiles, one must start at a point of known water depth as
the initial y
1
. This point is referred to as a control point (CP). If the actual
water depth at the CP is shallower than the critical depth, the curve will
proceed downstream. If the actual water depth at the CP is deeper than
the critical depth, the curve will go back upstream.
The most common profiles of consequence in sewer conduits are M1,
where the water depth downstream is greater than normal depth and the
M1 curve goes back upstream to join the normal depth asymptotically;
M2, where the flow in the conduit is subcritical and depth downstream is
lower than the normal depth, such as discharging into a tank or pond that
is lower; and S1, where conditions are essentially the same as for the M1
curve above except the conduit is steep and the S1 curve goes back
upstream to where a hydraulic jump occurs to join the curve. In this latter
case, the depth of the S1 curve is the sequent depth to the upstream super-
critical depth coming into the jump. Since in sewer conduits velocities
along M1 and S1 reaches are quite low, M1 and S1 curves are essentially
horizontal lines back upstream from the control point of known depth. In
many cases M2 curves will draw down the surface considerably, with the
maximum drawdown being critical depth near the outlet of the pipe if the
depth at the end is at or below critical depth.
5.10. SERVICE LATERAL SLOPES
Minimum slopes for service laterals range from about 0.0075 (0.75%) to
0.02 (2%). When placed and bedded precisely and carefully, a 0.0075 slope
is acceptable when 2- to 4-gal (7.5- to 15-L) flush toilets are used in the
building or when larger buildings or several buildings are connected to
the lateral. A larger minimum slope value of up to 0.010 is recommended
where low-flush toilets [0.5 to 2 gal per flush (2 to 7.5 L)] are used. Larger
minimum slopes up to 0.02 are recommended where adequate construc-
tion inspection is not planned or conducted. Tractive force principles
show that smaller pipes self-cleanse better than larger pipes. However,
HYDRAULICS OF SEWERS 155

3- or 4-inch- (76- to 102-mm)-diameter pipes are likely the smallest feasi-
ble sizes for other reasons. Maintenance equipment limitations might
result in a 6-inch (152-mm) minimum diameter conduit in some cases. If
larger lateral pipes [greater than 6-inch- (152-mm)-diameter] are used, it is
suggested that slopes perhaps 50% larger be used for each of the situa-
tions stated above if the lateral does not service at least several buildings.
The main issue in the hydraulic design of service laterals is the mini-
mum slope necessary to achieve self-cleansing. Since street sewer depth
is often determined by depths necessary for gravity flow in service later-
als from buildings and other facilities, shallower street sewers are possi-
ble, relatively speaking, when these controlling laterals are shallower.
Substantial cost savings might also be gained from relatively shallower
placement of laterals themselves as allowed by flatter minimum lateral
slopes. The hydraulics of flow in laterals is more difficult to address since
it is unsteady, non-uniform flow. Such flow can be stated mathemati-
cally, but large variations in daily peak flow from service to service and
the use level, and flows in facilities served are subject to relatively unpre-
dictable, major changes over time. Rarely is capacity a concern, since
sizes smaller than 4 inches (102 mm) in diameter are seldom used. For
perspective: A 4-inch- (12-mm)-diameter line placed at 0.0075 slope
would have the capacity to handle peak flow from about 50 houses—
based on four people per house, 100 gpcd (gallons per capita per day)
(375 Lpcd) (liters per capita per day), and a peaking factor of about 6.
5.11. PARTIAL LISTING OF CURRENT SEWER
ANALYSIS/DESIGN SOFTWARE
Table 5-7 contains a partial listing of currently available software. Zao
(2001) focuses on public domain U.S. models and a few related propri-
etary models. Stein and Young (2001) discuss HYDRA, a storm and sani-
tary design and analysis software that is part of the HYDRAIN package
supported by the U.S. Federal Highway Administration. Yen (1999) gives
further details on the Storm Water Management Model (SWMM) originally
supported by the EPA.
APPENDIX
5.A.1. Critical Velocity/Critical Stress
The threshold of sediment movement is usually defined in terms of a
critical erosion velocity or a critical shear stress. For full-pipe design for
an 8-inch- (200-mm)-diameter pipe, a full-pipe critical velocity of 2 ft/s
(0.6 m/s) gives a shear stress of about 0.042 lb/ft
2
(2N/m
2
). To achieve
this value in larger diameters, the full-pipe velocity is increasingly larger,
156 GRAVITY SANITARY SEWER DESIGN AND CONSTRUCTION

TABLE 5-7. Sewer Analysis Software
a
Multiple
Model Hydraulic Sediment Sediment Pollutant Bedload
Name Solution Routing Level Time Domain Buildup Fractions Transport Transport Source
(continued)
EPANoNoNoNoContinuous
and Single
Events
Channels, Pipes,
Junctions,
Pump Stations;
Outfall structures,
Backwater
surcharge
FullSWMM
EXTRAN
Block
EPANoCompletely
mixed reactor,
First-order
decay (in
storage)
NoRoutes pollutants
generated by
runoff through
sewer system
Continuous
and Single
Events
Channels, Pipes,
Junctions,
Pump Stations;
Outfall structures,
Infiltration;
No backwater
No surcharge
Simplified;
Kinematic wave
SWMM
TRANSPORT
Block
EPANoFirst-order
washoff
NoLinear and
nonlinear
buildup and
washoff
Soil loss;
Rating curve
Continuous
and Single
Events
Gutters
Pipes
Simplified;
Nonlinear
reservoir
SWMM
RUNOFF
Block

TABLE 5-7. (Continued)
Multiple
Model Hydraulic Sediment Sediment Pollutant Bedload
Name Solution RoutingLevel Time Domain Buildup Fractions Transport Transport Source
a
HYDROWORKS and MOUSE are commercial software. They were developed in Europe and have been used in the United States for some time. Their
listing does not imply endorsement. A number of commercially available software provide input interfaces that allow direct input into SWMM from GIS
data and provide output interfaces with excellent graphics for reporting. Among these one may cite (without endorsement): SEWERCAD from Haestad
(Waterbury, Conn.), PCSWMM from CHI (Guelph, Ontario, Canada), MIKE SWMM from DHI (Trevose, Penn.), XPSWMM from XP Software (Portland,
Ore.) and HYDRA from Pizer (Seattle, Wash.).
DHI,
Denmark
YesYesYesFullMOUSE/
MOUSETRAP
Wallingford,
UK
Total load2FullHYDRO-
WORKS
FHWANoNoNoNoSingle EventSewers, grade, curb,
slotted inlets
Simplified/fullHYDRAIN/
HYDRA
EPA
USGS
NoCompletely
mixed
NoLinear buildup
and washoff;
Soil loss
Continuous
and Single
Events
Simple storage and
Channel routing
SimplifiedHSPF
COENoSix pollutants
Mass balance
NoLinear buildup
and washoff;
Soil loss
Continuous
and Single
Events
Dry-weather
flow
Simple storage;
Storage/
Treatment
SimplifiedSTORM

HYDRAULICS OF SEWERS 159
increasing to 3.0 fps (0.9 mps) for a 60-inch- (1,500-mm)-diameter pipe.
Because of the organic nature of the particles and the presence of organic
slimes and grease, sanitary sediments—particularly old deposits—may
exhibit a cohesivelike strength. Incipient movement shear stresses of
2.5 N/m
2
have been observed in synthetic surficial material and 6 to 7
N/m
2
in granular consolidated deposits (Ashley and Verbanck 1996).
However, once the cohesive structure is disrupted, the stripped particles
are transported as noncohesive sediments (Nalluri and Alvarez 1992).
Once the boundary shear stress exceeds the critical shear stress, the
particles are entrained and transported in suspension or as bedload. Sani-
tary solids are normally transported in suspension, with the larger grit
being transported as bedload.
Table 5-8 lists the minimum shear stress values from several countries.
5.A.2. A UK Approach to Self-Cleansing Sewer Design
In the UK, CIRIA developed a methodology for the design of self-
cleansing sewers based on sediment transport principles (Ackers et al.
1996). Summaries of the procedure can be found in Butler et al. (2003);
Butler et al. (1996a; 1996b); Delleur (2001); and Arthur et al. (1999). The
following is based on Butler et al. (2003) focusing on sanitary sewers.
The CIRIA study indicates that for self-cleaning performance over a
full range of sediment bed conditions, sewers should be designed so that
each pipe satisfies the following three design criteria:
1. Transport a minimum concentration of suspended particles.
2. Transport the coarser, inorganic grit material as bedload at a rate suffi-
cient to limit the depth of deposition to a specified proportion of the
diameter.
TABLE 5-8. Minimum Shear Stress Criteria
Minimum
Shear Stress, Pipe
Reference Country Sewer Type N/m
2
Conditions
Yao (1974) United States Sanitary 1.0–2.0 Full
Storm 3.0–4.0
Maguire (cited in UK Sanitary 6.2 Full
Nalluri and
Ghani, 1996)
Bischop (1976; Germany Sanitary 2.5 Full
cited in Nalluri
and Ghani, 1996)
Adapted from Nalluri, C., and Ghani, A. A. (1996). “Design options for self-cleansing storm
sewers.” Water Sci. & Tech., 33(9), with permission.

160 GRAVITY SANITARY SEWER DESIGN AND CONSTRUCTION
3. Erode cohesive particles from the deposited bed. This typically
requires a bed shear stress 2.0 N/m
2
, assuming a particle size of 1 mm
and an effective roughness of 1.2 mm.
The design procedure considers the hydraulic roughness of the sedi-
ment bed as related to sediment particle size and sediment movement as
related to flow velocity and roughness. The methodology is complex.
Potential users should refer to the references cited above. However, mini-
mum design velocities for high and medium solids concentration in sani-
tary sewers (SaH and SaM, respectively) were obtained using a simplified
procedure and standard values. The result is shown in Fig. 5-14. This fig-
ure is a general guide, not intended as a design tool.
Figure 5-14 also illustrates the three design criteria in terms of the
required full-pipe velocities. The curve labeled Sa-H corresponds to crite-
rion 1, the bottom curve Sa-M corresponds to criterion 3, and the remain-
ing curves correspond to criterion 2. In general, smaller pipe design will
be based on criterion 3, whereas larger pipes will be designed according
to criteria 1 or 2.
FIGURE 5-14. British CIRIA minimum full-pipe design velocities—by simpli-
fied construction industry research and information procedure.
Sewer types: Sa, sanitary; St, storm. Sediment loads: M, medium; H, high.
Deposition criteria: LOD, limit-of-deposition; 2%, allowable deposition depth.
Butler, D., May, R., and Ackers, J. (2003). “Self-cleansing sewer design based
on sediment transport principles.” J. Hyd. Engrg. (ASCE) 129(4), 276–282.

Comments on the CIRIA Approach
A shortcoming of the CIRIA figure approach in Fig. 5-14 is that it is an
envelope approach based on full-pipe velocities and, as such, does not
acknowledge actual design minimum flow rates, Q
min
. The net result is to
significantly increase all minimum slopes rather than just in those situa-
tions where very small Q
min
values actually occur. Since the CIRIA
approach does not allow flatter slopes when Q
min
values are relatively
large, one of the major benefits of the tractive force and Q
min
approach is
negated. The CIRIA approach results in many sewers being placed much
steeper than actually needed, unless one assumes that a cohesive, con-
gealed sediment bed must be eroded—this is the condition that self-
cleansing in a sanitary sewer is aimed at preventing, Steeper slopes means
deeper sewers and more pumping in many situations.
The SaM velocities in Fig. 5-14 result in a full-pipe tractive force of
about 0.045 lb/ft
2
(2 Pa) for all conduit sizes. Based on Eq. (5-32), this trac-
tive force value would move a design particle of about 20 mm in nominal
diameter. Assuming that a 1-mm particle is the actual design particle, the
slopes associated with the lower curve CIRIA velocities are steeper than
needed, unless at Q
min
a pipe flows less than about 15% full.
The SaH curve velocities have the same inherent problem as men-
tioned above. However, since the SaH curve applies only to larger-diame-
ter sewers, the significantly higher velocities are gained with fairly small
elevation changes. For example, a 60-inch- (1,500-mm)-diameter sewer
would need a slope of about 0.00045 to achieve 2 fps, but an increase up
to a slope of about 0.00080 to achieve the suggested full-pipe velocity of
3.8 fps. Although this about doubles the slope, it represents an increased
elevation change of only about 1.8 ft per mile—for comparison, based on
a 1-mm design particle, the tractive force approach herein would require
a slope of 0.00093 if the pipe flowed 10% full at its Q
min
, or 0.00048 for a
larger Q
min
at 20% full.
REFERENCES
Ackers, J. C., Butler, D., and May, R. W. P. (1996). “Design of sewers to control sed-
iment problems.” Construction Industry Research and Information Associa-
tion (CIRIA), Rep. No. R141, CIRIA, London.
American Society of Civil Engineers (ASCE). (1982). “Gravity sewer design and
construction.” ASCE Manual and Reports of Engineering Practice No. 60, ASCE,
Reston, Va.
Arthur, S. A. R., Tait, S., and Nalluri, C. (1999). “Sediment transport in sewers—A
step towards the design of sewers to control sediment problems.” Proc., Inst.
Civil Engrs., Water, Maritime and Energy, 136, 9–19.
HYDRAULICS OF SEWERS 161

Ashley, R. M., and Hvitved-Jacobsen, T. (2002). “Management of sewer sediments.”
Wet-weather flow in the urban watershed technology and management, R. Field and D.
Sullivan, eds, CRC Press/Lewis Publishers, Boca Raton, Fla.
Ashley, R. M., and Verbanck, M. A. (1996). “Mechanics of sewer sediment erosion
and transport.” J. Hyd. Res., 34(6), 753–770.
Butler, D., May, R. W. P., and Ackers, J. V. (1996a). “Sediment transport in sewers—
Part 1. Background.” Proc., Inst. Civil Engrs., Water, Maritime and Energy, 118,
103–112.
Butler D., May, R. W. P., and Ackers, J. C. (1996b). “Sediment transport in sewers—
Part 2.” Proc., Inst. Civil Engrs., Water, Maritime and Energy, 118, 113–120.
Butler, D., May, R., and Ackers, J. (2003). “Self-cleansing sewer design based on
sediment transport principles.” J. Hyd. Engrg. (ASCE), 129(4), 276–282.
Camp, T. R. (1946). “Design of sewers to facilitate flow.” Sewage Works J., 18, 3.
Chow, V. T. (1959). Open channel hydraulics, McGraw-Hill, New York.
Colebrook, C. F. (1939). “Turbulent flow in pipes with particular reference to the
transition region between the smooth and rough pipe laws.” J. Inst. Civil Engrs.,
London, 11, 133–156.
Cunge, J. A., and Wegner, M. (1964). “Intégration Numérique des Équations
d’Ecoulement de Barré de Saint Venant par un Schéma Implicite de Différences
Finies: Application au Cas d’une Galerie Tantôt en Charge, Tantôt à Surface
Libre.” [“Numerical integration of the St. Venant flow equations by an implicit
finite difference scheme: Application to the case of a conduit sometimes pres-
surized, sometimes with free surface.”] La Houille Blanche, 1, 33–39.
Delleur, J. W. (2001). “Sediment movement in drainage systems.” Stormwater collec-
tion systems handbook, L. W. Mays, ed., McGraw-Hill, New York, 14.1–14.25.
Haestad, M., Walski, T. M., Barnard, T. E., Harold, E., Merritt, L. B., Walker, N.,
and Whitman, B. E. (2004). Wastewater collection system modeling and design,
Haestad Press, Waterbury, Conn.
Hager, W. H. (1999). Wastewater hydraulics, Springer-Verlag, Berlin.
Lansey, K., and El-Shorbagy, W. (2001). “Design of pumps and pump facilities.”
Stormwater collection systems design handbook, L. W. Mays, ed., McGraw-Hill,
New York, Table 12.1.
Martin, G. S. (1999). “Hydraulic transient design for pipeline systems.” Hydraulic
design handbook, L. W. Mays, ed., McGraw-Hill, New York.
May, D. K. (1986). A study of Manning’s coefficient for commercial concrete and plastic
pipes, T. Bench Hydraulics Laboratory, University of Alberta, Edmonton,
Alberta, Canada.
Medina, L. R., and Vega, F. A. (2002). “Diseño de colectores de alcantarillado apli-
cando el criterio de tension tractriz.” [“Sewer collector design applying the
tractive force criterion.”] Ingenieria Hidraulica y Ambiental, 23(1), 50–55.
Merritt, L. B. (1998). “Manning roughness coefficient in sewer design.” Sewer
Design Paper No. 98-2, Brigham Young University, Provo, Utah.
Metcalf & Eddy, Inc. (2003). Wastewater engineering: Treatment and reuse, fourth ed.,
revised by G. Tchobanoglous, F. L. Burton, and H. D. Stensel, McGraw-Hill,
New York.
Moody, L. F. (1944). Transactions ASME, 66, American Society of Mechanical Engi-
neers (ASME), New York.
162 GRAVITY SANITARY SEWER DESIGN AND CONSTRUCTION

Nalluri, C., and Alvarez, E. M. (1992). “The influence of cohesion on sediment
behaviour.” Water Sci. & Tech., 25(8), 151–164.
Nalluri, C., and Ghani, A. A. (1996). “Design options for self-cleansing storm sew-
ers.” Water Sci. & Tech., 33(9), 215–220.
Ota, J., and Nalluri, C. (2003). “Urban storm sewer design: Approach in consider-
ation of sediments.” J. Hyd. Engrg. (ASCE), 129(4), 291–297. Discussion and clo-
sure: July, 2004, 718–721.
Raths, C. W., and McCauley, R. R. (1962). “Deposition in a sanitary sewer.” Water
and Sewage Works, 192–197.
Schmidt, O. J. (1959). “Measurements of Manning’s coefficient.” Sewage and Indus-
trial Waste, 31(9), 995.
Stein, S., and Young, K. (2001). “Storm drain design and analysis using HYDRA.”
Stormwater collection systems design and analysis handbook, L. Mays, ed., McGraw-
Hill, New York.
Straub, L. G., Bowers, C. E., and Puch, M. (1960). “Resistance to flow in two types
of concrete pipes.” Tech. Paper No. 22, Series B, St. Anthony Falls Hydraulic
Laboratory, University of Minnesota, Minneapolis, Minn.
Sturm, T. W. (2001). Open channel hydraulics, McGraw-Hill, New York.
Swamee, P. K., and Jain, A. K. (1976). “Explicit equations for pipe-flow problems.”
J. Hyd. Div. (ASCE), 102(HY5),657–664.
Tchobanoglous, G., Burton, F. L., and Stensel, D. (2003). Wastewater engineering:
Treatment and reuse, fourth ed., McGraw-Hill New York.
Tullis, J. P. (1986). “Friction factor tests on concrete pipes.” Hydraulic Rep. No. 157,
Water Research Laboratory, Utah State University, Logan, Utah.
Yao, K. M. (1974). “Sewer line design based on critical shear stress.” J. Env. Engrg.,
100(EE2), 507-520.
Yen, B. C., ed. (1992a). Channel flow resistance: Centennial of Manning’s formula,
Water Resources Publications, Littleton, Colo.
Yen, B. C. (1992b). “Dimensionally homogeneous Manning’s formula.” J. Hyd.
Engrg. (ASCE), 118(9), 1326–1332.
Yen, B. C. (1999). “Hydraulic design of urban drainage systems.” Hydraulic design
handbook, L. Mays, ed., McGraw-Hill, New York.
Yen, B. C. (2001). “Hydraulics of sewer systems.” Stormwater collection systems
design handbook, L. W. Mays ed., McGraw-Hill, New York.
Zhao, B. (2001). “Computer models for stormwater systems design.” Stormwater
collection systems design handbook, L. W. Mays, ed., McGraw-Hill, New York.
HYDRAULICS OF SEWERS 163
This page intentionally left blank

6.1. INTRODUCTION
The design of sanitary sewers requires the engineer to meet multiple
objectives simultaneously. Sanitary sewers transporting wastewater
from one location to another must be installed deep enough below the
ground surface to receive flows from the tributary area. However, exces-
sive depths increase construction costs. The pipe material used must
exhibit characteristics of resistance to corrosion and structural strength
sufficient to carry earth backfill load and any impact and live loads. The
size and slope or gradient of the sanitary sewer must be adequate for the
flow rate to be carried with a cleansing power sufficient to inhibit depo-
sition of solids, thereby being self-cleansing. The type of sewer pipe
selected should be made based on consideration of the characteristics of
the wastewater being transported and installation conditions. Man-
holes, junction chambers, and other structures should minimize turbu-
lence and head loss and prevent deposition of solids. Anticipated service
life, economy of maintenance, safety to personnel and the public, and
convenience for connection during the useful life of the sewer must be
considered.
The objective of design is to provide a sewer system at the lowest
annual cost compatible with its function, while providing sufficient dura-
bility for the design period. The construction cost is usually proportional
to the degree of complexity of the system. Therefore, each of these factors
must be weighed and evaluated together with the owner’s priorities.
CHAPTER 6
DESIGN OF SANITARY SEWER SYSTEMS
165

6.2. ENERGY CONCEPTS OF SEWER SYSTEMS
A gravity sanitary sewer system provides a means of transportation for
wastewater that utilizes the potential energy resulting from the difference
in elevation of its upstream and downstream ends. Energy losses due to
free falls, sharp bends, or turbulent junctions must be held to a minimum
if the sewer is to operate properly at a minimum slope and depth, unless
the system serves an area with a relatively steep general gradient where
more than adequate energy is available.
Generally, the total available potential energy is utilized to maintain
proper flow velocities in the sewers with minimum hydraulic head loss.
Chapter 5 deals with the energy concept in the design of sanitary sewers
and provides design guidelines for many of the situations typically
encountered.
Where excess elevation differences exist, it may become necessary to
dissipate excess potential energy. Where the differences in elevation are
insufficient to permit gravity flow, external energy must be added to the
system by pumps. Although pumps are often necessary, they add an
additional degree of complexity and cost to the design. The consequences
of a sanitary sewer overflow due to mechanical or electrical failure in a
pumping station must be considered. If a pumping station outage would
result in pollution of a waterbody or in any way affect the health and
safety of a community, the higher cost of a gravity system may be justi-
fied. Other consequences may include enforcement action by state or fed-
eral agencies due to the overflow.
6.3. COMBINED VERSUS SEPARATE SEWERS
Many existing sewer systems collect both wastewater and stormwater.
In such systems, stormwater, up to a design limit, is channeled with sani-
tary wastewater to the treatment plant. When combined flows exceed the
sewer’s capacity, combined sewer overflows (CSOs) occur and waste-
water, along with stormwater, is discharged to receiving waters. When
stormwater is transported with wastewater to the treatment plant, pump-
ing and treatment costs are increased and treatment problems may occur.
Combined sewer systems are no longer designed except as limited exten-
sions or replacements for existing combined systems.
Studies by the U.S. Public Health Service (USPHS 1964) and the U.S.
Environmental Protection Agency (EPA 1970) show that combined
stormwater and wastewater overflows introduce large quantities of pollut-
ing materials into the nation’s waters. As a result of these issues and other
concerns, the EPA in 1994 adopted a CSO control policy (EPA 1994). This
policy includes minimum controls that sharply limit the use of combined
sewer systems and essentially preclude their use in new construction.
166 GRAVITY SANITARY SEWER DESIGN AND CONSTRUCTION

6.4. LAYOUT OF SYSTEM
The design engineer begins a sanitary sewer system layout by selecting
an outlet, determining the tributary area, locating trunk and main sewers,
and determining the need for and location of pumping stations and force
mains (NTIS 1977). The outlet is located according to the circumstances of
the particular project. Thus, a system may discharge to a treatment plant,
a pumping station, or a trunk or main sanitary sewer.
Preliminary layouts can be made largely from topographic maps and
other pertinent information. In general, sanitary sewers will have a gra-
dient in the same direction as street or ground surfaces and will be con-
nected by trunk or main sewers. Some considerations which may affect
the exact location are other existing utilities, traffic conditions, the type
and extent of pavement encountered, and the availability of rights-of-
way (ROWs).
Sewer system drainage district boundaries usually conform to water-
shed or drainage basin areas, with ridgelines, or high points, separating
the areas. It is desirable to have drainage area boundaries follow property
lines so that any single lot or property is tributary to a single system. This
is particularly important when assessments for sewer connections are
made against property served. The boundaries of subdistricts within an
assessment district may be fixed on the basis of topography, economy of
sanitary sewer layout, or other practical considerations.
Trunk, main, and intercepting sanitary sewers are located at the lower
elevations in a given area. Not all sewer systems will have trunk or inter-
cepting sewers, with their prevalence being dependent upon topographi-
cal and construction limitations. The location of these sewers will depend,
similarly to the branch sewers, on available ROWs and the presence of
low-lying areas in which these sewers can be located.
Consideration should be given to future needs. Each part of the system,
as well as the entire system, should be designed to serve not only the pres-
ent tributary area but also be compatible with an overall plan to serve an
entire drainage area unless this is impractical for economic reasons.
Many states prohibit sanitary sewers within a certain radius of public
water supplies. When sanitary sewers are located close to public water
supplies, it is common practice to use pressure-type sewer pipe, concrete
encasement of the sewer pipe, or sewer pipe with joints which meet strin-
gent infiltration/exfiltration requirements. The so-called Ten-States Stan-
dards (GLUMRB 2004), as well as most building codes, prohibit sanitary
sewer installation in the same trench with water mains. The design engineer
should check local health and environmental regulations for site-specific
requirements. For example, some states have reduced the separation
requirements below the limits specified in the Ten-States Standards. In
the absence of other criteria, the Ten-States Standards require 10-ft (3-m)
horizontal separation, measured outside to outside between water mains
DESIGN OF SANITARY SEWER SYSTEMS 167

and sewer mains, or 18 inches (450 mm) of vertical separation, with the
water main above the sewer main.
Manholes should be located at the junctions of sanitary sewers and at
any change in grade, pipe size, or alignment, except in curved align-
ments (see Section 5). Also, manholes should be placed at locations that
provide ready access to the sewer for preventive maintenance and emer-
gency service. Typically, in the absence of other data, the manholes
should be spaced at distances not greater than 400 ft (120 m) for sewers
15 inches (375 mm) or less, and 500 ft (150 m) for sewers 18 to 30 inches
(450 to 750 mm), except that distances up to 600 ft (185 m) may be
acceptable where adequate modern cleaning equipment for such spac-
ing is provided. Greater spacing, up to 1,000 ft (300 m), may be accept-
able in larger sewers. Although longer distances may be acceptable, this
must be coordinated with the capabilities of the utility’s cleaning equip-
ment. In any situation, it is very important to consult with the utility’s
operational staff to ensure that the design provides proper access for
system maintenance.
On the other hand, manholes should not be located in any low area,
such as a swale or gutter, where there will be a concentrated flow of water
over the top that could cause excessive inflow. This may require a few
additional manholes to be constructed but it will enable the operating
agency to provide better service during the life of the sewer. Inaccessible
manholes are of little or no value to the operating agency. If manholes
must be constructed in these areas, careful attention must be paid to
design to ensure that the manholes are watertight and protected against
flotation.
Street intersections are common locations for manholes. When a man-
hole is not necessary for a present or future junction, it is better placed
outside the pavement of a street intersection, but within the street ROW,
to minimize issues during potential future road repairs and to provide
room for maintenance personnel.
A terminal manhole at the upper end of a sanitary sewer should be
placed in the street ROW so that the manhole and sewer are accessible for
maintenance and emergency service. Unless a sufficient access easement
is available, it should not be located inside the property line of the last
property served. Thus, for proper location of the terminal manhole, the
sewer should be extended to the street ROW if necessary.
Sanitary sewer manholes should not be located or constructed in a way
that allows surface water to enter. When this is not possible, watertight
manhole covers or interior liners should be specified. Interior liners can
be either nonmetallic or metallic, with metallic liners preferable in high-
traffic areas. Manholes not in the pavement, especially in open country,
should have their rims set above grade to avoid the inflow of stormwater
and to simplify field location.
168 GRAVITY SANITARY SEWER DESIGN AND CONSTRUCTION

Many communities require tees or wyes as part of new sewers when
they are constructed. When a sewer is constructed under a proposed
street, wye connections should be made with a stub extended beyond the
curb or edge of pavement line. If the sewer is located on one side of the
street, wyes should be installed and a stub extended across the street to
serve property on the other side to avoid tearing up the pavement when
the building service line is constructed. Connections to sanitary sewers
should be made only with an experienced crew using equipment specifi-
cally designed for tapping a sewer. Some cities provide this service with
their own staff and charge for each connection made. The authority to
make these connections should be carefully controlled so that only
authorized, experienced personnel make the connections.
The most common location of a sanitary sewer is at or near the center of
a street or alley. A single sanitary sewer then serves both sides of the street
with approximately the same length of house connection sewer. In an
exceptionally wide street, such as a boulevard, it may be more economical
to install a sanitary sewer on each side. In such a case, the sanitary sewer
may be located outside the curb, between the curb and the sidewalk or
ROW line, or under the sidewalk. Normally, sidewalk locations are used
only where other locations are not possible. Locating sanitary sewers
within the gutter area is least desirable because of the possibility of
stormwater inflow through manhole covers.
Sometimes a sanitary sewer must be located in an easement or ROW
(e.g., at back property lines) to serve parallel rows of houses and resi-
dential developments without alleys. Easements must be of sufficient
width to allow access for maintenance equipment and agreements must
provide the right of access for construction, inspection, maintenance,
and repair. Local ordinances should provide that all aboveground
obstructions belonging to other utilities, such as utility poles, gas
meters, and telephone junction boxes, be located as close as possible to
one edge of the easement, not in the center. They should also discourage
or prohibit, insofar as possible, the planting of trees and shrubs, the con-
struction of fences or retaining walls, or any other aboveground obstruc-
tion that would interfere with access to the entire length of the line. The
ordinances should indicate where these private obstructions may be
located within the easement and that they are placed there at the risk
and expense of the property owner. Replacement of the obstructions
that are removed to permit access should not be the responsibility of the
sewer utility.
Despite such provisions, access to sewer lines located along property
lines sometimes becomes difficult or impossible. Sewer maintenance
becomes irritating to both the property owners and the utility, and the
costs of maintenance may increase significantly. Sewer locations in streets
or other public properties are therefore greatly preferred.
DESIGN OF SANITARY SEWER SYSTEMS 169

6.5. CURVED SANITARY SEWERS
The design and installation of large-diameter sanitary sewers laid on
curves is a generally accepted practice in sanitary sewer design (FHA,
undated). Several benefits are derived from this type of installation: The
installation of curved sanitary sewers will result in economies over
straight-run sewers by eliminating manholes needed at each abrupt
change of direction. The installation of sanitary sewers parallel to or on
the centerline of a curved street makes it easier to avoid other utilities.
Such installations will allow manhole locations away from street inter-
sections. The design of curved main or trunk sanitary sewers allows the
engineer to follow topographic contours for the desired alignment and
simplifies the maintenance of a uniform gradient. Inspection and main-
tenance requirements generally determine minimum diameters of
curved sewers.
6.5.1. Rigid Pipe
The installation of rigid sewer pipe on a curve is accomplished by
deflecting the pipe joint from the normal straight position. The maximum
permissible deflection must be limited so that satisfactory pipe joint per-
formance is not affected. When rigid sewer pipe is installed on a curve, it
is advisable that the manufacturer of the sewer pipe be consulted and the
maximum allowable pipe joint deflection determined.
The radius of curvature that may be obtained by deflection of straight
sewer pipe is a function of the deflection angle per pipe joint (joint open-
ings), the diameter of the sewer pipe, and the length of the sewer pipe
sections.
The radius of curvature (R) is computed by the equation:
(6-1)
where
R radius of curvature, in ft (m)
L length of sewer pipe sections measured along centerline,
in ft (m)
total central (or deflection) angle of the curve, in degrees
(radians)
N number of sewer pipe sections
/N total central or deflection angle for each sewer pipe, in degrees
(radians).
R
L
N
2
1
2
tan
⎛
⎝
⎞
⎠
⎡
⎣
⎢
⎤
⎦
⎥
170 GRAVITY SANITARY SEWER DESIGN AND CONSTRUCTION

From Fig. 6-1, the angular deflection from the tangent of the circle,
1
⁄
2
(/N), is further defined as:
(6-2)
where Deflection joint opening, in ft (m) and B
c
outside sewer pipe
diameter, in ft (m).
Figure 6-2 shows sewer pipe installed on a curved alignment using
straight sewer pipe. As an alternate to deflecting the straight sewer pipe,
the desired radius of curvature may be based on the fabrication of radius
sewer pipe. Radius sewer pipe, also referred to as beveled or mitered
pipe, incorporates the deflection angle into the sewer pipe joint. The
sewer pipe is manufactured with one side of the pipe shortened. The
amount of shortening or drop is dependent on manufacturing feasibility.
1
22
1
N
Deflection
B
c
⎛
⎝
⎜
⎞
⎠
⎟
⎛
⎝
⎜
⎞
⎠
⎟
−
sin
DESIGN OF SANITARY SEWER SYSTEMS 171
FIGURE 6-1. Deflected straight sewer pipe. Source: “Feasibility of curved
alignment for residential sanitary sewers.” Federal Housing Administra-
tion Report 704, U.S. Government Printing Office, Washington, D.C.

With the possibility of greater deflection angles per joint, shorter radii can
be obtained with radius sewer pipe than with deflected straight sewer pipe.
The radius of curvature, which may be obtained with radius sewer
pipe, is a function of the deflection angle per joint, the diameter of the
sewer pipe, the length of sewer pipe section, and the wall thickness. It is
computed from the equation:
(6-3)
R
L
N
D
t
tan
⎛
⎝
⎞
⎠
⎛
⎝
⎜
⎞
⎠
⎟
2
172 GRAVITY SANITARY SEWER DESIGN AND CONSTRUCTION
FIGURE 6-2. Curved alignment using deflected straight sewer pipe. Source:
“Feasibility of curved alignment for residential sanitary sewers.” Federal
Housing Administration Report 704, U.S. Government Printing Office,
Washington, D.C.

where
R radius of curvature
total central or deflection angle of curve, in degrees (radians)
N number of radius sewer pipe sections
L standard sewer pipe length being used, in ft (m)
D inside diameter of sewer pipe, in ft (m)
t wall thickness of the sewer pipe, in ft (m).
From Fig. 6-3, the radius of curvature (R) can be expressed in terms of
the bevel and is given by the equation:
(6-4)
R
LD t
Drop
D
t
L
Drop
B
c
2
2
1
2
()
⎛
⎝
⎜
⎞
⎠
⎟
⎛
⎝
⎜
⎞
⎠
⎟
or
DESIGN OF SANITARY SEWER SYSTEMS 173
FIGURE 6-3. Radius sewer pipe. Source: “Feasibility of curved alignment
for residential sanitary sewers.” Federal Housing Administration Report
704, U.S. Government Printing Office, Washington, D.C.

where B
c
outside diameter of the pipe, in ft (m) and Drop length pipe
is shortened on one side, in ft (m).
It is essential to coordinate the design of curved sanitary sewers with the
radius pipe manufacturer. Figure 6-4 shows sewer pipe installed on a
curved alignment using radius sewer pipe. The minimum radius of curva-
ture obtained from Eqs. (6-1) and (6-3) is within a range of accuracy that
will enable the sewer pipe to be readily installed on the required alignment.
6.5.2. Flexible Pipe
The installation of flexible sewer pipe on a curve is accomplished by
controlled longitudinal bending of the pipe and deflection of the pipe joint.
174 GRAVITY SANITARY SEWER DESIGN AND CONSTRUCTION
FIGURE 6-4. Curved alignment using radius sewer pipe. Source: “Feasibility
of curved alignment for residential sanitary sewers.” Federal Housing
Administration Report 704, U.S. Government Printing Office, Washing-
ton, D.C.

It is recommended that any necessary deflection be obtained through axial
joint deflection. Permissible joint deflection may be significant when gas-
keted joints, which are designed for deflection, are provided on thermo-
plastic pipe. Solvent cement or fusion joints provide no flexibility.
When flexible sewer pipe must be installed on a curve, it is advisable
that the manufacturer of the pipe be consulted on the minimum radius of
bending. When considering the deflection of the pipe between joints, the
system can be analyzed based on available mathematical relationships for
longitudinal bending of pressurized tubes (Reinhart 1961; Reissner 1959).
One critical limit to bending of flexible pipe is long-term flexural stress.
The equation for allowable bending stress (S
b
) in pascals (lb/ft
2
) is:
(6-5)
where
HDB hydrostatic design basis of pipe, in lb/ft
2
(pascals)
F safety factor (2 is suggested for nonpressure pipe)
T temperature rating factor [1 at 73.4 °F (23 °C)].
Also to be considered is the mathematical relationship between stress and
moment induced by longitudinal bending of pipes:
(6-6)
where
M bending moment, in ft-lbs (n-m)
S
b
allowable bending stress, in lb/ft
2
(pascals)
c distance from extreme fiber to neutral axis OD (outside
diameter)/2, in ft (m)
I moment of inertia, in ft (m) to fourth power.
With reference to Fig. 6-5, and assuming that the bent length of pipe
conforms to a circular arc after backfilling and installation, the minimum
radius of the bending circle (R
b
) can be found by Timoshenko’s equation
(Timoshenko 1948):
(6-7)
where E Young’s modulus of elasticity, in lb/ft
2
(pascals). Combining
Eqs. (6-6) and (6-7) gives:
(6-8)
R
E
S
OD
b
b
2
()
R
EI
M
b
M
SI
c
b
S HDB
T
F
b
()
DESIGN OF SANITARY SEWER SYSTEMS 175

The central angle, , subtended by the length of pipe is:
(6-9)
where L and R
b
are both in the same units, and the angle of lateral
deflection [in degrees (radians)] of the curved pipe from a tangent to
the circle is:
(6-10)
with L pipe length, in ft (m). The offset at the end of the pipe from the
tangent to the circle, A, in ft (m), is:
(6-11)
Because of the characteristics of a particular joint design, it is possible that
a manufacturer’s recommended bending radius may be greater or lesser
than those calculated.
When change of direction in a flexible pipeline exceeds the permissible
bending deflection angle for a given length of pipe, a manhole should be
provided or, where allowable, an elbow should be used. If these options
AR R
bb
2
2
2
2
2
sin (sin )
⎛
⎝
⎜
⎞
⎠
⎟
2
360
2
57 3
R
L
R
L
bb
()
.
()
176 GRAVITY SANITARY SEWER DESIGN AND CONSTRUCTION
FIGURE 6-5. Flexible pipe allowable bend. Uni-Bel PVC Pipe Association.
2001. Handbook of PVC pipe: Design and construction, 4th ed. Dallas, Tex.
Courtesy of the Uni-Bel PVC Pipe Association.

are not available, and after consultation with the manufacturer, longitudi-
nal deflection may be a potential option.
6.6. TYPE OF CONDUIT
A variety of materials are available to the design engineer for use in
sanitary sewers. (A discussion of properties and applications of the differ-
ent sewer pipe materials is presented in Chapter 8.) The type of materials
a design engineer chooses to specify is dictated by several factors, along
with sound engineering judgment. These factors include the type of
wastewater to be transported (residential, industrial, or a combination of
both); the type of soil; trench load conditions; and the bedding and initial
backfill material available. (Information on structural design for both
rigid and flexible conduits is presented in Chapter 9.) There may also be
regional differences in design criteria and regulatory requirements, and
these should be considered in selecting a piping material.
6.7. VENTILATION
Forced ventilation of a sanitary sewer is generally considered a special
application used to solve a specific problem. In most cases, natural venti-
lation from manholes, building vents, and flow variations of the waste-
water is adequate to provide oxygen in the sanitary sewer atmosphere.
When forced ventilation is required, special airtight or pressure man-
hole covers must be used and the air exhausted to a high stack or to a
deodorizing process. The design requirements for forced ventilation are
specific to a particular sanitary sewer layout and design. They should not
be interpreted as minimizing in any way the need for gas detection and
ventilation before and during maintenance operations to eliminate any
possible danger to sanitary sewer workers.
6.8. DEPTH OF SANITARY SEWER
Sanitary sewers should be installed at such depths that they can receive
contributed flows from the tributary area by gravity flow. Deep basements
and buildings on land substantially below street level may require individ-
ual pumping facilities. Sufficient sanitary sewer depth must be provided to
prevent freezing and backflow of wastewater through connections.
No single method prevails for determining the minimum depth for a
sanitary sewer. One suggestion is that the top of the sanitary sewer
should not be less than 3 ft (1 m) below the basement floor of the building
DESIGN OF SANITARY SEWER SYSTEMS 177

to be served. Another rule places the invert of the sanitary sewer not less
than 6 ft (1.8 m) below the top of the house foundation. The latter assumes
that it is not necessary for a sanitary sewer to serve basement drains. It
also has the advantage of preventing the connection of exterior basement
wall footing drains to the sanitary sewer. This, however, is acceptable
only where basements are uncommon, where few basements have sani-
tary facilities, or if basement sump pumps are utilized. Where houses
have no basements, sewers may be built at shallower depths, perhaps as
little as 4 ft (1.2 m) below the house foundation, resulting in significant
cost reductions. In business or commercial districts, however, it may be
necessary to lay sewers as deep as 12 ft (3.6 m) or more to accommodate
the underground facilities in such areas.
It is typical to lay house connections at a slope of 2%, with a minimum
slope of 1%. In some developments in which houses are set well back from
the street, the length and slope of the house connection may determine min-
imum sewer depths. In some cases, it may not be economically justifiable to
lower the whole sewer system to provide service for only a few houses.
Because sewers usually are laid in public streets or easements, consider-
ation must be given in design to the prevention of undue interference with
other underground structures and utilities. The depth of the sanitary
sewer is usually located such that it can pass under all other utilities, with
the possible exception of storm sewers. Also, it is necessary to ensure that
there is adequate clearance between both sewer mains and sewer service
laterals and water mains. Unless local environmental regulations state oth-
erwise, the Ten-States Standards require a minimum vertical separation of
18 inches (450 mm) between the outside of the water main and the outside
of the sewer line. This may necessitate lowering of the sanitary sewer.
When sewers are to be laid at shallow depths, consideration should be
given to live and impact loads since special requirements may be neces-
sary in the selection and installation of the pipe. (Structural requirements,
including these special cases, are discussed further in Chapter 9.)
6.9. FLOW VELOCITIES AND DESIGN DEPTHS OF FLOW
A sanitary sewer has two main functions: to convey the designed peak
discharge and to transport solids so that deposits are kept to a minimum.
It is essential, therefore, that the sanitary sewer has adequate capacity for
the peak flow and that it function at minimum flows without excessive
maintenance and generation of odors.
To meet these goals it has been customary to design sanitary sewers
with some reserve capacity. When capacity requirements determine the
sewer slope, often sanitary sewers through 15 inches (375 mm) in diame-
ter are designed to flow half-full. Larger sanitary sewers have been typi-
178 GRAVITY SANITARY SEWER DESIGN AND CONSTRUCTION

cally designed to flow three-quarters full. However, where allowed, engi-
neers are encouraged to strive for accurate peak flow estimation and
design for a full pipe when capacity determines the pipe slope.
Velocity determination is based on calculated peak flow. Chapter 3
provides guidance regarding calculating the average and peak flows for
sewer systems, both for the beginning of service and on the design day. It
should be noted that the Ten-States Standards provide a peaking factor
(PF) curve which calculates peaking factors as a function of population.
The equation utilized in the Ten-States Standards is:
(6-12)
where P is the population in thousands. The use of this equation may be
mandated by certain agencies, although peaking factors calculated from
this equation are considerably higher than those observed in modern sys-
tems (see Chapter 3). In addition, many communities have established
specific values for design peak flows.
Traditional standards dictate that the minimum full-pipe velocity
should not be less than 2 fps (0.60 mps) or generally greater than 10 fps
(3.5 mps) at peak flow. A velocity in excess of 10 fps (3.5 mps) can be tol-
erated with proper consideration of pipe material, abrasive characteristics
of the wastewater, turbulence, and thrust at changes of direction. The
minimum velocity requirement is necessary to prevent the deposition of
solids. The design engineer is urged to consider utilizing tractive force
design, as outlined in Chapter 5, to ensure that self-cleansing occurs. Spe-
cial attention must be given to conditions early in the life of each sewer
reach, as initial flows are normally substantially lower than design flows
and an adequate assessment of self-cleansing is crucial. When flat slopes
and very small minimum design flows are encountered, the design engi-
neer may elect to use a greater slope or the owner may desire to initiate a
more intensive, well-planned line cleaning maintenance program for
these reaches. Information on flow and velocities as they relate to hydro-
gen sulfide generation is presented in Chapter 4.
6.10. INFILTRATION/INFLOW
In many sanitary sewers, extraneous flow consisting of infiltration and
inflow (I/I) is a major cause of hydraulic overloading of both the collec-
tion system and treatment plant (Santry 1964; “Municipal Requirements
for Sewer Infiltration” 1965; Brown and Caldwell 1957). To handle this
excess flow it may become necessary to construct relief sanitary sewers
PF
P
P
18
4
DESIGN OF SANITARY SEWER SYSTEMS 179

and expand existing treatment facilities. These measures add to the cost of
the system. Other expenses incurred because of this unwanted flow
include:
• Higher pumping costs.
• Replacement costs for failed sanitary sewers and surface pavements
resulting from soil flushing into the sewer.
• Higher maintenance costs resulting from soil deposits in sanitary
sewers and root penetration into leaky joints.
I/I can contribute substantially to sewer flows. Inflow is often the result
of deliberately planned or expediently devised connections of stormwater
sources into sanitary sewer systems; unintentional stormwater sources
that result from structure design; or location or deterioration of sanitary
sewers. The inflow from such sources can be prevented or corrected by
regulation and inspection procedures aimed at enforcing regulations
relating to sanitary sewer connections. It is also important to design the
system to minimize potential inflow points. This can be accomplished
through careful location of manholes to minimize the potential of flood-
ing; use of waterproof covers or provision of manhole “diapers” to pre-
vent inflow through covers; and provisions for locking of both manhole
and cleanout covers to prevent their use as stormwater inlets.
Infiltration results from the age of the structure, soil conditions, materi-
als, and methods of construction. It must be taken into consideration in
the design, construction, and inspection of sanitary sewer systems. A
more detailed discussion of infiltration and related matters is found in
Chapter 3. Potential design solutions to minimize infiltration include the
use of proper piping and gasket materials (see Chapter 8); the proper seal-
ing of pipe entries into manholes; and the proper waterproofing of man-
holes. Chapter 7 discusses manholes and appurtenances and the steps
that can be taken to improve their performance.
6.11. INFILTRATION/EXFILTRATION AND
LOW-PRESSURE AIR TESTING
6.11.1. Infiltration/Exfiltration Test Allowance
The most effective way to control infiltration, and at the same time to
ensure structural quality and proper installation of the new sanitary
sewer, is to establish and enforce a maximum leakage limit as a condi-
tion of job acceptance. Limits may be stated in terms of water leakage
quantities and should include both a maximum allowable test section
rate and a maximum allowable system average rate. Current information
180 GRAVITY SANITARY SEWER DESIGN AND CONSTRUCTION

indicates that a maximum allowable infiltration rate of 50 to 100 gal/
inch-diameter/mi (5 to 10 L/m-diameter/km) of sewer pipe per day can
be achieved without additional construction costs. Some model state
laws (“Model Sewer Use Law” undated) limit infiltration to 25 gal/inch-
diameter/mi (2.5 L/m-diameter/km) of sewer pipe per day.
Manholes may be tested separately and independently. If this is done,
an allowance for manholes of 0.1 gal/hr/ft-diameter/ft-head (4 L/hr/m-
diameter/m-head) would be appropriate.
6.11.2. Infiltration/Exfiltration Testing
When groundwater is observed to be at least 4 ft (1.2 m) above the top
of the sewer pipe, the infiltration test will determine the integrity of the
sewer line. Any leakage can be measured with a V-notch weir or similar
flow measuring device. If no leakage is observed, it can be assumed that
the line passes the test.
If the groundwater level is not at least 4 ft (1.2 m) above the top of the
sewer pipe, then an exfiltration test is required. This is performed by
plugging the manhole at the lower end of the test section and filling the
line with water. In order to properly test a line, the elevation of water in
the line should be at least 2 ft (0.6 m) above the groundwater level. If leak-
age does not exceed the limits specified, then the section tested is
accepted. If leakage exceeds the limits specified, the leak must be located
and repaired.
6.11.3. Low-Pressure Air Testing
A low-pressure air test may also be used to detect leaks in sewer pipe
where hydrostatic testing is not practical (Uni-Bell 1998). Because of the
physical difference between air and water and the difference in behavior
under pressure conditions, the air test cannot be directly related to the
water test, although either test can be used with confidence to prove the
integrity of the sewer line. The air test depends on porosity, moisture con-
tent, and wall thickness of the sewer pipe. A well-constructed sanitary
sewer that is impervious to water may still have some air loss through the
sewer pipe wall. In applying low-pressure air testing to sanitary sewers
designed to carry fluid under gravity conditions, it is necessary to distin-
guish between air losses inherent in the type of sewer pipe material used
and those caused by damaged or defective pipe joints.
When testing polyvinyl chloride (PVC) pipe, the air test method rec-
ommended by Uni-Bell is the time pressure method. The line to be tested is
plugged and the pressure raised to a minimum of 4 psig (28 kPa) greater
pressure than the average back pressure of any groundwater. The pres-
sure is then allowed to stabilize for a minimum of two minutes. The air
DESIGN OF SANITARY SEWER SYSTEMS 181

supply is disconnected and the time required for the pressure to drop
from 3.5 psig (24 kPa) to 2.5 psig (17 kPa) is determined. Test procedures
and calculations are available from Uni-Bell. Ramseier’s work (Ramseier
and Rick 1964; Ramseier 1972) also should be considered in air testing.
For clay pipe, ASTM Standard C828 specifies a low-pressure test pro-
cedure that is designed specifically for vitrified clay pipe. The line to be
tested is plugged and the pressure raised to a minimum of 4 psig (28 kPa).
The pressure is then allowed to stabilize for two to five minutes. After the
pressure stabilizes, the air pressure should be reduced to 3.5 psig (24 kPa)
before starting the test. The air supply is disconnected and a timer started.
If the air pressure does not drop more than 1 psig (7 kPa) during the test
time (see Table 6-1), the line has passed.
In applying the low-pressure air test, the following factors should be
understood and precautions followed during the test. The air test is
intended to detect defects in the sewer line and establish the integrity of
the line under sewer conditions. Since the pipe will be in a moist environ-
ment when in service, testing the pipe in wet conditions is appropriate.
Plugs should be securely braced. Plugs should not be removed until all air
pressure in the test section has been reduced to ambient pressure.
For safety reasons, no one should be allowed in the trench or manhole
while the test is being conducted. The testing apparatus should be
equipped with a pressure relief device to prevent the possibility of load-
ing the test section with full compressor capacity.
Pipe that is large enough to permit personnel to conduct interior inspec-
tions can be accepted on the basis of such inspection, plus air testing of
individual joints, if required. When individual joints are tested, allowable
leakage is usually the computed rate per foot (meter) of pipe times the dis-
tance between joints. In practice, however, it is a go/no-go test.
182 GRAVITY SANITARY SEWER DESIGN AND CONSTRUCTION
TABLE 6-1. Minimum Test Time for Various Pipe Diameters
Nominal Pipe Size, T (time), Nominal Pipe Size, T (time),
inch (mm) Min/100 ft inch (mm) Min/100 ft
4 (100) 0.3 24 (600) 3.6
6 (150) 0.7 27 (675) 4.2
8 (200) 1.2 30 (750) 4.8
10 (250) 1.5 33 (825) 5.4
12 (300) 1.8 36 (900) 6.0
15 (375) 2.1 42 (1,050) 7.3
18 (450) 2.4 48 (1,200) 8.5
21 (525) 3.0

6.12. DESIGN FOR VARIOUS CONDITIONS
6.12.1. Open Cut
The load on a sanitary sewer built in open cut is a function of the bed-
ding, trench width, backfill material, and any superimposed loads. Con-
sideration must be given to all of these elements. Backfill material placed
12 to 24 inches (0.3 to 0.6 m) over the top of the sewer pipe should be free
of rocks or stones larger than 2 inches (50 mm) in diameter to avoid dam-
age to the sewer pipe. Chapter 9, devoted to loads on sewer pipe, presents
details of this phase of design.
6.12.2. Microtunneling
Microtunneling uses a steerable head and a jacking system to directly
install lines as small as 6 inches (150 mm). The advantage of micro-
tunneling is that it brings the benefits of trenchless construction while
providing the accuracy necessary for construction of gravity sanitary
sewers. This construction method should be considered for installations
in areas where surface disruptions are either unacceptable or very costly,
as the construction cost for microtunneling is significantly higher than
open-cut methods. This construction method is described in greater
detail in Chapter 12.
6.12.3. Directional Drilling
In directional drilling, a guided bore is made and a carrier pipe is
pulled into location. Directional bores have been widely used for the
installation of pressure pipes where grade is not critical. However, until
very recently it was impossible to make an installation with sufficient
accuracy to meet gravity sewer requirements. With the refinement of
guidance methods, this has become feasible. Directional drilling is a
trenchless method and should be considered where surface disruptions
would be unacceptable. Although it is more costly than open-cut installa-
tion methods, it is more cost-effective than microtunneling in smaller
sizes. Additional information on this construction method is contained in
Chapter 12.
6.12.4. Conventional Tunnel
A thorough knowledge of tunnel construction methods is required
before designing sanitary sewers for tunnel placement. This is especially
necessary to effect economy of construction in this costly type of work.
Tunneling methods are covered in Chapter 12.
DESIGN OF SANITARY SEWER SYSTEMS 183

6.12.5. Sanitary Sewers Built in Rock
Where sanitary sewers are built in rock trenches, special attention
should be given to the method of bedding to avoid damage due to con-
tact with the rock. Adequate clearances should be provided between the
bottom and sides of the sanitary sewer and the adjacent rock trench.
Granular bedding or a concrete cradle is normally provided. If blasting is
anticipated in the area, the concrete cradle should be separated from any
rock by a granular cushion.
6.12.6. Exposed Sanitary Sewers
Sometimes sanitary sewers have to be built above the ground surface.
In these cases, the sewer pipe will be carried on supports or be designed
as a self-supporting span. In these cases, the pipe should be rigid pipe and
special consideration will need to be given to joint specification. In cli-
mates where freezing conditions exist, a method of freeze protection
should be employed. For most climates in the United States, this can con-
sist of polyurethane foam insulation with a protective outer jacket to pre-
vent damage to the foam. In colder climates, heating elements may need
to be provided to prevent freezing.
6.12.7. Foundations
Knowledge of foundation conditions should be obtained by borings,
soundings, or test pits along the route of a sanitary sewer prior to design.
Unstable foundation soils encountered in the form of silt, peat bog, satu-
rated sand, or other soft or flowing materials require special bedding and
must be considered in the design of a sanitary sewer under these condi-
tions. If these soils are encountered during construction, costs usually will
be higher than if anticipated beforehand.
Where the conditions are not severe, it may be possible to stabilize the
trench bottom by placing a layer of crushed rock below the sewer pipe.
The rock must be fine enough, or contain fines, so that settlement will not
result from unstable bottom material flowing into the voids. The engi-
neer may want to consider using filter fabric to encase the rock bedding,
or even to envelop the pipe to prevent migration of bottom material into
the pipe bedding. Concrete or wooden cradles often will suffice to spread
the load in wet or moderately soft foundations. In some cases, under-
drains laid beneath the sanitary sewer or well points will remove water
held in the soil and permit dry construction, and they may eliminate the
need for special foundations. Pipe joints that are tight, yet flexible, are
particularly important when sanitary sewers are installed in areas with
unstable soils.
184 GRAVITY SANITARY SEWER DESIGN AND CONSTRUCTION

6.12.8. Sanitary Sewers on Steep Slopes
Erosion control devices or methods may be required on steep slopes. It
may also be necessary to provide anchorage or cutoff dams to prevent the
sewer pipe from creeping downhill, or to prevent water from flowing
along the pipe and causing the trench to wash out. If drop manholes are
used and the flow is heavy, special energy dissipators may be required in
the form of a special manhole bottom or a water cushion.
6.13. RELIEF SEWERS
An overloaded existing sanitary sewer may require relief, with the
relief sewer constructed parallel to the existing line to divert flows to
alternate outlets. In the design of a relief sanitary sewer, it must be
decided whether (1) the proposed sewer is to share all rates of flow with
the existing sanitary sewer; or (2) it is to take all flows in excess of some
predetermined quantity; or (3) it is to divert a predetermined flow from
the upper end of the system. The topography, available outlets, and avail-
able head may dictate which alternate is selected. If flows are to be
divided according to some ratio, the inlet structure to the relief sanitary
sewer must be designed to divide the flow. If it is to take all flows in
excess of a predetermined quantity, the excess flow may be discharged
over a side-overflow weir or through a regulator to the relief sanitary
sewer. If flow is to be diverted in the upper reaches of a sewer system, the
entire flow at the point of diversion may be sent to the relief sanitary
sewer or the flow may be divided in a diversion structure.
An examination of flow velocities in the existing and relief sanitary sew-
ers may determine the method of relief to use. If self-cleansing velocities
cannot be maintained in either or both sanitary sewers when a division of
flows is used, excessive maintenance and sulfide generation may result. If,
on the other hand, the relief sanitary sewer is designed to take flows in
excess of a fixed quantity, the relief sanitary sewer itself will stand idle much
of the time and deposits in it may cause similar problems. Engineering judg-
ment is required in deciding which method of relief to use. In some cases it
might be better to design the new sanitary sewer with sufficient capacity to
carry the total flow and to abandon the old one. Pipe bursting, which is cov-
ered in other manuals dealing with pipeline rehabilitation, allows increas-
ing the size of an existing sewer, providing an alternative to relief sewers.
6.14. ORGANIZATION OF COMPUTATIONS
The first step in the hydraulic design of a sewer system is to prepare a
map showing the locations of all the required sanitary sewers and from
DESIGN OF SANITARY SEWER SYSTEMS 185

186 GRAVITY SANITARY SEWER DESIGN AND CONSTRUCTION
TABLE 6-2. Typical Computation Form for Design of Sanitary Sewers
which the area tributary to each point can be measured. Preliminary pro-
files of the ground surface along each line also are needed. These should
show the critical elevations that will establish the sewer pipe grades, such
as the basements of low-lying houses and other buildings and existing
sanitary sewers which must be intercepted. Topographic maps and,
where available, Geographic Information System (GIS) data are useful at
this stage of the design.

Several trial designs may be required to determine which one will prop-
erly distribute the available hydraulic head. Time may be saved if grades
are established tentatively by graphical means on profile paper before
selecting final grades and computing the sewer pipe invert elevations.
Design computations, being repetitious, may best be done either on an
electronic spreadsheet or on tabular forms permitting both wastewater
quantity and the sanitary sewer design calculations to be placed on the
same form. The form shown in Table 6-2 is fairly comprehensive and can
DESIGN OF SANITARY SEWER SYSTEMS 187

be adapted to the particular needs of the designer. It is convenient in using
this form to record the data for the sewer reaches on alternate lines, reserv-
ing intervening lines for the data on transition losses and invert drops.
In using forms of this type, it is assumed that uniform flow exists in all
reaches. The form is therefore not recommended where a detailed analy-
sis of the wastewater surface profile is to be based on nonuniform flow.
The use of Table 6-2 for sanitary sewer design requires supplementary
charts, graphs, or tables for calculating wastewater flows and hydraulic
data. As an alternative, computer programs and/or spreadsheet macros
designed to calculate open-channel flow parameters can be used to calcu-
late the necessary data.
Methods for computing the quantities of wastewater flow listed under
Columns 8 through 15 in Table 6-2 are described in Chapter 3. Methods of
calculating the hydraulic data in Columns 16 through 25 are set forth in
Chapter 5. If the value of Column 26 is positive, an invert elevation drop is
indicated. If it is negative, an invert elevation rise is indicated but would
not be installed because of the adverse effect on solids deposition during
low flows; thus, a value of zero should then be recorded in the column.
Another option is the use of proprietary sewer design programs. These
programs, although intended for modeling and analysis, also include pow-
erful features for design of new collection systems. They permit the selec-
tion of criteria for the design of new pipes, including such factors as limits
on flow in each pipe, allowable pipe sizes, maximum flow velocity, and
maximum allowable depth. The programs can automatically optimize the
design based on specific criteria and calculate any needed data, such as:
• Invert elevations.
• Pipe diameter.
• Slope.
• Elevations to match crowns, inverts, or
2
⁄
3
points for transitions in
pipe sizes.
• Needs for parallel pipes.
REFERENCES
Brown, K. W., and Caldwell, D. H. (1957). “New techniques for the detection of
defective sewers.” Sewage and Industrial Wastes, 29, 963.
Federal Housing Administration (FHA). (Undated). Feasibility of curved alignment
for residential sanitary sewers. FHA Rep. No. 704. U.S. Government Printing
Office, Washington, D.C.
Great Lakes Upper Mississippi River Basin Board of State Public Health and
Environmental Managers and Sanitary Engineers (GLUMRB). (2004). Recom-
mended standards for wastewater facilities, GLUMRB Health Education Services,
Albany, N.Y.
188 GRAVITY SANITARY SEWER DESIGN AND CONSTRUCTION

“Model sewer use law.” (Undated). New York State Department of Environmen-
tal Conservation, Albany, N.Y.
“Municipal requirements for sewer infiltration.” (1965). Pub. Works, 96(6), 158.
National Technical Information Service (NTIS). (1977). Sewer system evaluation,
rehabilitation and new construction—A manual of practice. U.S. Environmental
Protection Agency Pub. 600/2-77-017d, NTIS, Springfield, Va.
U.S. Public Health Service (USPHS). (1964). Pollution effects of stormwater and over-
flows from combined sewer systems. USPHA Pub. No.1246, U.S. Government
Printing Office, Washington, D.C.
U.S. Environmental Protection Agency (EPA). (1970). Urban storm runoff and com-
bined sewer overflow pollution. EPA Pub. No.11023, U.S. Government Printing
Office, Washington, D.C.
EPA. (1994). Combined sewer overflow control policy. EPA 59 Fed. Reg. 18688, U.S.
Government Printing Office, Washington, D.C.
Ramseier, R. E., and Rick, G. C. (1964). “Low pressure air test for sanitary sewers.”
J. San. Engrg. Div., Proc. ASCE., 90(SA2), 1.
Ramseier, R. E. (1972). “Testing new sewer pipe installations.” J. Water Poll. Con-
trol Fed., 44(4), 557–564.
Reinhart, F. W. (1961). “Long-term working stress of thermoplastic pipe.” Soc.
Petroleum Engrs. J., 17(8), 75.
Reissner, E. (1959). “On finite bending of pressurized tubes.” J. Appl. Mech., Trans.
ASME, 386–392.
Santry, I. W., Jr. (1964). “Infiltration in sanitary sewers.” J. Water Poll. Control Fed.,
36, 1256.
Timoshenko, S. (1948). Strength of materials, D. Van Nostrand Co., New York.
“Uni B-6, recommended practice for low-pressure air testing of installed sanitary
sewer pipe.” (1998). Uni-Bell PVC Pipe Association, Dallas, Tex.
DESIGN OF SANITARY SEWER SYSTEMS 189
This page intentionally left blank

7.1. INTRODUCTION
Certain appurtenances are essential to the proper functioning of sani-
tary sewer systems. They may include manholes, terminal cleanouts,
service connections, inverted siphons, junction chambers, and other struc-
tures or devices of special design.
Many states have established criteria through their regulatory agencies
which govern, to some extent, the design and construction of appurte-
nances to sanitary sewer systems. In addition, each municipal engineer-
ing office or private office acting for a municipality has its own design
standards. It is to be expected, therefore, that many variations will be
found in the design of even the simplest structures. The discussion to fol-
low is limited to a general description of each of the various appurte-
nances, with special emphasis on the features considered essential to
good design.
7.2. MANHOLES
7.2.1. Objectives
A manhole design should pass at least these major tests. It should:
• Provide convenient access to the sewer for observations and mainte-
nance operations.
• Cause a minimum of interference with the hydraulics of the sewer.
• Be durable and generally a watertight structure.
• Be strong enough to support applied loads.
CHAPTER 7
APPURTENANCES AND SPECIAL
STRUCTURES
191

7.2.2. Manhole Spacing and Location
When designing sewer systems which parallel or cross streams,
rivers, or other waterways, the engineer should consider evaluating evi-
dence of stream channel movement to determine whether proposed
sewer appurtenance locations are subject to future erosion. Should the
evidence suggest the channel and/or banks are migrating, it may be
beneficial to further evaluate potential future scenarios of this move-
ment. Additional considerations to be made at that juncture include bank
stabilization and protective measures.
For additional discussion, see Section 6.4. of Chapter 6.
7.2.3. General Shape and Dimensions
Most manholes are essentially cylindrical in shape, with the inside
dimensions sufficient to perform inspecting and cleaning operations with-
out difficulty. On small sewers, a minimum inside diameter of 4 ft (1.2 m)
at the bottom has been widely adopted in the United States. A diameter of
3 ft (1 m) is more common in some other countries. The diameter is gener-
ally constant up to a cone at the top, where the diameter is reduced to
receive the frame and cover (Fig. 7-1A). In some areas where brick man-
holes are used, the 4-ft- (1.2-m)-diameter cylinder is tall enough to provide
an adequate working space and, above that, a 3-ft (1-m) shaft is constricted
up to the cone (Fig. 7-1C). It has become common practice in recent years to
use eccentric cones, especially in precast concrete manholes, thus provid-
ing a vertical side for the steps (Fig. 7-1B). Most often the orientation places
the steps over the bench, but some designs place the steps opposite the out-
let pipe, thus preserving the maximum working space on the bench.
Another design used under special conditions, especially where a
larger working space is needed, specifies a reinforced concrete slab
instead of a cone, as shown in Fig. 7-1D. This is applicable whether the
working space is circular or rectangular. The slab must be suitably rein-
forced to withstand traffic and earth loads.
7.2.4. Shallow Manholes
Irregular topography sometimes results in shallow manholes. A man-
hole of standard design does not provide a space in which a maintenance
worker can work effectively if the depth is only 3 to 4.5 ft (1 to 1.5 m). An
extra-large cover with a 30- to 36-inch- (0.75- to 0.9-m)-diameter opening
helps improve this condition. A manhole that is cylindrical up to a flat
slab at the surface is suitable if the head room is 4 ft (1.2 m). Usually, the
best option is to plan on maintenance work being done from the surface.
Sometimes slots have been provided, no wider than the diameter of the
sewer. A special foundation is needed if a slot access of this type must
support traffic loads.
192 GRAVITY SANITARY SEWER DESIGN AND CONSTRUCTION

APPURTENANCES AND SPECIAL STRUCTURES 193
FIGURE 7-1. Typical manholes for small sewers (ft 0.3 m; inch 2.54 cm).

7.2.5. Construction Material
The materials most commonly used for manhole walls include precast
concrete sections and cast-in-place concrete. Manholes built before the
middle of the twentieth century were usually made of brick, followed by
concrete block with occasional cast-in-place designs. Since then, precast
concrete manhole sections have become dominant, at least in the United
States, and preformed fiberglass-reinforced manholes or high-density
polyethylene (HDPE) manholes are being used in some places. The sec-
tions are available in various heights and include properly spaced steps.
When these manholes are used, the design should consider provision of
antiflotation collars or other means of anchorage to prevent flotation of
the manhole. Precast manhole bottoms also have been used in some
places and are frequently preferred for new installations.
Transition sections are furnished to reduce the diameter of the man-
hole at the top to accommodate the frame and cover. It is common prac-
tice to allow three or four courses of brick or concrete rings just below the
rim casting to permit easier future adjustment of the top elevation.
Brick or concrete block manhole walls normally are built 8 inches
(200 mm) thick at the shallower depths, and may increase to 12 inches
(300 mm) below 8 to 12 ft (2.5 to 3.5 m) from the surface. Joints should be
filled completely with cement mortar. The outside walls of brick or block
manholes should be plastered with cement mortar not less than 0.5 inch
(13 mm) thick. In wet areas, a bituminous damp-proofing compound is
often applied to the exterior of the cement mortar.
It is difficult to make brick manholes watertight, and precast manholes
may leak because of imperfect sealing of the joints. Preferably the sections
of precast manholes are joined in the same manner as in a pipeline, using
elastomeric gaskets or a joint filler of proven effectiveness.
In some cases it may be beneficial to build sewers out of newer materi-
als, such as fiberglass-reinforced plastic (FRP) or HDPE, and in those
cases the engineer should consider utilizing pipe sections as manhole
stacks. With HDPE, the vertical and horizontal pipe sections are fused
together to form the sewer line with a vertical manhole stack, thereby
reducing potential sources of groundwater infiltration.
7.2.6. Frame and Cover
The manhole frame and cover normally are made of cast or ductile
iron. The cover is designed with these objectives:
• Provision of an adequate aperture for access to the sewer. The most com-
mon practice in the United States is to require a 24-inch (600-mm)
clear opening. Sometimes 22-inch (550-mm) openings have been
194 GRAVITY SANITARY SEWER DESIGN AND CONSTRUCTION

used, but current standards have been moving toward the larger
dimension. It is difficult for a large worker, properly equipped, to
enter through a 22-inch (550-mm) opening. For sewers up to 3 ft
(900 mm) in diameter, covers sometimes are used that have a clear
opening of 3 ft (900 mm) to accommodate cleaning equipment
equaling the sewer diameter. However, collapsible cleaning equip-
ment is the rule for large sewers. Many authorities do not use open-
ings larger than 2 ft (600 mm). Openings larger than 3 ft (900 mm)
are used in special cases.
• Adequate strength to support superimposed loads. A typical traffic-
weight cover for a 24-inch (600-mm) clear opening weighs about
160 lb (75 kg) and the frame about the same amount or somewhat
more. Weights up to 440 lb (200 kg) are specified in some places as
the total for cover and frame. Lighter weights may be used where
there is no danger that they will be subjected to heavy loads.
• A good fit between cover and frame, so there will be no rattling in traffic. It
is usually specified that the seat in the frame on which the cover rests
and the matching face of the cover be machined to ensure good fit.
• Provision for opening. Most commonly, this takes the form of a notch
at the side where a pick or bar can be used to pry the cover loose,
often supplemented by a pick hole a short distance in from the edge.
• Prevent earth and gravel from falling into the sewer when the manhole
must be opened. To intercept sticks or earth inserted or falling through
the pick hole, a dustpan is sometimes placed under the cover. Usu-
ally this is an iron disc, slightly smaller than the manhole opening,
resting on lugs at the base of the frame. A polyethylene bowl-shaped
diaphragm is now on the market that will retain dirt, and it is gas-
keted so that it is supposed to prevent the inflow of water to the
sewer. Rubber gaskets sometimes are laid on the seat under the
cover to maintain tightness in low areas subject to flooding.
• Resistance to unauthorized entry. The principal defense against a cover
being lifted by children is its weight, but more persistent and compe-
tent vandals bent on throwing debris into a manhole are not deterred
easily. An emergency measure in an area particularly plagued by
mischief of this sort or by illegal disposals is a covering of planks
over the channel. Sometimes covers are bolted in place and occa-
sionally a lock is provided. The theft of manhole covers is a problem
in some places.
• Seal between frame and manhole. The seal between the manhole frame
and the manhole stack is a common source of debris and water
influx. This is especially true in areas with significant seasonal tem-
perature fluctuations and those subject to vibration (manholes in the
wheel path of vehicles). This can be reduced by providing internal
or external flexible seals or coatings.
APPURTENANCES AND SPECIAL STRUCTURES 195

7.2.7. Connection between Manhole and Sewer
Differential settling of the manhole and the sewer sometimes breaks
the sewer pipe. A pipe joint just outside the manhole permits flexibility
and lessens this danger. If the soil conditions are quite unstable, a second
joint within 3 ft (1 m) of the first may be necessary. To accomplish this
purpose, the joints must not be rigid. Elastomeric gaskets and couplings
are available to form flexible, watertight connections between the man-
hole and the sewer pipe, thus allowing not only flexure but also a minor
amount of differential settlement that otherwise would break the pipe
(Fig. 7-2). These connectors are specified in ASTM C923.
7.2.8. Steps
Manhole steps should be wide enough for a worker to place both feet
on one step, with the design to prevent lateral slippage off the step and far
enough from the wall to be easy to stand on. They are generally spaced at
12- to 16-inch (0.3- to 0.4-m) intervals. Attention must be given to prevail-
ing safety regulations, such as those issued by the Occupational Safety
and Health Administration in the United States.
Types that have been most commonly used are made of ductile iron
or shaped from 0.75- or 1-inch (20- to 25-mm) galvanized steel or
wrought iron bars. These metals corrode in the moist atmosphere pre-
vailing in most manholes, but under normal conditions corrosion is not
rapid. If the wastewater contains much hydrogen sulfide, and especially
if there also is much turbulence, the lower steps will fail in a few years.
Steps formed of
5
⁄
8
-inch (15-mm) AISI Type 304 or 316 stainless steel
196 GRAVITY SANITARY SEWER DESIGN AND CONSTRUCTION
FIGURE 7-2. A and B, flexible joint connection between pipe and manhole.
Courtesy of NPC, Inc., Milford, N. H.

rods have been used in a few places. They should have a long life under
most conditions. In recent years, steps made of plastic or steel armored
with plastic have been used. Aluminum has also been successfully used
in many sanitary sewers. However, it is a very corrodible metal under
conditions sometimes encountered in sewers. In some areas, steps are
omitted entirely. This is sometimes done to reduce the danger that a cor-
roded step might break under a person’s weight. Eliminating steps has
also become common practice to prevent manhole entry without follow-
ing proper safety procedures requiring harnesses, tripods, and multi-
worker crews.
7.2.9. Channel and Bench
A channel of good hydraulic properties is an important objective that
frequently is not realized because of careless construction. The channel
should be, insofar as possible, a smooth continuation of the pipe. In fact,
the pipe sometimes is laid through the manhole with the top half
removed to provide the channel. If this is done merely by breaking out the
upper half, it is difficult to make a satisfactory channel. The best practice
seems to be to lay a neatly cut half-pipe then build up the sides with con-
crete, or to use steel forms.
The completed channel cross section should be U-shaped. Some engi-
neers specify a channel constructed only as high as the centerline of the
pipe on small sizes. Others require that the height be three-quarters of
the diameter or the full diameter. For sizes 15-inch (375-mm) and larger, the
required channel height rarely is less than three-quarters of the diameter.
Loss of energy caused by expansion and contraction of the stream from
pipe to U-shaped channel to pipe, with the pipe running full, should be
less than 3% of the velocity head if the U-shaped channel is the full depth
of the pipe. It will be much greater with a channel that allows the water to
swirl out over the bench. Close attention to detail is required to secure
well-constructed U-shaped channels.
The bench should provide good footing for a workman and a place
where minor tools and equipment can be laid. It must have enough pitch
to drain to the channel, but not too much. A slope of 1 in 12 is common,
but 1 in 24 is specified in some areas to provide a safer footing.
In the past it was ordinary practice to allow an arbitrary drop of 0.1 ft
(30 mm) in the invert across the manhole, or a slope of 0.025 in a standard
manhole, regardless of the slope of the adjacent pipeline. If the channel is
constructed properly, this drop is unnecessary. The drop is, in fact, objec-
tionable for it causes excessive turbulence just where it is less desirable
and sacrifices head that might better be used toward the attainment of
good slopes along the entire sewer. The usual practice calls for a continu-
ation of the pipe slope through the manhole.
APPURTENANCES AND SPECIAL STRUCTURES 197

7.2.10. Manholes on Large Sewers
The operations and methods of maintenance in large sewers are not the
same as in small ones, and manhole designs are specified accordingly.
Sometimes a platform is provided at one side, or the manhole is simply a
vertical shaft over the center of the sewer. In the latter case, a block of
reinforced concrete is cast around the pipe and designed to form an ade-
quate foundation to support the shaft plus transmitted traffic loads. Such
manholes usually are built without steps since a worker cannot step off
into the water anyway. When entry is necessary, a worker is lowered in a
chair hoist or cage. Large, factory-made T-sections also can be used if ade-
quate support is provided for the shaft and transmitted loads.
Where a sewer is larger than 2 ft (600 mm) and the small-sewer type of
manhole is used, the diameter of the manhole should be increased suffi-
ciently to maintain an adequate width of bench, preferably 1 ft (0.3 m) or
more on each side. In sewers that a worker cannot straddle, maintenance
workers frequently lay planks to bridge the channel. Hence, there must be
adequate and well-formed benches on each side. Sometimes the entering
pipe is extended 2 to 3 ft (0.6 to 1 m) into the manhole and mortared over
to form a smooth platform, as shown for the larger manhole in Fig. 7-3.
198 GRAVITY SANITARY SEWER DESIGN AND CONSTRUCTION
FIGURE 7-3. Two manholes for intermediate-sized sewers (ft 0.3 m).

7.3. BENDS
Particular care must be used in the construction of curved channels to
accommodate bends. The highest workmanship is necessary to produce
channels that are smooth, with uniform sections, radius, and slope.
A curve of very short radius causes energy-wasting turbulence. Some
authorities recommend that for optimum performance the radius of the
centerline be three times the pipe diameter or channel width. Reasonably
satisfactory conditions usually can be obtained if the radius is not less
than 1.5 times the diameter. If the velocity is supercritical, surface turbu-
lence and energy losses arise even with long-radius bends.
The radius of curvature of a bend within a manhole is maximized if
the points of tangency of the outer curve of the channel with the walls of
the pipes are at the ends of the manhole diameter, as shown in Fig. 7-4
for the 12- and 18-inch (300- and 450-mm) pipes. This is true regardless of
APPURTENANCES AND SPECIAL STRUCTURES 199
FIGURE 7-4. Manhole placement for various types of bends (1 ft. = 300
mm; 1 in. = 25.4 mm)

the angle. Bends of less than 90 degrees can, of course, be accommodated
more easily. For angles substantially less than 90 degrees on sewers larger
than 12 inches (300 mm) in diameter, the manhole is usually centered over
the pipe.
Completion of a bend within a manhole is not necessary and becomes
impossible as the pipe approaches the size of the manhole. Furthermore,
when the size of the sewer is such that the manhole is only a chimney over
the sewer, a manhole may be placed over the center of the curve or on the
downstream tangent, or perhaps two may be used—one upstream and
one downstream. Figure 7-4 shows some of the possible designs for man-
holes on bends.
Frequently, extra fall in the channel invert is provided on bends to
compensate for bend energy losses. When this is done, the extra fall
should reflect only the expected losses. Although experimental data for
large conduits are scarce, it would appear that for a well-made 90-degree
bend with a centerline radius of curvature not less than one pipe diame-
ter, the loss in an open channel should not exceed 0.4 of the velocity head.
Thus, for a velocity of 3 fps (1 mps), the loss would probably be not more
than 0.06 ft (20 mm) for subcritical flow. Energy loss will be greater with
supercritical flow but conservation of the energy of the stream is not
likely to be important under that condition. In sewers where flows are
small or velocities moderate, the energy losses at bends are usually
ignored. The slight backing-up of the water due to the energy loss is usu-
ally inconsequential. (A more complete discussion of energy losses in
bends, including those associated with supercritical flow, is found in
Chapter 5.)
7.4. JUNCTIONS AND DIVERSIONS
On small sewers, junctions are made in ordinary manholes, with the
branch line curved into the main channel. Excessive widening of the main
channel at the junction should be avoided. Eddying flows and accumula-
tions of sludge and rags are the result of poor flow patterns prevailing in
many junction manholes. To minimize these objectionable conditions, the
invert of the branch lines may be brought in somewhat higher than the
invert of the main channel where the two join. Channels are generally
constructed in the manhole bottom for all lines. Sometimes right-angle
junctions are used in small sewers. This usually causes less energy loss
than the attempt to conserve some of the energy of the side stream by use
of a curved channel.
Large junctions generally are constructed in cast-in-place reinforced
concrete chambers entered through manhole shafts (their hydraulic
design is discussed in Chapter 5).
200 GRAVITY SANITARY SEWER DESIGN AND CONSTRUCTION

Diversion structures are specialty features that commonly occur when
retrofitting an existing sewer with a parallel sewer to provide extra capac-
ity. In those cases it is advantageous to consider using a diversion struc-
ture at a location (or multiple locations) that allows for future isolation of
all or portions of the downstream system. In ideal situations, the struc-
tures can be designed to allow for automatic flow equalization using
overflow weirs between the sewer lines, and can be supplemented with
gates to provide for manual flow equalization or diversion. The true cost
benefits of these structures are realized during maintenance operations
when the cost of bypass pumping is considerable.
7.5. DROP MANHOLES
If a sewer enters a manhole at an elevation considerably higher than
the outgoing pipe, it is generally not satisfactory to let the stream merely
pour into the manhole because the structure then does not provide an
acceptable working space. Drop manholes are usually provided in these
cases. Figure 7-5 shows common types. These structures are not trouble-
free. Sticks may bridge the drop pipe, starting a stoppage. Because of such
a stoppage or merely because of high flow, wastewater may spill out of
the end of the pipe, making the manhole a dangerous and objectionable
place to work. Cleaning equipment also may lodge in the drop pipe.
Sometimes the drop pipe is placed inside the manhole or the drop pipe is
made of a larger diameter to minimize stoppages. Another arrangement
sometimes used is to provide a cross instead of a tee outside the manhole,
with the vertical pipe extended to the surface of the ground and with a
suitable cover so that it is accessible for cleaning.
APPURTENANCES AND SPECIAL STRUCTURES 201
FIGURE 7-5. Drop manholes (ft 0.3 m).

Drop manholes should be used sparingly and, generally, only when it
is not economically feasible to steepen the incoming sewer. Some engi-
neers eliminate drops by using vertical curves. It would appear that this
should be a general rule for elevation differences of less than about 3 ft
(1 m) and often for larger drops as well.
7.6. TERMINAL CLEANOUTS
Terminal cleanouts sometimes are used at the upstream ends of sew-
ers, although most engineers now specify manholes. Their purpose is to
provide a means for inserting cleaning tools, flushing, or inserting an
inspection light into the sewer.
A terminal cleanout consists of an upturned pipe coming to the surface
of the ground. The turn should be made with bends so that flexible clean-
ing rods can be passed through it. The diameter should be the same as
that of the sewer. The cleanout is capped with a cast-iron frame and cover
(Fig. 7-6).
202 GRAVITY SANITARY SEWER DESIGN AND CONSTRUCTION
FIGURE 7-6. Terminal cleanout (ft 0.3 m; inch 2.54 cm).

In the past, tees often were used instead of pipe bends and the struc-
tures were called lampholes. Since cleaning equipment cannot be passed
into the sewer through a tee, their use is no longer considered to be good
design practice.
Regulations in most areas allow terminal cleanouts (if at all) only
within 150 to 200 ft (45 to 60 m) of a manhole.
7.7. SERVICE LATERALS
Service laterals, also called house connections or service connections,
are the branches between the street sewer and the property or curb lines,
serving individual properties. They usually are required to be 4, 5, or
6 inches (100, 125, or 150 mm) in diameter, preferably with a slope of 1 in
48, or 2%. Sometimes 1% slopes are allowed and this seems to serve just as
well. If a stoppage occurs in a service lateral, it may be due to root pene-
tration, grease, or sometimes corrosion (in the case of iron pipes). Steeper
slopes are of no benefit in coping with those problems.
Materials, joints, and workmanship for service laterals should be equal
to those of the street sewer to minimize infiltration and root penetration.
Particular attention should be paid to the construction of service laterals,
especially compaction of bedding and backfill material, and jointing tech-
niques, since these sewers frequently represent the major source of infil-
tration/inflow in a sanitary sewer system (see Chapter 3).
Often building sewers are constructed to the property or curb line at
the time the street sewer is constructed. To meet the future needs of
unsubdivided properties, wyes or tees sometimes are installed at what
are presumed to be convenient intervals. Laterals or stubs not placed in
use should be plugged tightly. Figure 7-7 shows typical connections. Typ-
ical connections to a deep sewer are shown in Fig. 7-8.
If wyes or tees are not installed when the sewer is constructed, the
sewer must be tapped later, and deplorably poor connections often have
resulted. This is especially true for those connections made by breaking
into the sewer and grouting-in a stub. Either a length of pipe should be
removed and replaced with a wye or tee fitting or, better, a clean opening
should be cut with proper equipment and a tee-saddle or tee-insert
attached. Any connection other than to existing fittings must be made by
experienced workers under close supervision.
In some places, test tees are required on the service lateral, which per-
mit the outlet to the street sewer to be plugged. This makes it possible to
test the service lateral.
When a connection is to a concrete trunk sewer, a bell may be installed
at the outside of the pipe. Three designs are shown in Fig. 7-9. Preferably
the bell is provided by the manufacturer, but it can be installed in the field
APPURTENANCES AND SPECIAL STRUCTURES 203

if necessary. It must be high enough on the pipe so that the lateral will not
be flooded by high flows in the sewer.
Large trunks are not ordinarily used as collecting sewers. When they
are more than 3 or 4 ft (900 to 1,200 mm) in diameter, they frequently are
paralleled by smaller collecting sewers that enter the trunks at manholes.
7.8. CHECK VALVES AND RELIEF OVERFLOWS
Where the floor of a building is at an elevation lower than the top of the
next upstream manhole on the sewer system, a stoppage in the main
sewer can lead to overflow of wastewater into the building. Devices that
sometimes are used to guard against such occurrences include backflow
preventers or check valves and relief overflows.
Backflow preventers or check valves may be installed where the house
plumbing discharges to the house sewers. Usually a double check valve is
specified. Even so, such devices frequently do not remain effective over
long periods of time.
204 GRAVITY SANITARY SEWER DESIGN AND CONSTRUCTION
FIGURE 7-7. Service connection for shallow sewer (inch 2.54 cm).

Any overflow of wastewater is undesirable but if a stoppage occurs in
a street sewer, overflow may result. It will be from a manhole in the street,
into a building, or on occasion at a designated overflow point. For the lat-
ter to be effective, it must be at an elevation lower than the floor level
being protected. At this point, a relief device may be installed that encases
a ball resting on a seat to close the end of a vertical riser and prevent flow
into the sewer. The relief device must be constructed so that the ball will
rise and allow overflowing wastewater to escape and thus provide relief.
This practice is not encouraged except in the most extreme conditions and
APPURTENANCES AND SPECIAL STRUCTURES 205
Figure 7-8. Service connection for deep sewer (inch 2.54 cm).

206 GRAVITY SANITARY SEWER DESIGN AND CONSTRUCTION
FIGURE 7-9. A–C Various connections to large sewers. A and C courtesy
NPC, Inc., Milford, N. H.

usually with regulatory approvals. Building owners who have valuable
property in basements that might be flooded usually protect themselves,
insofar as possible, by check valves.
7.9. SIPHONS
“Siphon” in sewerage practice almost always refers to an inverted
siphon or depressed sewer which would stand full even with no flow. Its
purpose is to carry the flow under an obstruction, such as a stream or
depressed highway, and to regain as much elevation as possible after the
obstruction has been passed.
APPURTENANCES AND SPECIAL STRUCTURES 207
FIGURE 7-9. (Continued).
1—Acrylonitrile-butadiene-styrene (ABS), PVC, or cast iron (CI) nipple;
2—Large neoprene “donut”;
3—Cast ductile flange;
4—Neoprene coupling;
5—Stainless steel nuts, bolts, and washers;
6—Lead lag anchors;
7—Stainless steel clamps.

7.9.1. Single- and Multiple-Barrel Siphons
Siphons are often constructed with multiple barrels. The objective is to
provide adequate self-cleansing velocities and maintenance flexibility
under widely varying flow conditions. The primary barrel is designed so
that a velocity of 2 to 3 fps (0.6 to 1.0 mps) will be reached at least once
each day, even during the early years of operation. Additional pipes, reg-
ulated by lateral overflow weirs, assist progressively in carrying flows of
greater magnitude (i.e., maximum dry-weather flow to maximum storm
flow). The overflow weirs may be considered as submerged obstacles,
causing loss in head as flow passes over them. The weir losses may be
assumed equal to the head necessary to produce critical velocity across
the crest. Weir crest elevations are dependent on the depths of flow in the
upstream sewer for the design quantity increments. Sample crest length
calculations are presented in textbooks (Fair and Geyer 1954).
Many engineers maintain that for sanitary sewers there is usually no
need for multiple barrels. They reason that solids which settle out at low
flows will flush out when higher flows are obtained, except for those
heavy solids that would accumulate even at high flows. Single-barrel
siphons generate less sulfide and cause less loss of hydraulic head than do
multiple barrels. Single-barrel siphons have been built with diameters
ranging from 6 to 90 inches (150 to 2,300 mm) or more. Engineers holding
to this concept generally favor a small barrel if initial flows are to be much
lower than in later years, with a larger barrel constructed at a later date or
constructed at the outset and blocked off so that it can always operate as a
single-barrel siphon. In some situations a spare barrel may be desirable
purely for emergency or maintenance use.
7.9.2. Profile
Two considerations that govern the profile of a siphon are provision
for hydraulic losses and ease of cleaning. The friction loss through the
barrel will be determined by the design velocity. For calculating this head
loss, it is advisable to use a conservative Hazen-Williams friction coeffi-
cient of 100 (Manning n from 0.014 for small sizes to 0.015 for the largest).
In the case of multiple-barrel siphons, additional losses due to side-over-
flow weirs must be considered.
Siphons may need cleaning more often than gravity sewers. For easy
cleaning by modern methods, the siphon should not have any sharp
bends, either vertical or horizontal. Only smooth curves of adequate
radius should be used. The rising leg should not be so steep as to make it
difficult to remove heavy solids by cleaning tools that operate hydrauli-
cally. Some agencies limit the rising slope to 15%, but slopes as great as
50% (30 degrees) are used in some places. There should be no change of
208 GRAVITY SANITARY SEWER DESIGN AND CONSTRUCTION

pipe diameter within the length of a barrel since this would hamper clean-
ing operations.
The engineer should also incorporate the use of gates and/or stop logs
at the opening of each siphon pipe. This facilitates easy isolation of one of
more of the pipes for future cleaning operations.
7.9.3. Air Jumpers
Positive pressure develops in the sewer atmosphere upstream from a
siphon because of the downstream movement of air induced by the
sewage flow. In extreme cases, this pressure may equal several inches
(centimeters) of water. Air therefore tends to exhaust from the manhole at
the siphon inlet, escaping in large amounts even from a pick hole. Under
all except maximum flow conditions, there is a drop in water surface ele-
vation into a siphon, with consequent turbulence and release of odors.
The exiting air can thus be the cause of serious odor problems. Con-
versely, air is drawn in at the siphon outlet.
Attempts to close the inlet structure tightly will usually force the air out
of plumbing vents or manholes farther upstream. Insofar as the attempt to
close the sewer tightly is successful, oxygen depletion in the sewer atmos-
phere occurs, aggravating sulfide generation where this is a problem.
To overcome this difficulty, a number of siphons built in recent years
have used air jumpers (i.e., pipes that take the air off the top of the inlet
structure and return it at the end of the siphon). Usually, the jumper pipe
is one-third to one-half the diameter of the siphon. Sometimes the pipe
can be suspended above the hydraulic grade line of the sewer, but in
other cases it must run more or less parallel to the siphon. In these cases,
provision must be made for dewatering the jumper; otherwise it will fill
with condensate. In some cases a drain has been installed to a percolation
pit. One large air jumper in use consists of 48-inch- (1,200-mm)-diameter
pipe paralleling a 90-inch- (2,300-mm) siphon, 2,000 ft (610 m) long, utiliz-
ing a sump pump for dewatering.
7.9.4. Sulfide Generation
Sulfide may be produced in a long siphon. There is nearly always a
hydraulic jump or turbulence at a siphon inlet, which causes absorption
of oxygen and delays the onset of sulfide buildup in comparison with
pressure mains that lack this initial aeration. Thus, sulfide buildup may
be delayed for as much as an hour if the wastewater is of low tempera-
ture or low biochemical oxygen demand (BOD). When higher tempera-
tures prevail, and especially if oxygen absorption at the inlet is minimal,
sulfide buildup may be underway in 20 minutes. For any given flow and
wastewater characteristics, the sulfide concentration produced in a filled
APPURTENANCES AND SPECIAL STRUCTURES 209

pipe is roughly proportional to the pipe diameter. (For further details,
see Chapter 4.)
7.10. FLAP GATES OR DUCKBILL VALVES
Flap gates or duckbill valves are installed at or near sewer outlets to pre-
vent back-flooding of the sewer system by high tides or high stages in the
receiving stream. These are common only in combined or storm sewers.
Duckbill valves are made of elastomers which are not susceptible to cor-
rosion. They are commercially available in sizes up to 96-inch (2,438-mm)
diameter. The valves have been found to be self-cleansing.
Flap gates may be made of wood, cast iron, or steel. They are commer-
cially available in sizes up to 8 ft (2.4 m) in diameter. Larger gates can be
fabricated from plates and structural shapes. They should be hinged by a
link-type arrangement which allows the gate shutter to seat more securely.
Hinge pins, linkages, and seats should be corrosion-resistant.
The maintenance of flap gates requires regular inspection and removal
of debris from the pipe and outlet chamber, lubrication of hinge pins, and
cleaning of seating surfaces.
7.11. SEWERS ABOVE GROUND
Occasionally, in rolling or hilly terrain, it is desirable and economical to
build sewers above the surface of the ground or across gullies and stream
valleys. Such sewers often are constructed in carefully compacted fill. Some-
times it is better to suspend a sewer over a waterway or a highway than to
go under it by means of an inverted siphon. Sewer crossings in such cases
have been constructed by installing or hanging the pipes on bridges, by fas-
tening them to structural supports which rest on piers, by supporting them
with suspension spans and cables, and by means of sewer pipe beams.
Structural design of suspended sewers is similar to that of comparable
structures with supporting members of timber, steel, or reinforced concrete.
Foundation piers or abutments should be designed to prevent overturning
and settlement. The impact of flood waters and debris should be considered.
If the sewer is exposed, as on a trestle, steel pipe may be used with
coating and lining for corrosion protection. Sometimes sewers of other
materials are carried inside steel pipes. The steel pipe may be supported
by simple piers at suitable intervals.
In recent years, prestressed concrete pipe beams have been used to span
waterways and other obstacles. Generally, they have been of three types:
1. A rectangular section with a circular void extending the full length of
member, either pretensioned or post-tensioned, and similar to a hollow
box highway girder. This section is normally used for smaller sewers.
210 GRAVITY SANITARY SEWER DESIGN AND CONSTRUCTION

2. A pretensioned circular pipe section which may be produced in most
any diameter. This type is economical for long crossings.
3. Reinforced concrete pipe sections assembled and post-tensioned to
form the required sewer pipe beam. These beams may be fabricated
economically using standard pipe forms and prestressing equipment.
The pipes are cast with longitudinal cable ducts in the walls. After cur-
ing, the pipes are aligned and post-tensioning cables are inserted and
jacked to the design tension, and anchored. Pressure grouting of the
ducts completes the manufacture and the sewer beam is then shipped
to the job site for installation.
Protection against freezing and prevention of leakage are important
design and construction considerations for aboveground sewers. It has
been found necessary in some designs to employ expansion jointing
between aboveground and belowground sewers. Special couplings are
available for such purposes. Anchorage provision also must be made to
prevent permanent creep. Expansion joints in sewers supported on
bridges or buildings should match the expansion joints in the structures
to which the sewer is attached.
7.12. UNDERWATER SEWERS AND OUTFALLS
7.12.1. Ocean Outfalls
Communities adjacent to a seacoast may discharge their treated waste-
water into the ocean. Disinfected secondary effluents generally are dis-
charged relatively close to shore but usually beyond the distance designated
for body contact. Primary effluents are carried far enough to sea to avoid any
undesirable effects. In the United States, with very few exceptions, all ocean
discharges must have secondary treatment, but this is not the usual policy in
other countries where the discharge of primary effluent is considered satis-
factory if suitable depths and distances are reached.
For proper design, it is essential to obtain detailed data on the following:
• Bathymetric profiles of possible outfall routes.
• Nature of the ocean bottom.
• Water density stratification or thermoclines, by seasons.
• Patterns of water movement at point of discharge and travel time
to shore.
Since seawater is 2.5% denser than sanitary wastewater, the discharged
wastewater rises rapidly, normally producing a boil at the surface. The
rising plume mixes with a quantity of seawater, which is generally from
APPURTENANCES AND SPECIAL STRUCTURES 211

10 to 100 or more times the wastewater flow. Dilution increases rapidly as
the wastewater field moves away from the boil. The required length and
depth of the outfall is related to the degree of treatment of the wastewater.
The length must be calculated so that time and dilution will adequately
protect the beneficial uses of the adjacent waters.
Much research has been done regarding the dilution of the wastewater
and the die-away of the bacteria (Rawn and Palmer 1930; Brooks 1960;
Abraham 1963; Pomeroy 1960; Pearson 1956; Gunnerson 1961). A full
treatment of that subject is beyond the scope of this Manual.
Where the outfall is deep and there is good density stratification (ther-
mocline), the rising plume may pick up enough cold bottom water so that
the mixture is heavier than the surface water. The rising plume therefore
stops beneath the surface or reaches the surface and then resubmerges.
Diffusers may be used to gain maximum benefit of density stratifica-
tion. If, however, they merely divide the flow into many small streams in
a small area (a gas burner type of diffuser), they do little good. The flow
must be dispersed widely so that huge flows of dilution water can be uti-
lized at low velocity.
The diffuser must be approximately level if it is to accomplish reason-
ably uniform distribution. For design of the diffuser, the rule of thumb
may be used that the total cross-sectional area of the ports should not be
more than half the cross-sectional area of the pipe. In large diffusers, often
exceeding 0.6 miles (1 km) in length, the diffuser diameter may be
stepped down in size toward the end (Rawn et al. 1960). Computerized
calculations are used in the design of these large diffusers.
These principles are well-illustrated by the Los Angeles City outfall in
Santa Monica Bay, California. The effluent is carried by a 12-ft- (3.7-m)-
diameter pipe to a point 5 miles (8 km) from shore at a depth of 190 ft
(58 m), then dispersed through a Y-shaped diffuser with the two arms
totaling 8,000 ft (2,400 m) in length. Except for certain periods in winter
when the thermocline is practically nonexistent, no wastewater can be
seen rising to the surface. The flow of effluent, which has been upgraded
to full secondary standards, exceeds 340 mgd (14 m
3
/sec), yet the bathing
waters of the highly popular beaches on the Bay show no bacterial evi-
dence of the wastewater discharge.
Ocean outfalls require specialized design expertise; however, a general
overview is provided here. Outfalls into the open ocean generally are
buried to a point where the water is deep enough to protect them from
wave action, hydrodynamic forces, and shifting bottom sands—usually
about 30 ft (10 m). Trenches in rock are formed by blasting. Beyond the
buried portion, the outfall rests on the bottom, with a flanking of rock to
prevent currents from undercutting it where the bottom is soft.
Ocean outfalls in the smaller sizes are now usually made of steel pipe,
mortar-lined and coated. Steel pipes are welded and usually can be
212 GRAVITY SANITARY SEWER DESIGN AND CONSTRUCTION

dragged into place from the shore. Relatively short pipelines are some-
times floated into place. Reinforced concrete pipe is used for the larger
sizes. The joints for concrete outfalls usually are made with rubber gas-
kets similar to those used for construction on land. Special bolted restraints
are used to secure the joints in small outfalls. Where the depth exceeds
30 ft (10 m), large pipes are simply laid on the bottom, sometimes with a
rock cradle. They must be adequately flanked with rock; in this condition
they are stable. Many such outfalls are operating successfully.
7.12.2. Other Outlets
If effluent is discharged into an estuary or landlocked bay, special stud-
ies are needed to explore tidal currents, upstream flow of salt water at the
bottom, available dilution, etc., in order to determine which discharge
locations are compatible with various degrees of treatment.
Sewers discharging into streams with high-velocity flood flows require
thought in design to prevent undermining of the outlet structure and the
pipe itself. Large outlets into the Mississippi River, for example, have
been built with massive headwalls and wingwalls with deep foundations.
7.13. MEASURING WASTEWATER FLOWS
The design of a sewer system often requires measurements of flows in
sewers as well as the design of permanent monitoring facilities to meas-
ure and record future flows at one or more points in the system. There are
many reasons why such measurements are made, two of which are to col-
lect information needed in the administration of contracts between coop-
erating parties, and to aid engineers in the planning of future expansions.
Two classes of metering devices may be distinguished: those that are
adapted to filled pipes (“closed-channel flow”), and those that make
measurements in streams that have a surface exposed to the air, as in a
partly filled gravity sewer (the “open-channel flow” condition).
A force main from a pump station is a closed channel in which a Venturi-
type meter, a sonic meter depending upon the Doppler effect, or a mag-
netic meter may be used. In rare cases the stream in a gravity sewer is
caused to flow through a depressed reach as a pressure conduit where
one of these devices has been placed. This section of the chapter, however,
deals only with measurements of the open-channel type, since most sewer
measurements are made by these methods. Generally, flow measurement
in open channels is accomplished using a calculation or spot check, a
portable flow logger, or a permanent metering station.
There are several spot check methods for determining flows. The most
popular technique is the Manning equation, which relates level to flow.
For the Manning equation to be effective, there must be at least 250 ft
APPURTENANCES AND SPECIAL STRUCTURES 213

(60 m) of a straight course or channel, with 1,000 ft (300 m) preferred.
Other factors in the equation are the slope of the pipe and the coefficient
of roughness for the channel material (the coefficient of roughness is
available in Chapter 5 and in other technical manuals). Another crucial
requirement for the Manning equation is that the downstream flow be
unobstructed. If there is a downstream control device or other obstruc-
tion, the relationship between level and flow is destroyed [see p. 129 of
the Isco Flow Handbook (Grant and Dawson 1997)].
Another spot check is to measure the depth of flow with a ruler or level
probe and determine the velocity of the stream using a dye or other indi-
cator. Such a measurement is valid only if a reliable determination of
average flow depth and velocity can be made. In large sewers, and espe-
cially if depths can be measured at several manholes, quite precise results
can be obtained. At a flow of less than about 1 cfs (30 L/sec) in a sewer,
the results are likely to be uncertain.
Still another spot check method is the use of a dye (usually Rho-
damine) or a radioactive element, with subsequent sampling at a down-
stream point and analyses to determine the dilution of the tracer. It is
possible to secure very precise results by this method but only if the amount
of tracer added is accurately measured and the downstream concentration
is determined with a high degree of precision. It is a good method of cali-
brating any type of meter but it can be costly due to the sophisticated
equipment required and the skill required to perform the study.
Flow determinations can often be made at a pump station by timing
the filling of a wet well. If an average filling time is determined as well as
an average time of pumping out, calculations can be made of the pump-
ing rate. A time meter on the pump will then give a measure of total flow,
but the pumping rate must be checked from time to time since it may not
remain constant. In those types of pump time analyses, consideration
must be given to the discharge head pressures since some systems are
designed to operate on a force main discharge in place of a gravity flow
discharge. The residual pressure in the discharging force main signifi-
cantly impacts the pumping rate, thus adversely affecting the accuracy of
the timing method. It may be best to incorporate the use of noninvasive
external flow meters. The same wet well can be used for a simple draw-
down calculation where the volume of the wet well is calculated and the
differences in volume are noted over time. Some companies make special-
purpose data loggers that will calculate inflow and outflow from a pump
station using the wet well volume at various alarm (level switch) points
and pump run time. Importantly, these do not depend on pump perform-
ance curves for their flow calculation.
Since the mid-1980s, the area/velocity meter (Fig. 7-10) has become
increasingly popular for making temporary measurements in open chan-
nels. Most area/velocity flow meters are designed to operate on battery
214 GRAVITY SANITARY SEWER DESIGN AND CONSTRUCTION

power and hang in the sewer. They can be programmed for any channel
that can be defined mathematically. They are easy to install and their
accuracy can be quite good with the right site conditions. The same meter
can be moved and used at different sites as often as desired. Area/velocity
meters directly solve the continuity flow equation:
Q V A (flow rate velocity area).
These devices use Doppler ultrasonic frequency shift, electromagnetic
induction, or radar to measure fluid velocity. By using differential pres-
sure or ultrasonic pulses to measure the level, they can calculate what
percentage of the total available area is being used by the fluid at the time
of measurement. The user installs a single probe (although some manu-
facturers offer dual probes) in the flow stream and then programs the
electronics with the channel dimensions. Many types of channels are
available as menu choices. For example, the user selects Round Pipe and
then types in the diameter. The most popular version of the area/velocity
meter is a flow logger, which will take readings on a timed basis, log
these readings to an onboard data logger, then go back to sleep. The user
will download the data at selected intervals via direct connection to a
computer, via phone (landline or cellular), or via spread-spectrum radio.
The data is in digital form so it is easily displayed as charts, graphs, or
tables in computer software programs. Area/velocity meters are espe-
cially useful in surcharge conditions and reverse-flow conditions. Because
they measure level and velocity, events when the level is high but the
channel is not flowing will be sensed by the low, zero, or negative veloc-
ity measurement.
For a permanent metering station, the most traditional device for
obtaining a continuous flow record in a gravity sewer is a weir, using that
APPURTENANCES AND SPECIAL STRUCTURES 215
FIGURE 7-10. Area/velocity flow.

word in its general meaning of “an obstruction over which the water
flows.” In engineering practice in the United States, the word has come to
be associated mostly with the sharp-crested weir used for measuring flow
quantities, but a sharp crest is not universally implied. More common
today is the compound weir. One of the more popular compound weirs
for sewer flow will use a V-notch portion for lower flows, then one or
more rectangular weirs for increasing flows. Many of these weirs are
designed to minimize obstruction.
In flowing over a weir, the stream passes through a control section as
shown in Fig. 7-11. For any given flow, the elevation of the water surface
216 GRAVITY SANITARY SEWER DESIGN AND CONSTRUCTION
FIGURE 7-11. Various shapes of Palmer-Bowlus flume.

at the control section is such that the total energy (elevation plus kinetic
energy) is minimal. This section controls the upstream water elevation.
The upstream elevation near the weir is used as a measure of the dis-
charge over the weir, but the elevation reading needs to be increased by
the amount of the kinetic energy of the velocity of the water at the place of
measurement so as to obtain a figure for the total energy. Inherent in the
calculations is the assumption that there is no energy loss between the
point of measurement and the control section. Under extreme conditions
this assumption may entail a significant error.
In 1936 H. K. Palmer and Fred Bowlus, both engineers at the Los Ange-
les County Sanitation Districts, showed the advantage of a streamlined
weir (Palmer and Bowlus 1936). They devised a trapezoidal form which
came to be known as a Palmer-Bowlus flume (Fig. 7-11B). (They described
it as a Venturi flume, but it has little in common with the Venturi meters
used for closed-channel measurements.) Palmer-Bowlus flumes are avail-
able commercially in various sizes. Later, Bowlus devised a simple slab
form (unpublished work). Figure 7-11A shows a Bowlus weir constructed
for insertion into a 18-inch (450-mm) pipe. It is easily placed and easily
retrieved by means of a chain attached to the upstream toe. Portable weirs
of this type are used in sewers up to 27 inches (675 mm) in diameter, or
larger if there is access by an opening larger than a standard manhole.
Since this type of weir can be placed in a sewer without altering the
invert, it is particularly well-suited where it is necessary to construct a
metering station on an existing sewer. A Parshall flume, which is a widely
used form of a streamlined weir with dimensions generally in arbitrarily
fixed ratios, specifies a drop in the invert.
Ludwig and Ludwig (1951) and Wells and Gotaas (1958) experimented
with both the trapezoidal and slab-type streamlined weirs. They found
that these devices installed in sewers can meter flows up to 90% of the
sewer capacity and that the differences between actual flows and the flows
shown by the theoretically calculated rating curves were less than 3%.
Streamlined weirs have often been built in channels of rectangular
sections, and in some of these the control section has been produced by
merely constricting the sides, leaving the invert as a clear continuation
of the invert of the rectangular channel (Fig. 7-11C). Calculation of the
rating curve follows the same form as that for other rectangular stream-
lined weirs.
The theoretical equation for a rectangular streamlined weir is:
(any fully consistent units) (7-1)
in which Q is the flow, B is the width at the control section, g is the gravi-
tation constant, and H is the total energy of the stream (i.e., the elevation
QBgH
2
3
2
3
3
APPURTENANCES AND SPECIAL STRUCTURES 217

relative to the elevation of the crest of the weir plus the kinetic energy at
the same location). For a rectangular streamlined weir, the formula
reduces to:
Q 3.09 BH
3/2
(cfs) (7-2a)
or
Q 1.705 BH
3/2
(m
3
/sec) (7-2b)
The discharge over a sharp-crested weir is a few percent greater than
that shown by the calculations in the preceding equations because the
control section over the sharp crest is slanted slightly upstream. The Par-
shall flume has a discharge about 7% greater than that for a simple rectan-
gular shape. Empirically determined rating curves have been published
for Parshall flumes of various sizes.
Because of the wide utility of the Bowlus weir, a rating curve for it is
shown in Table 7-1 for a l-ft- (305-mm)-diameter pipe. The height of the
weir is one-quarter of the pipe diameter. It is assumed that the weir is
placed so that the critical section is in the outlet pipe from a manhole and
the depth measurement is made in a U-shaped channel in the manhole.
If the flow is very small it may be desirable to use a weir with a height
of less than one-quarter the pipe diameter. The Palmer-Bowlus trape-
zoidal flume has a height equal to one-eighth the diameter of the flume. If
the velocity of approach is too great, a weir height greater than one-quarter-
diameter may be used. A computer can easily be programmed to provide
a rating table for any chosen design.
The attainment of a critical flow condition over any type of weir is
essential if a correct measurement is to be obtained. Usually, this condi-
tion is ensured if a hydraulic jump is observed downstream. If the slope of
the pipe is such that the normal flow of the water is supercritical, a
hydraulic jump will be seen upstream from the weir instead of down-
stream as a result of the retardation of the stream approaching the weir.
Any kind of weir will cause some retardation of the upstream velocity.
Therefore, there may be some stranding of solids upstream. Usually this
is of no consequence, but if much grit accumulates it may materially
increase the upstream velocity and reduce the apparent discharge. This
effect is probably greater with a sharp-crested weir and may be minimal
with the Parshall flume and other weirs that do not have a raised bottom.
A wooden shovel or paddle may be used to move excessive accumula-
tions of sand over or through the streamlined weir.
Permanent metering stations are designed with vaults that provide
access to the hydraulic device for maintenance and calibration. The meas-
218 GRAVITY SANITARY SEWER DESIGN AND CONSTRUCTION

urement of water elevation upstream from the weir or flume may be made
with a streamlined float, provided that an arm or cords are used to hold it
in place. Quite commonly a float well is provided outside the channel,
sometimes outside the vault that houses the channel. The float well is con-
nected to the channel with a pipe generally in the size range of 0.5 to
1 inch (15 to 25 mm) in diameter, terminating in a smooth opening flush
with the wall of the channel. A major problem with float wells is the accu-
mulation of solids. Fresh water is provided for periodic or continuous
flushing of the well and connecting pipe. A drain is also useful in the bot-
tom of the float well. Safety of the fresh water supply is protected by an
APPURTENANCES AND SPECIAL STRUCTURES 219
TABLE 7-1. Rating Curve for Streamlined Bowlus Weir Placed
in Outlet Pipe of Manhole*
Q, in cubic feet Q, in cubic feet Q, in cubic feet
h or h/D per second h, in feet per second h, in feet per second
(1) (2) (3) (4) (5) (6)
0.05 0.031 0.26 0.43 0.47 1.13
0.06 0.041 0.27 0.45 0.48 1.17
0.07 0.052 0.28 0.48 0.49 1.21
0.08 0.064 0.29 0.51 0.50 1.25
0.09 0.077 0.30 0.54 0.51 1.29
0.10 0.091 0.31 0.57 0.52 1.33
0.11 0.106 0.32 0.60 0.53 1.37
0.12 0.121 0.33 0.63 0.54 1.41
0.13 0.138 0.34 0.66 0.55 1.45
0.14 0.155 0.35 0.70 0.56 1.49
0.15 0.174 0.36 0.73 0.57 1.53
0.16 0.193 0.37 0.76 0.58 1.58
0.17 0.213 0.38 0.80 0.59 1.62
0.18 0.233 0.39 0.83 0.60 1.66
0.19 0.255 0.40 0.87 0.61 1.70
0.20 0.277 0.41 0.90 0.62 1.74
0.21 0.300 0.42 0.94 0.63 1.79
0.22 0.324 0.43 0.98 0.64 1.83
0.23 0.348 0.44 1.01 0.65 1.87
0.24 0.373 0.45 1.05 0.66 1.91
0.25 0.399 0.46 1.09
*Height of the weir is D/4, in which D is the pipe diameter in feet. The calculated flows, Q, are for
a pipe 1 ft (305 mm) in diameter. For any other pipe size, use h/D in place of h, and multiply the
flows by D
5/2
.
Note: 1 ft 0.305 m; 1 cfs 8.3 L/sec.

air gap located higher than the highest water level under flooding condi-
tions, which generally means higher than the ground surface. A leveling
drain also should be provided, so arranged that when the connection to
the channel is shut off and the leveling valve is opened the water will dis-
charge to a sump or other low point until the level in the well exactly
equals the elevation of the crest of the weir.
An alternative to the float well is a bubble tube. The pressure required
to discharge air from the end of a pipe dipping into the water serves as a
measure of the depth of water at that point. The end of the pipe is usually
cut cleanly at a right angle to the axis of the pipe. The pipe may be per-
pendicular to the flow or it may be angled downstream so as to reduce the
accumulation of paper and stringy material. Erroneous results will be
obtained if the pipe angles upstream. Only a small air stream is needed; a
bubble every 5 to 10 seconds will suffice. Usually the air is supplied from
a pressure tank recharged from time to time by a compressor. For tempo-
rary installations, a cylinder of air or carbon dioxide is a convenient
source. Pressure sensors send signals that are converted to flow rates for
indication and recording. Usually the recorder is outside the vault to
escape the humid, corrosive atmosphere in the vault.
REFERENCES
Abraham, G. (1963). Jet diffusion in stagnant ambient fluid. Pub. No. 29, Delft
Hydraulics Laboratory, Delft, The Netherlands.
ASTM International (ASTM). (2007). “Standard specification for resilient connec-
tors between reinforced concrete manhole structures, pipes and laterals.”
ASTM Standard C 923-02 (active as of January, 2007), ASTM International,
West Conshohocken, Penn.
Brooks, N. H. (1960). “Diffusion of sewage effluent in an ocean current.” Proc. 1st
Conf. on Waste Disposal in Marine Environment, University of California, Berke-
ley, Pergamon Press Ltd., London.
Fair, G. M., and Geyer, J. C. (1954). Water supply and wastewater disposal, first ed.,
John Wiley & Sons, Inc., New York, N.Y.
Grant, D. M., and Dawson, B. D. (1997). Isco open channel flow measurement hand-
book, fifth ed., Teledyne Isco, Lincoln, Neb.
Gunnerson, C. G. (1961). “Marine disposal of wastes.” J. San. Engrg. Div. Proc.
ASCE, 87(SaAl), 23.
Ludwig, J. H., and Ludwig, R. G. (1951). “Design of Palmer-Bowlus flumes.”
Sewage and Industrial Wastes, 23, 1096.
Palmer, H. K., and Bowlus, F. D. (1936). “Adaption of Venturi flumes to flow
measurements in conduits.” Trans. ASCE, 101, 1195.
Pearson, E. A. (1956). An investigation of the efficacy of submarine outfall disposal of
sewage and sludge. Pub. No. 14, California Water Pollution Control Board, Sacra-
mento, Calif.
220 GRAVITY SANITARY SEWER DESIGN AND CONSTRUCTION

Pomeroy, R. D. (1960). “The empirical approach for determining the required
length of an ocean outfall.” Proc. 1st Conf. on Waste Disposal in Marine Environ-
ment, University of California, Berkeley, Pergamon Press Ltd., London.
Rawn, A. M., and Palmer, H. K. (1930). “Predetermining the extent of a sewage
field in sea water.” Trans. ASCE, 94, 1036.
Rawn, A. M., Bowerman, F. R., and Brooks, N. H. (1960). “Diffusers for disposal of
sewage in sea water.” J. San. Engrg. Div. Proc. ASCE, 86(SA2), 65.
Wells, E. A., Jr., and Gotaas, N. (1958). “Design of Venturi flumes in circular con-
duits.” Trans. ASCE, 123, 749.
APPURTENANCES AND SPECIAL STRUCTURES 221
This page intentionally left blank

8.1. INTRODUCTION
Pipe for sanitary sewer construction generally is manufactured from
various basic materials in accordance with nationally recognized product
specifications. Each type of sanitary sewer pipe, and its advantages and
limitations, should be evaluated carefully in the selection of pipe materials
for given applications.
Various factors are involved in the evaluation and selection of materials
for sewer construction and are dependent on the anticipated conditions of
service. Factors that may be involved and should be considered are:
• Intended use—type of wastewater.
• Scour or abrasion conditions.
• Installation requirements—pipe characteristics and sensitivities.
• Corrosion conditions—chemical, biological.
• Flow requirements—pipe size, velocity, slope, and friction coefficient.
• Infiltration/exfiltration requirements.
• Product characteristics—pipe size, fitting and connection require-
ments, laying length.
• Cost-effectiveness—materials, installation, maintenance, life expectancy.
• Physical properties—crush strength for rigid pipe, pipe stiffness or
stiffness factor for flexible pipe, soil conditions, pipe beam loading
strength, hoop strength for force main pipe, pipe shear loading
strength, pipe flexural strength.
• Handling requirements—weight, impact resistance.
No single pipe product will provide optimum capability in every charac-
teristic for all sanitary sewer design conditions. Specific application
CHAPTER 8
MATERIALS FOR SEWER CONSTRUCTION
223

requirements should be evaluated prior to selecting or specifying pipe
materials.
With the advancement of technology, new pipe materials are periodi-
cally being offered for use in sanitary sewer construction. Discussion of
pipe materials provided in this chapter has been limited to the commonly
accepted pipe materials currently available today for sanitary sewer
applications in new construction. These products are listed below, alpha-
betically within the two commonly accepted classifications of rigid pipe
and flexible pipe:
1. Rigid pipe
a. Concrete pipe
b. Vitrified clay pipe (VCP)
2. Flexible pipe
a. Ductile iron pipe (DIP)
b. Thermoplastic pipe
i. Acrylonitrile-butadiene-styrene (ABS)
ii. ABS composite
iii. Polyethylene (PE)
iv. Polyvinyl chloride (PVC)
c. Thermoset plastic pipe
i. Reinforced plastic mortar (RPM)
ii. Reinforced thermosetting resin (RTR)
d. Steel pipe
Materials utilized in rehabilitation of sanitary sewer lines include
many of the above as well as some newer materials. These materials are
discussed further in Chapter 12.
8.2. SEWER PIPE MATERIALS
8.2.1. Rigid Pipe
Sanitary sewer pipe materials in this classification derive a substantial
part of their basic earth load carrying capacity from the structural
strength inherent in the rigid pipe wall. Commonly specified rigid sani-
tary sewer pipe materials are discussed in the following subsections.
8.2.1.1. Concrete Pipe
Reinforced and nonreinforced concrete pipe and polymer concrete pipe
are used for gravity sanitary sewers. Reinforced concrete pressure pipe and
prestressed concrete pressure pipes are used for pressure sewers and force
mains as well as sanitary gravity sewers. Nonreinforced concrete pipe is
224 GRAVITY SANITARY SEWER DESIGN AND CONSTRUCTION

available in nominal diameters from 4 through 36 inches (100 through
900 mm). Reinforced concrete pipe is available in nominal diameters from
12 through 200 inches (300 mm through 5 m). Pressure pipe is available in
diameters from 12 through 120 inches (300 mm through 3 m). Polymer con-
crete pipe used for gravity sewers is available in diameters from 6 through
144 inches (150 mm through 3.6 m). Polymer concrete pipe is also used for
jacking and direct bury design. Concrete fittings and appurtenances such
as wyes, tees, and manhole sections are generally available. A number of
jointing methods are available depending on the tightness required and the
operating pressure. Various linings and coatings are available.
A number of mechanical processes are used in the manufacture of con-
crete pipe. These processes use various techniques, including centrifuga-
tion, vibration, and packing and tamping for consolidating the concrete in
forms. Gravity and pressure concrete pipe may be manufactured to any
reasonable strength requirement by varying the wall thickness, concrete
strength, and quantity and configuration of reinforcing steel or prestress-
ing elements (ACPA 1994).
Potential advantages of concrete pipe include:
• Wide range of structural and pressure strengths.
• Wide range of nominal diameters.
• Wide range of laying lengths [generally 4 to 24 ft (1.2 to 7.4 m)].
• Allows direct installation for microtunnelling (without casing).
Potential disadvantages of concrete pipe include:
• High weight.
• Susceptible to corrosion where acids are present; linings are gener-
ally required (except for polymer concrete pipe).
• Susceptible to shear and beam breakage when improperly bedded.
Concrete pipe is normally specified by nominal diameter, class or D-
load strength, and type of joint. The product should be manufactured in
accordance with one or more of the following standard specifications:
• Concrete Sewer, Storm Drain, and Culvert Pipe, ANSI/ASTM C14
• Reinforced Concrete Culvert, Storm Drain, and Sewer Pipe,
ANSI/ASTM C76
• Reinforced Concrete Arch Culvert, Storm Drain, and Sewer Pipe,
ANSI/ASTM C506
• Reinforced Concrete D-Load Culvert, Storm Drain, and Sewer Pipe,
ANSI/ASTM C655
• Reinforced Concrete Elliptical Culvert, Storm Drain, and Sewer
Pipe, ANSI/ASTM C507
MATERIALS FOR SEWER CONSTRUCTION 225

• Reinforced Concrete Low-Head Pressure Pipe, ANSI/ASTM C361
• Joints for Circular Concrete Sewer and Culvert Pipe, Using Rubber
Gaskets, ANSI/ASTM C443
• External Sealing Bands for Non-Circular Concrete Sewer, Storm
Drain, and Culvert Pipe, ANSI/ASTM C877
• Standard Specification for Manufacture of Reinforced Concrete
Sewer, Storm Drain and Culvert Pipe for Direct Design, ASTM C1417
Additional information relative to the selection and design of concrete
pipe may be obtained from the American Concrete Pipe Association
(ACPA) Concrete Pipe Design Manual (ACPA 1994) and Concrete Pipe
Handbook (ACPA 2000).
8.2.1.2. Vitrified Clay Pipe (VCP)
VCP is used for gravity sanitary sewers. The product is manufactured
from clay and shale. Clay pipe is vitrified at a temperature at which the
clay mineral particles become fused. The product is available in diameters
from 3 through 36 inches (75 through 900 mm) and in some areas up to
42 inches (1.05 m). Clay fittings are available to meet most requirements,
with special fittings manufactured on request. A number of jointing meth-
ods are available (NCPI 1995).
VCP is manufactured in standard and extra-strength classifications,
although in some areas the manufacture of standard-strength pipe is not
common in sizes 12-inch (300-mm) and smaller. The strength of VCP
varies with the diameter and strength classification. The pipe is manufac-
tured in lengths up to 10 ft (3 m).
Potential advantages of VCP include:
• High resistance to chemical corrosion.
• High resistance to abrasion.
• Wide range of fittings available.
Potential disadvantages of VCP include:
• Limited range of sizes available.
• High weight.
• Susceptible to shear and beam breakage when improperly handled
or bedded.
VCP is specified by nominal pipe diameter, strength, and type of joint.
The product should be manufactured and tested in accordance with one
or more of the following standard specifications:
• Standard Specification for Vitrified Clay Pipe, Extra Strength, Stan-
dard Strength and Perforated, ANSI/ASTM C700
226 GRAVITY SANITARY SEWER DESIGN AND CONSTRUCTION

• Compression Joints for Vitrified Clay Pipe and Fittings, ASTM
C425
• Pipe, Clay, Sewer, Federal Specification SS-P-361d
• Standard Methods of Testing Vitrified Clay Pipe, ANSI/ASTM 301
Additional information relative to the selection and design of VCP may be
obtained from the National Clay Pipe Institute (NCPI) Clay Pipe Engi-
neering Manual (NCPI 1995).
8.2.2. Flexible Pipe
Sanitary sewer pipe materials in this classification derive load-carrying
capacity from the interaction of the flexible pipe and the embedment soils
affected by the deflection of the pipe to the point of equilibrium under
load. Commonly specified flexible sanitary sewer pipe materials are dis-
cussed below.
8.2.2.1. Ductile Iron Pipe (DIP)
DIP is used for gravity and pressure sanitary sewers and force mains.
DIP is manufactured by adding cerium or magnesium to cast (gray)
iron just prior to the pipe casting process. The product is available in
nominal diameters from 4 through 64 inches (75 mm through 1350 mm)
and in lengths to 20 ft (6.1 m). Cast iron (gray iron) or ductile iron fit-
tings are used with DIP. Various jointing methods for the product are
available.
DIP is manufactured in various thicknesses, classes, and strengths. Lin-
ings for the interior of the pipe (e.g., cement mortar lining with asphaltic
coating, coal tar epoxies, epoxies, fusion-bonded coatings) may be speci-
fied. An exterior asphaltic coating and polyethylene exterior wrapping
are also commonly specified (DIPRA 2003).
Potential advantages of DIP include:
• Long laying lengths (in some situations).
• High pressure and load-bearing capacity.
• High impact strength.
• High beam strength.
Potential disadvantages of DIP include:
• Susceptible to corrosion where acids are present.
• Susceptible to chemical attack in corrosive soils.
• High weight (however, additional sacrificial material is available to
resist corrosion since the walls are thicker than necessary).
MATERIALS FOR SEWER CONSTRUCTION 227

DIP is specified by nominal diameter, class, lining, and type of joint.
DIP should be manufactured in accordance with one or more of the fol-
lowing standard specifications:
• Polyethylene Encasement for Gray and Ductile Cast-Iron Piping for
Water and Other Liquids, ANSI A21.5 (AWWA C105)
• Ductile Iron Gravity Sewer Pipe, ASTM A746
• Gray-Iron and Ductile Iron Fittings, 3 Inch through 48 Inch, for
Water and Other Liquids, ANSI/AWWA C110
• American National Standard for Rubber-Gasket Joints for Ductile-
Iron Pressure Pipe and Fittings, ANSI/AWWA C111/A21.11
• American National Standard for Protective Fusion-Bonded Epoxy
Coatings for the Interior and Exterior Surfaces of Ductile-Iron and
Gray-Iron Fittings for Water Supply Service, ANSI/AWWA C116/
A21.16
• American National Standard for the Thickness Design of Ductile-
Iron Pipe, ANSI/AWWA C150/A21.50
• Cement Mortar Lining for Cast-Iron and Ductile-Iron Pipe and Fit-
tings for Water, ANSI A21.4 (AWWA C104)
Additional information relative to the selection and design of DIP may be
obtained from the Ductile Iron Pipe Research Association (DIPRA) at
www.dipra.org.
8.2.2.2. Thermoplastic Pipe
Thermoplastic materials include a broad variety of plastics that can be
repeatedly softened by heating and hardened by cooling through a tem-
perature range characteristic for each specific plastic. Thermoplastic pipe
product design should be based on long-term data. Generally, thermoplas-
tic materials used in sanitary sewers are limited to acrylonitrile-butadiene-
styrene (ABS), polyethylene (PE), and polyvinyl chloride (PVC).
8.2.2.2.1. Acrylonitrile-Butadiene-Styrene (ABS) Pipe
ABS pipe is used for both gravity and pressure sanitary sewers. Non-
pressure-rated ABS sewer pipe is available in nominal diameters from
3 through 12 inches (75 through 300 mm) and in lengths up to 35 ft (11.2 m).
A variety of ABS fittings and several jointing systems are available.
ABS pipe is manufactured by extrusion of ABS plastic material. ABS
gravity sanitary sewer pipe is available in three dimension ratio (DR) clas-
sifications (23.5, 35, and 42) depending on nominal diameter selected. The
classifications relate to three pipe stiffness values, PS 150, 45 and 20 psi (PS
1000, 300, and 150 kPa), respectively. The DR is the ratio of the average
outside diameter to the minimum wall thickness of the pipe.
228 GRAVITY SANITARY SEWER DESIGN AND CONSTRUCTION

Potential advantages of ABS pipe include:
• Light weight.
• Long laying lengths (in some situations).
• High impact strength.
• Ease in field cutting and tapping.
Potential disadvantages of ABS pipe include:
• Limited range of sizes available.
• Subject to environmental stress cracking.
• Subject to excessive deflection when improperly bedded and
haunched.
• Subject to attack by certain organic chemicals.
• Subject to surface change effected by long-term ultraviolet exposure.
ABS pipe is specified by nominal diameter, dimension ratio, pipe stiff-
ness, and type of joint. ABS pipe should be manufactured in accordance
with one or more of the following specifications:
• Acrylonitrile-Butadiene-Styrene (ABS) Sewer Pipe and Fittings,
ANSI/ASTM D2751
• Solvent Cement for Acrylonitrile-Butadiene-Styrene (ABS) Plastic
Pipe and Fittings, ANSI/ASTM D2235
• Elastomeric Seals (Gaskets) for Joining Plastic Pipe, ANSI/ASTM F477
• Joints for Drain and Sewer Plastic Pipes Using Flexible Elastomeric
Seals, ANSI/ASTM D3212
• PVC and ABS Injected Solvent Cemented Plastic Pipe Joints, ANSI/
ASTM F545
8.2.2.2.2. Acrylonitrile-Butadiene-Styrene (ABS) Composite Pipe
ABS composite pipe is used for gravity sanitary sewers. The product
is available in nominal diameters from 8 through 15 inches (200 through
375 mm) and in lengths from 6.25 to 12.5 ft (2 to 4 m). ABS fittings are
available for the product. The jointing systems available include elas-
tomeric gasket joints and solvent cemented joints.
ABS composite pipe is manufactured by extrusion of ABS plastic mate-
rial with a series of truss annuli that are filled with filler material such as
lightweight Portland cement concrete.
Potential advantages of ABS composite pipe include:
• Light weight.
• Long laying lengths (in some situations).
• Ease in field cutting.
MATERIALS FOR SEWER CONSTRUCTION 229

Potential disadvantages of ABS composite pipe include:
• Limited range of sizes available.
• Susceptible to environmental stress cracking.
• Susceptible to rupture when improperly bedded.
• Susceptible to attack by certain organic chemicals.
• Susceptible to surface change effected by long-term ultraviolet
exposure.
ABS composite pipe is specified by nominal diameter and type of joint.
ABS composite pipe should be manufactured in accordance with one or
more of the following standard specifications:
• Acrylonitrile-Butadiene-Styrene (ABS) Composite Sewer Piping,
ANSI/ASTM D2680
• Solvent Cement for Acrylonitrile-Butadiene-Styrene (ABS) Plastic
Pipe and Fittings, ANSI/ASTM D2235
• Joints for Drain and Sewer Plastic Pipes Using Flexible Elastomeric
Seals, ANSI/ASTM D3212
• Elastomeric Seals (Gaskets) for Joining Plastic Pipe, ANSI/ASTM F477.
8.2.2.2.3. Polyethylene (PE) Pipe
PE pipe is used for gravity and pressure sanitary sewers and force
mains. Nonpressure PE pipe, primarily used for sewer relining, is avail-
able in nominal diameters from 4 through 48 inches (100 mm through
1200 mm). PE fittings are available. Jointing is primarily accomplished by
butt-fusion or flanged adapters, with bell and spigot sometimes used.
PE pipe is manufactured by extrusion of PE plastic material. Nonpres-
sure PE pipe is produced at this time in accordance with individual man-
ufacturers’ product standards.
Potential advantages of PE pipe include:
• Long laying lengths (in some situations).
• Light weight.
• High impact strength.
• Ease in field cutting.
Potential disadvantages of PE pipe include:
• Relatively low tensile strength and pipe stiffness.
• Limited range of diameters available.
• Susceptible to environmental stress cracking.
• Susceptible to excessive deflection when improperly bedded and
haunched.
230 GRAVITY SANITARY SEWER DESIGN AND CONSTRUCTION

• Susceptible to attack by certain organic chemicals.
• Susceptible to surface change effected by long-term ultraviolet
exposure.
• Special tooling required for fusing joints.
PE pipe is specified by material designation, nominal diameter (in-
side or outside), standard dimension ratios, and type of joint. PE pipe
should be manufactured in accordance with one or more of the following
specifications:
• Butt Heat Fusion Polyethylene (PE) Plastic Fittings for Polyethylene
(PE) Plastic Fittings for Polyethylene (PE) Pipe and Tubing, ANSI/
ASTM D3261
• Polyethylene (PE) Plastic Pipe (SDR-PR), ANSI/ASTM D2239
• Polyethylene (PE) Plastic Pipe (SDR-PR) Based on Controlled Outside
Diameter, ASTM D3035
• Large Diameter Profile Wall Sewer Pipe, ASTM F894
8.2.2.2.4. Polyvinyl Chloride (PVC) Pipe
PVC pipe is used for both gravity and pressure sanitary sewers. Non-
pressure PVC sewer pipe is available in nominal diameters from 4
through 48 inches (100 through 1,220 mm). PVC pressure and nonpres-
sure fittings are available. PVC pipe is generally available in lengths up to
20 ft (6.1 m). Jointing is primarily accomplished with elastomeric seal gas-
ket joints, although solvent cement joints for special applications are
available (Uni-Bell 2001).
PVC pipe is manufactured by extrusion of the plastic material. Non-
pressure PVC sanitary sewer pipe is provided in two dimension ratios
(DR 35 and 26) that relate to two pipe stiffness values, PS 46 and 115 psi
(PS 320 and 800 kPa), respectively.
Potential advantages of PVC pipe include:
• Light weight.
• Long laying lengths (in some situations).
• High impact strength.
• Ease in field cutting and tapping.
Potential disadvantages of PVC pipe include:
• Subject to attack by certain organic chemicals.
• Subject to excessive deflection when improperly bedded and
haunched.
• Subject to surface changes effected by long-term ultraviolet
exposure.
MATERIALS FOR SEWER CONSTRUCTION 231

PVC pipe is specified by nominal diameter, dimension ratio, pipe stiff-
ness, and type of joint. PVC pipe should be manufactured in accordance
with one or more of the following standard specifications:
• Type PSM Poly(Vinyl Chloride) (PVC) Sewer Pipe and Fittings,
ANSI/ASTM D3034
• Type PSP Poly(Vinyl Chloride) (PVC) Sewer Pipe and Fittings,
ANSI/ASTM D3033
• Elastomeric Seals (Gaskets) for Joining Plastic Pipe, ANSI/ASTM F477
• Joints for Drain and Sewer Plastic Pipes Using Flexible Elastomeric
Seals, ANSI/ASTM D3212
• PVC and ABS Injected Solvent Cemented Plastic Pipe Joints, ANSI/
ASTM F545
• Solvent Cements for Poly(Vinyl Chloride) (PVC) Plastic Pipe and
Fittings, ANSI/ASTM D2564
• Standard Specification for Polyvinyl Chloride (PVC) Large Diame-
ter Plastic Gravity Sewer Pipe and Fittings, ASTM F679
• Polyvinyl Chloride (PVC) Profile Gravity Sewer Pipe & Fittings
Based on Controlled Inside Diameter, ASTM F794
• Polyvinyl Chloride (PVC) Closed Profile Gravity Sewer Pipe & Fit-
tings Based on Controlled Inside Diameter, ASTM F1803
Additional information relative to the selection and design of PVC pipe
may be obtained from the Uni-Bell Handbook of PVC Pipe—Design and
Construction (Uni-Bell 2001).
8.2.2.3. Thermoset Plastic Pipe
Thermoset plastic materials include a broad variety of plastics. These
plastics, after having been cured by heat or other means, are substantially
infusible and insoluble. Thermoset plastic pipe product design should be
based on long-term data. Generally, thermoset plastic materials used in
sanitary sewers are provided in two categories—reinforced plastic mortar
(RPM) and reinforced thermosetting resin (RTR).
8.2.2.3.1. Reinforced Plastic Mortar (RPM) Pipe
RPM pipe is used for both gravity and pressure sewers. RPM pipe is
available in nominal diameters from 8 through 144 inches (200 mm
through 3600 mm). In smaller diameters, RPM fittings are generally
available; in larger diameters, RPM fittings are manufactured as
required. A number of jointing methods are available. Various methods
of interior protection (e.g., thermoplastic or thermosetting liners or coat-
ings) are available.
232 GRAVITY SANITARY SEWER DESIGN AND CONSTRUCTION

RPM pipe is manufactured containing fibrous reinforcements, such as
fiberglass, and aggregates, such as sand embedded in or surrounded by
cured thermosetting resin.
Potential advantages of RPM pipe include:
• Light weight.
• Long laying lengths (in some situations).
Potential disadvantages of RPM pipe include:
• Susceptible to strain corrosion in some environments.
• Susceptible to excessive deflection when improperly bedded and
haunched.
• Susceptible to attack by certain organic chemicals.
• Susceptible to surface change effected by long-term ultraviolet
exposure.
RPM pipe is specified by nominal diameter, pipe stiffness, stiffness fac-
tor, beam strength, hoop tensile strength, lining or coating, thermosetting
plastic material, and type of joint. RPM pipe should be manufactured in
accordance with one or more of the following standard specifications:
• Reinforced Plastic Mortar Sewer Pipe, ANSI/ASTM D3262
• Reinforced Plastic Mortar Sewer and Industrial Pressure Pipe,
ASTM D3754
8.2.2.3.2. Reinforced Thermosetting Resin (RTR) Pipe
RTR pipe is used for both gravity and pressure sanitary sewers. RTR
pipe is generally available in nominal diameters from 1 through 12 inches
(25 through 300 mm), manufactured in accordance with ASTM standard
specifications. The product is also available in nominal diameters from 12
through 144 inches (300 mm through 3600 mm), manufactured in accor-
dance with individual manufacturers’ specifications. In small diameters,
RTR fittings are available; in larger diameters, RTR fittings are manufac-
tured as required. A number of jointing methods are available, including
flush bell and spigot. Various methods of interior protection (e.g., ther-
moplastic or thermosetting liners or coatings) are available.
RTR pipe is manufactured using a number of methods, including cen-
trifugal casting, pressure laminating, and filament winding. In general,
the product contains fibrous reinforcement materials, such as fiberglass,
embedded in or surrounded by cured thermosetting resin.
Potential advantages of RTR pipe include:
• Light weight.
• Long laying lengths (in some situations).
MATERIALS FOR SEWER CONSTRUCTION 233

Potential disadvantages of RTR pipe include:
• Susceptible to strain corrosion in some environments.
• Susceptible to excessive deflection when improperly bedded and
haunched.
• Susceptible to attack by certain organic chemicals.
• Susceptible to surface change effected by long-term ultraviolet
exposure.
• Higher cost than PVC.
RTR pipe is specified by nominal diameter, pipe stiffness, lining and
coating, method of manufacture, thermosetting plastic material, and type
of joints. RTR pipe should be manufactured in accordance with one or
more of the following standard specifications:
• Filament-Wound Reinforced Thermosetting Resin Pipe, ASTM D2996
• Centrifugally Cast Reinforced Thermosetting Resin Pipe, ANSI/
ASTM D2997
• Machine-Made Reinforced Thermosetting Resin Pipe, ASTM D2310
8.2.2.4. Corrugated Steel Pipe
Steel pipe is rarely used for sanitary sewers. When used, it usually is
specified with interior protective coatings or linings (polymeric, bitumi-
nous, asbestos, etc.). It is not recommended for use in sanitary sewer sys-
tems. Steel pipe is fabricated in diameters from 8 through 120 inches (200 mm
through 3 m). Appurtenances include tees, wyes, elbows, and manholes
fabricated from steel. Various linings and coatings are available (AISI
1994). Steel is generally manufactured in lengths up to 40 ft (12.2 m).
Potential advantages of steel pipe include:
• Light weight.
• Long laying lengths (in some situations).
Potential disadvantages of steel pipe include:
• Susceptible to corrosion where acids are present.
• Susceptible to chemical attack in corrosive soils.
• Difficulty in making lateral connections.
• Poor hydraulic coefficient (unlined corrugated steel pipe).
• Susceptible to excessive deflection when improperly bedded or
haunched.
• Susceptible to turbulence abrasion.
Steel pipe is specified by size, shape, wall profile, gage or wall thickness,
and protective coating or lining.
234 GRAVITY SANITARY SEWER DESIGN AND CONSTRUCTION

8.3. PIPE JOINTS
8.3.1. General Information
The requirement for the control of ground water infiltration and waste-
water exfiltration in sanitary sewer systems renders the specification of
pipe joint design essential to proper sanitary sewer design. A substantial
variety of pipe joints are available for the different pipe materials used
in sanitary sewer construction. A common requirement that must be
imposed on the design of all sanitary sewer systems, regardless of the type
of sewer pipe specified, is the use of reliable, tight pipe joints. A good pipe
joint must be watertight, root-resistant, flexible, durable, and easily assem-
bled in the field. In current practice, various forms of gasket (elastomeric
seal) pipe joints are used in sanitary sewer construction. They generally
can be assembled by unskilled labor in a broad range of weather condi-
tions and environments with good assurance of a reliable, tight seals.
Water infiltration/exfiltration testing or air exfiltration testing is com-
monly specified for typical nonpressure sanitary sewer system construc-
tion to demonstrate that infiltration/exfiltration is within acceptable limits.
(The subject of infiltration/exfiltration testing is discussed in Chapter 6.)
8.3.2. Types of Pipe Joints
Commonly specified sanitary sewer pipe joints are described in the fol-
lowing subsections.
8.3.2.1. Gasket Pipe Joints
Gasket joints effect a seal against leakage through compression of an
elastomeric seal or ring. Gasket pipe joint design is generally divided into
two types: push-on pipe joint and mechanical compression pipe joint.
8.3.2.1.1. Push-on Pipe Joint
This type of pipe joint uses a continuous elastomeric ring gasket that is
compressed into an annular space formed by the pipe, fitting or coupler
socket, and the spigot end of the pipe, thereby providing a positive seal
when the pipe spigot is pushed into the socket. When using this type of
pipe joint in pressure sanitary sewers, thrust restraint may be required to
prevent joint separation under pressure. Push-on pipe joints (fittings, cou-
plers, or integral bells) are available on nearly all pipe products mentioned.
8.3.2.1.2. Mechanical Compression Pipe Joint
This type of pipe joint uses a continuous elastomeric ring gasket that
provides a positive seal when the gasket is compressed by means of a
MATERIALS FOR SEWER CONSTRUCTION 235

mechanical device. When using this type of pipe joint in pressure sanitary
sewers, thrust restraint may be required to prevent joint separation under
pressure. This type of pipe joint may be provided as an integral part of
DIP. When incorporated into a coupler, this type of pipe joint may be
used to join two similarly sized plain spigot ends of any commonly used
sewer pipe materials.
8.3.2.2. Cement Mortar Pipe Joint
This type of pipe joint involves use of shrink-compensating cement
mortar placed into a bell-and-spigot pipe joint to provide a seal. The use
of this joint is discouraged in that reliable, watertight joints are not
assured. Cement mortar joints are not flexible and may crack due to any
pipe movement. This type of joint is used on concrete gravity and pres-
sure pipe to protect otherwise exposed steel.
8.3.2.3. Elastomeric Sealing Compound Pipe Joints
Elastomeric sealing compound may be used in jointing properly pre-
pared concrete gravity sanitary sewer pipe. Pipe ends must be sand-
blasted and primed for elastomeric sealant application. The sealant—a
thixotropic, two-compound elastomer—is mixed on the job site and
applied with a caulking gun and spatula. The pipe joint, when assembled
with proper materials and procedures, provides a positive seal against
leakage in gravity sewer pipe.
8.3.2.4. Solvent Cement Pipe Joints
Solvent cement pipe joints may be used in jointing thermoplastic pipe
materials such as ABS, ABS composite, and PVC pipe. This type of pipe
joint involves bonding a sewer pipe spigot into a sewer pipe bell or cou-
pler using solvent cement. Solvent cement joints can provide a positive
seal provided the proper cement is applied under proper ambient condi-
tions with proper techniques. Reference should be made to ASTM F402
for safe handling procedures. Required precautions should be taken to
ensure adequate trench ventilation and protection for workers installing
the pipe. Solvent cement pipe joints may be desired in special situations
and with some plastic fittings.
8.3.2.5. Heat Fusion Pipe Joints
Heat fusion pipe joints are commonly specified for PE sanitary sewer
pipe and are now being used on some PVC pipe. The general method of
jointing PE sanitary sewer pipe involves butt fusion of the pipe lengths,
end-to-end. After the ends of two lengths of PE pipe are trimmed and
softened to a melted state with heated metal plates, the pipe ends are
236 GRAVITY SANITARY SEWER DESIGN AND CONSTRUCTION

forced together to the point of butt fusion, providing a positive seal (Plas-
tics Pipe Institute, undated). The pipe joint does not require thrust restraint
in pressure applications. Trained technicians with special apparatus are
required to achieve reliable, watertight pipe joints.
8.3.2.6. Mastic Pipe Joints
Mastic pipe joints are frequently used for special, nonround shapes of
concrete gravity sewer pipe that are not adaptable for use with gasket pipe
joints. The mastic material is placed into the annular space to provide a
positive seal. Application may be by troweling, caulking, or by the use of
preformed segments of mastic material m a manner similar to gaskets. Sat-
isfactory performance of the pipe joints depends upon the proper selection
of primer, mastic material, and good workmanship in application.
8.3.2.7. Sealing Band Joints
External sealing bands of rubber made in conformance with ASTM
C877 are also used on noncircular concrete sewer pipe. These elastomeric
bands are wrapped tightly around the exterior of the pipe at the joint and
extend several inches (centimeters) on each side of the joint. Sealing
against the concrete is achieved by mastic applied to one side of the band.
8.4. SUMMARY
With consideration of appropriate factors essential to the proper
design of sanitary sewer systems, it is apparent that the broad variety of
materials for sanitary sewer construction available is a source of signifi-
cant benefit. Each sewer pipe product and each type of pipe joint offers
distinct advantages that can prove to be specifically beneficial in given
applications. Each sewer pipe product and each type of pipe joint also
presents limitations that must be understood for proper system design for
given applications.
REFERENCES
American Iron and Steel Institute (AISI). (1994). Handbook of steel drainage and high-
way construction products, AISI, Washington, D.C.
American Concrete Pipe Association (ACPA). (2000). Concrete pipe handbook,
ACPA, Irving, Tex.
ACPA. (1994). Concrete pipe design manual, ACPA, Irving, Tex. Available on the
ACPA web site www.concrete-pipe.org/designmanual.htm, accessed Novem-
ber 7, 2006.
MATERIALS FOR SEWER CONSTRUCTION 237

ASTM International (ASTM). (2005). “Safe handling of solvent cements used for
joining thermoplastic pipe and fittings,” ASTM F402, ASTM, Philadelphia, Penn.
Committee of the Great Lakes-Upper Mississippi River Board of State Sanitary
Engineers (GLUMRB). (2006). Recommended standards for sewage works, GLUMRB
Health Education Services, Albany, N.Y.
Ductile Iron Pipe Research Association (DIPRA). (2003). Handbook—Ductile iron
pipe, DIPRA, Birmingham, Ala. Available on the DIPRA web site www.dipra
.org, accessed November 7, 2006.
Institute for Hydromechanic and Hydraulic Structures (IHHS). (1973). Wear data of
different pipe materials at sewer pipelines, IHHS, Technical University of Darm-
stadt, Darmstadt, West Germany.
National Clay Pipe Institute (NCPI). (1995). Clay pipe engineering manual, NCPI,
Washington, D.C. Available on the NCPI web site www.ncpi.org/engineer
.htm, accessed November 7, 2006.
Plastics Pipe Institute. (Undated). “Underground installation of polyethylene pip-
ing,” New York, N.Y.
Uni-Bell PVC Pipe Association (Uni-Bell). (2001). Handbook of PVC pipe—Design
and construction, Uni-Bell, Dallas, Tex. Available on the Uni-Bell web site
www.uni-bell.org/pubs/handbook.pdf, accessed November 7, 2006.
238 GRAVITY SANITARY SEWER DESIGN AND CONSTRUCTION

9.1. GENERAL
The structural design and load analysis of buried sewers is essentially a
problem of soil–structure interaction. The influence of each factor is
dependent on the stiffness of the structure relative to the soil, and two
major categories of pipe have been defined:
• Rigid pipe
• Flexible pipe
Pipe materials in the rigid category may include concrete, reinforced
concrete, clay, fiber cement, and cast-in-place pipe. Pipe materials in the
flexible category may include thermoplastic plastic, thermosetting plastic,
corrugated steel, corrugated aluminum, and ductile iron. Flexible pipe
has historically been designed for the installed condition, whereas rigid
pipe has been designed for a test load condition and then correlated with
an assumed earth pressure distribution for the installed condition. How-
ever, advances in analytical methods and computer technology enable
both categories of pipe to be designed for the installed condition.
The theory of loads and supporting strength of buried pipe was devel-
oped more than 70 years ago and refined over the years as additional data
became available. The theory referred to as the Marston-Spangler Theory
is based on a detailed earth load analysis for specifically defined installa-
tions and a semi-empirical, simplified interpretation of earth pressure dis-
tribution around the pipe for each type of installation. For rigid pipe, the
load-carrying capacity of the pipe is established by an in-plant, three-
edge-bearing (T.E.B.) test load. Under this test load condition, the pipe is
subjected to a concentrated line load with high stresses induced within
CHAPTER 9
STRUCTURAL REQUIREMENTS
239

the pipe wall. This test load condition is then correlated with the more
favorable and less severe installed load condition by means of a bedding
factor. The bedding factor values developed under the Marston-Spangler
Theory do not reflect current construction practices and methods. Design-
ing directly for the installed condition enables evaluation of the actual
stresses induced in the pipe for a known external pressure distribution;
then, by applying the principles of engineering mechanics, the pipe can be
structurally designed based on stress analysis similar to the design of all
other structures.
The designs of rigid and flexible pipes are treated separately in this Man-
ual. There are no specific design procedures given for flexible pipes of inter-
mediate stiffness. For such cases, design procedures (such as computer
analysis based on soil–structure interaction or the designs for rigid or flexi-
ble pipe) may be used (not interchangeably) for conservative results.
Because installation conditions have such an important effect on both
load and supporting strength, a satisfactory sewer construction project
requires accurate assumed design conditions for the job site. Therefore,
this chapter also includes recommendations for construction and field
observations to obtain this goal.
This chapter does not include information of design of cast-in-place
reinforced concrete sewer pipe sections. Reference should be made to
standard textbooks and to American Concrete Institute (ACI)/ASTM
specifications or industry handbooks for such design data.
9.2. LOADS ON SEWERS CAUSED BY GRAVITY EARTH FORCES
9.2.1. Earth Loads
Sanitary sewers are normally installed in a relatively narrow trench
excavated in undisturbed soil and then covered with backfill to the pro-
posed ground level. In this type of installation, the backfill material will
tend to settle downward relative to the undisturbed soil in which the
trench is excavated. This relative settlement of backfill generates upward
friction forces, causing an arching action of the backfill which relieves the
load on the pipe, such that the load is equal to the weight of the prism of
backfill within the trench minus the upward friction forces. For narrow
trenches the backfill load is less than the weight of the prism of backfill
over the pipe. As the trench width is increased for any given pipe size,
backfill material, and trench depth, a limiting width is reached beyond
which the trench width no longer affects the backfill load. The trench
width at which this condition occurs is defined as the transition width.
Once the transition width is realized, the backfill load is a maximum and
remains constant regardless of any further increase in the trench width.
240 GRAVITY SANITARY SEWER DESIGN AND CONSTRUCTION

For the Direct Design procedure described below, a detailed earth load
analysis is not conducted but, rather, the backfill load is related to the
weight of the prism of backfill over the pipe multiplied by a vertical arch-
ing factor, varying from 1.35 to 1.45.
The backfill or fill load on buried pipe depends on the installation, and
standard installations have been defined for rigid pipe and flexible pipe.
The earth load on flexible pipe is determined as equal to the weight of the
prism of earth over the pipe and is given by the equation:
W
e
wHD
0
(9-1)
where
W
e
the vertical earth load, lb/ft (N/m)
w unit weight of soil, lb/ft
3
(kg/m
3
)
H design height of earth above top of pipe, ft (m)
D
0
outside diameter of pipe, ft (m).
The earth load on rigid pipe is determined as equal to the weight of the
prism of earth over the pipe increased by a vertical arching factor (VAF)
from 1.35 to 1.45, depending on the standard installation type, and is
given by the equation:
W
e
VAF [wD
0
] [H (0.107D
0
)] (9-2)
The variables are the same as for Eq. (9-1). Figure 9-1 shows the difference
between these two loading conditions.
9.2.2. Marston-Spangler Load Analysis
9.2.2.1. General
The loads given above may be used with the various design methods
outlined by the pipe manufacturing associations and by ASCE to calculate
required pipe strengths. Many times these calculations are integrated into
STRUCTURAL REQUIREMENTS 241
FIGURE 9-1. Earth loads on pipe.

a computer program designed for a particular piping material. These
methods, which are specific to various piping organizations, are outlined
in greater detail below.
Although these Direct Design methods are typically preferred, there
may be times when the older Marston-Spangler load analysis may be pre-
ferred. Marston developed methods for determining the vertical load on
buried conduits caused by soil forces in all of the most commonly encoun-
tered construction conditions (Marston and Anderson 1913; Marston
1930). These methods are historically based on both theory and experi-
ment and have generally achieved acceptance as being useful and reli-
able, although perhaps overly conservative.
In general, the theory states that the load on a buried pipe is equal to
the weight of the prism of soil directly over it, called the interior prism,
plus or minus the frictional shearing forces transferred to that prism by
the adjacent prisms of soil—the magnitude and direction of the frictional
forces being a function of the relative settlement between the interior and
adjacent soil prisms. The theory makes the following assumptions:
• The calculated load is the load that will develop when ultimate set-
tlement has taken place.
• The magnitude of the lateral pressures that induce the shearing
forces between the interior and adjacent soil prisms is computed in
accordance with Rankin’s theory.
The general form of Marston’s equation is:
W CB
2
(9-3)
in which W is the vertical load per unit length acting on the sewer pipe
because of gravity soil loads, is the unit weight of soil; B is the trench
width or sewer pipe width, depending on installation conditions; and C
is a dimensionless coefficient that marries the effect of the following
variables:
• The ratio of the height of fill to width of trench or sewer pipe.
• The shearing forces between interior and adjacent soil prisms.
• The direction and amount of relative settlement between interior
and adjacent soil prisms for embankment conditions.
9.2.2.2. Types of Loading Conditions
Although the general form of Marston’s equation includes all the fac-
tors necessary to analyze all types of installation conditions, it is conven-
ient to classify these conditions, write a specialized form of the equation,
242 GRAVITY SANITARY SEWER DESIGN AND CONSTRUCTION

and prepare separate graphs and tables of coefficients for each. In per-
forming a Marston-Spangler load analysis, there are three types of open-
cut installation methods. These are:
• Trench.
• Negative-projecting embankment.
• Positive-projecting embankment.
Figure 9-2 shows the various types of installation.
Trench conditions are defined as those in which a sewer pipe is
installed in a relatively narrow trench cut in undisturbed ground and cov-
ered with soil backfill to the original ground surface.
Embankment conditions are defined as those in which the sewer pipe
is covered above the original ground surface or when a trench in undis-
turbed soil is so wide that trench wall friction does not affect the load on
the sewer pipe. The embankment classification is further subdivided into
two major subclassifications—positive-projecting and negative-projecting.
Sewer pipes are defined as positive-projecting when the top of the sewer
pipe is above the original adjacent ground surface. Negative-projecting
sewer pipe is that installed with the top of the sewer pipe below the adja-
cent original ground surface in a trench which is narrow with respect to
the size of pipe and the depth of cover, as shown on Fig. 9-2, and when the
STRUCTURAL REQUIREMENTS 243
FIGURE 9-2. Classification of construction conditions.

native material is of sufficient strength that the trench shape can be main-
tained dependably during placement of the embankment.
A special case, called the induced trench condition, may be employed to
minimize the load on a conduit under an embankment of unusual height.
9.2.2.3. Loads for Trench Conditions
This type of installation is normally used in the construction of sewers,
drains, and water mains. The pipe is installed in a relatively narrow
trench excavated in undisturbed soil and then covered with backfill
extending to the ground surface. The vertical soil load to which a sewer
pipe in a trench is subjected is the resultant of two major forces. The first
is produced by the mass of the prism of soil within the trench. The second
is the friction or shearing forces generated between the undisturbed soil
outside the trench and the backfill placed within the trench.
The backfill soil has a tendency to settle in relation to the undisturbed
soil in which the trench is excavated. This downward movement or ten-
dency for movement induces upward shearing forces which support a part
of the weight of the backfill. Thus, the resultant load on the horizontal plane
at the top of the sewer pipe within the trench is equal to the weight of the
backfill minus these upward shearing forces, as illustrated in Fig. 9-3.
244 GRAVITY SANITARY SEWER DESIGN AND CONSTRUCTION
FIGURE 9-3. Load-producing forces. P, Weight of backfill ABCD; F, Upward
shearing forces on AC and BD; and W
c
P 2F.

Unusual conditions may be encountered in which poor natural soils
may effect a change from trench to embankment conditions with consid-
erably increased load on the sewer pipe. This is covered in the next sub-
section.
In general, the weight of backfill is given by:
W
c
C
d
wB
d
2
(9-4)
where
W
c
load, lb/ft (N/m)
w density of backfill material, lb/ft
3
(kg/m
3
)
B
d
width of trench at top of pipe, ft (m)
and
(9-5)
For this equation, H is the height of backfill material above the pipe (feet
or meters); K Rankine’s ratio of active lateral unit pressure to vertical
unit pressure; and tan , the coefficient of friction between fill mate-
rial and the sides of the trench. Rankine’s ratio is defined as:
(9-6)
where tan the coefficient of internal friction of backfill material
( may be equal to or less than , but never greater than .) The value of
C
d
for various ratios of H/B
d
and various types of soil backfill may be
obtained from Fig. 9-4.
Typical values of K are:
K0.1924 Max. for granular materials without cohesion
K0.165 Max. for sand and gravel
K0.150 Max. for saturated top soil
K0.130 Max. for ordinary clay
K0.110 Max. for saturated clay.
The trench load formula, Eq. (9-4), gives the total vertical load on a hori-
zontal plane at the top of the sewer pipe. If the sewer pipe is rigid, it will
carry practically all of this load. If the sewer pipe is flexible and the soil at
the sides is compacted to the extent that it will deform under vertical load
K
2
2
1
1
1
1
sin
sin
C
e
K
d
K
H
B
d
1
2
2−
′
′
STRUCTURAL REQUIREMENTS 245

less than the sewer pipe itself will deform, the side fills may be expected
to carry their proportional share of the total load. Under these circum-
stances, the trench load formula may be modified to:
W
c
C
d
wB
c
B
d
(9-7)
in which B
c
is the outside width of the pipe, in feet or meters. It must be
emphasized that Eq. (9-7) is applicable only if the backfill is compacted as
described above. The equation should not be used merely because the
pipe is a flexible type.
The term “side fill” refers to the soil backfill that is placed between the
sides of sewer pipe and the sides of the trench. The character of this mate-
246 GRAVITY SANITARY SEWER DESIGN AND CONSTRUCTION
FIGURE 9-4. Computation diagram for soil loads on trench installations (sewer
pipe completely buried in trench).

rial and the manner of its placement have two important influences on the
structural behavior of a sewer pipe.
First, the side fill may carry a part of the total vertical load on the hori-
zontal plane at the elevation of the top of the sewer pipe. Second, the side
fill plays an important role in helping the sewer pipe carry vertical load.
Every pound (newton) of force that can be brought to bear against the
sides of an elastic ring increases the ability of the ring to carry the vertical
load by nearly the same amount.
Examination of Eq. (9-4) indicates the important influence the width of
the trench exerts on the load as long as the trench condition formula
applies. This influence has been verified by extensive experimental evi-
dence. These experiments have also indicated that the width of the trench
at the top of the sewer pipe is the controlling factor.
The width of the trench below the top of the sewer pipe is also impor-
tant. It must not be permitted to exceed the safe limit for the strength of the
sewer pipe and class of bedding used. The minimum width must be consis-
tent with the provision of sufficient working space at the sides of the sewer
pipe to assemble joints properly, to insert and strip forms, and to compact
backfill. The engineer must establish and allow reasonable tolerances in
width for variations in field conditions and accepted construction practice.
As defined previously, the transition width occurs at a certain limiting
value at which the backfill load reaches a maximum and remains con-
stant, regardless of any increase in the width of the trench. There are suf-
ficient experimental data at hand to show that it is safe to calculate the
imposed load by means of the trench-conduit formula [Eq. (9-4)] for all
widths of trench less than that which gives a load equal to the load calcu-
lated by the projecting-conduit formula (discussed in Section 9.2.2.4. on
embankment conditions). In other words, as the width of the trench
increases (other factors remaining constant), the load on a rigid sewer
pipe increases in accordance with the theory for a trench sewer pipe until
it equals the load determined by the theory for a projecting sewer pipe.
The width of the trench at which this transition occurs may be deter-
mined from Fig. 9-5 (Schlick 1932). The curves in Fig. 9-5 are calculated
for sand and gravel, where K0.165, but can be used for other types
of soil because the change with varying values of K is small. In any
event, the engineer can check by calculating loads for both trench and
embankment conditions. There is little research on the appropriate value
of r
sd
p (the projection ratio times the settlement ratio) to use in the appli-
cation of the transition width concept. In the absence of specific informa-
tion, a value of 0.5 is suggested as a reasonably good working value.
These quantities are defined in the subsection on loads for embankment
conditions.
It is advisable, in the structural design of sewers, to evaluate the effect
of the transition width on both the design criteria and the construction
STRUCTURAL REQUIREMENTS 247

latitude. A contractor may wish, for example, to place well points for
drainage in the trench. In another scenario, the trench walls may need to
be sloped to meet Occupational Safety and Health Administration
(OSHA) requirements for trench safety. If either of these scenarios
requires a wider trench than usual, a stronger sewer pipe or higher class
of bedding may be necessary.
To comply with OSHA requirements, it may be advantageous to exca-
vate the trench with sloping sides in undeveloped areas where no incon-
248 GRAVITY SANITARY SEWER DESIGN AND CONSTRUCTION
FIGURE 9-5. Values of B
d
/B
c
at which pipes in trench and projecting pipe load
formulas have equal loads.
Schlick, W. J. (1932). “Loads on pipe in wide ditches.” Bulletin 108, Iowa
Engineering Experiment Station, Ames, Iowa, courtesy of American Con-
crete Pipe Association, Irving, Tex.

venience to the public or danger to property, buildings, subsurface struc-
tures, or pavements, will result. A subtrench, as shown in Fig. 9-6, may be
used in such cases to minimize the load on the pipe. When sheeting of the
subtrench at the pipe is necessary, it should extend about 1.5 ft (0.5 m)
above the top of the pipe.
Loads on sewer pipe in sheeted trenches should be calculated from a
trench width measured to the outside of the sheeting if the sheeting is
pulled, or to the inside if it is left in place. Voids created by removal of the
sheeting should be backfilled with a flowable material such as pea gravel
or flowable concrete fill.
If a shield or trench box is used in sewer pipe-laying operations, the
shield or box width controls the width of the trench at the top of the sewer
pipe. This width, with a small addition for the space needed to advance
the shield without a large friction loss, should be the width factor used in
computing loads on the sewer pipe. Extreme care must be taken when
advancing the shield in the trench to prevent pipe joints from pulling
apart and disturbance of the pipe bedding.
Sanitary sewers that are to be constructed in sloping-side trenches with
the slopes extending to the invert or to any plane above the invert, but
below the top of the sewer, should be designed for loads computed by
using the actual width of the trench at the top of the sewer pipe, or by the
projecting sewer formula (covered in Section 9.2.2.4.)—whichever gives
the least load on the sewer pipe.
If for any reason the trench becomes wider than that specified and for
which the sewer pipe was designed, the load on the sewer pipe should be
checked and a stronger sewer pipe or higher class of bedding should be
used, if necessary.
STRUCTURAL REQUIREMENTS 249
FIGURE 9-6. Examples of subtrenches.
Courtesy of American Concrete Pipe Association, Irving, Tex.

Sample Calculations
Example 9-1. Determine the load on a 24-inch-diameter rigid sewer pipe
under 14 ft of cover in trench conditions.
Assume that the sewer pipe wall thickness is 2 inches; B
c
24 4
28 inches 2.33 ft; B
d
2.33 2.00 4.33 ft; and w 120 lb/ft
3
for satu-
rated top soil backfill. Then H/B
d
14/4.33 3.24; C
d
(from Fig. 9-4)
2.1; and W
c
2.1 120 (4.33)
2
4,720 lb/ft (68,880 N/m).
Example 9-2. Determine the load on the same-sized sewer laid on a con-
crete cradle and with trench sheeting to be removed.
Assume that the wall thickness is 2 inches; the cradle projection outside
of the sewer pipe is 8 inches (4 inches on each side); and the maximum
clearance between cradle and outside of sheeting is 14 inches. Then B
d
24 (2 2 inches) 8 (2 14) 64 inches 5.33 ft.
As this seems to be an extremely wide trench, a check should be made
on the transition width of the trench; B
c
2.33 2.33 ft; H 14 ft; r
sd
p
0.5; and H/B
c
14/2.33 6.
From Fig. 9-5, B
d
/B
c
2.39 (the ratio of the width of the trench to the
width of the sewer at which loads are equal by both trench sewer theory
and projecting-sewer theory); B
d
2.33 2.39 5.57 5.33; H/B
d
14/5.33 2.63; C
d
(from Fig. 9-4) 1.85; and W
c
1.85 120 (5.33)
2
6,300 lb/ft (91,700 N/m).
Example 9-3. Determine the load on the same sewer if (rough) sheeting is
left in place.
B
d
becomes 4 inches less 5 ft; H/B
d
14/5 2.8; C
d
(from Fig. 9-4)
1.92; and W
c
1.92 120 (5)
2
5,750 lb/ft (84,040 N/m).
Example 9-4. Determine the load on a 30-inch-diameter flexible sewer pipe
installed in a trench 4 ft, 6 inches wide at a depth of 12 ft.
Assume the soil is clay weighing 120 lb/ft
3
and that it will be well-
compacted at the sides of the sewer pipe. Then H 12 ft; B
d
4.5 ft; B
c
2.5 ft; H/B
d
2.67; C
d
1.9; and W
c
1.9 120 4.5 2.5 2,565 lb/ft
(37,450 N/m).
For conservative design, the prism load should be determined. The
prism load on flexible sewer pipe will be W 2.5 12 120 3,600 lb/ft
(52,460 N/m).
9.2.2.4. Loads for Positive-Projecting Embankment Conditions
This type of installation is normally used when the pipe is installed in a
relatively flat stream bed or drainage path. The pipe is installed on the
original ground or compacted fill, and then covered by an earth fill or
embankment.
250 GRAVITY SANITARY SEWER DESIGN AND CONSTRUCTION

The load on a positive-projecting sewer pipe is equal to the weight of
the prism of soil directly above the structure, plus (or minus) vertical
shearing forces which act on vertical planes extending upward into the
embankment from the sides of the sewer pipe. For an embankment instal-
lation of sufficient height, these vertical shearing forces may not extend to
the top of the embankment, but terminate in a horizontal plane at some
elevation above the top of the sewer pipe known as the “plane of equal
settlement,” as shown in Fig. 9-7.
The shear increment acts downward when (s
m
s
g
) (s
f
d
c
) and vice
versa. In this expression, s
m
is the compression of the columns of soil of
height pB
c
; s
g
is the settlement of the natural ground adjacent to the sewer
pipe; s
f
is the settlement of the bottom of the sewer pipe; and d
c
is the
deflection of the sewer pipe.
The location of the plane of equal settlement is determined by equating
the total strain in the soil above the pipe to that in the side fill plus the set-
tlement of the critical plane. When the plane of equal settlement is an
imaginary plane above the top of the embankment (i.e., shear forces
extend to the top of the embankment), the installation is called either
“complete trench condition” or “complete projection condition,” depend-
ing on the direction of the shear forces. When the plane of equal settlement
STRUCTURAL REQUIREMENTS 251
FIGURE 9-7. Settlements that influence loads on positive-projecting sewer
pipe. s
g
, settlement of natural ground adjacent to sewer pipe; s
m
, compression of
columns of soil of height pB
c
; d
c
, deflection of sewer pipe; and s
f
, settlement of
bottom of sewer pipe.
Courtesy of American Concrete Pipe Association, Irving, Tex.

is located within the embankment as shown in Fig. 9-7, the installation is
called an “incomplete trench condition” or “incomplete projection condi-
tion,” as shown in Fig. 9-8.
In computing the settlement values, the effect of differential settle-
ment caused by any compressible layers below the natural ground sur-
face also must be considered. An exceptional situation for a sewer pipe in
a trench can be encountered where the natural soil settles more than the
trench backfill, such as where the natural soils are organic or peat and the
trench backfill is relatively incompressible compacted fill. A more com-
mon situation is where the sewer pipe is pile-supported in organic soils.
In such cases, the load on the sewer pipe is greater than that of the prism
above the pipe, and down-drag loads should be considered in the design
of the piles.
9.2.2.4.1. Fill Loads
The fill load on a pipe installed in a positive-projecting embankment
condition is computed by the equation:
W
c
C
c
wB
c
2
(9-8)
252 GRAVITY SANITARY SEWER DESIGN AND CONSTRUCTION
FIGURE 9-8. Diagram for coefficient C
c
for positive-projecting sewer pipes.
Courtesy of American Concrete Pipe Association, Irving, Tex.

where
W
c
load, lb/ft (N/m)
w density of backfill material, lb/ft
3
(kg/m
3
)
B
c
outside horizontal span of the pipe, ft (m)
and
(9-9)
and
(9-10)
The settlements that influence loads on positive-projecting embankment
installations are shown in Fig. 9-7. To evaluate the H
e
term in Eq. (9-9), it is
necessary to determine, numerically, the relationship between the pipe
deflection and the relative settlement between the prism of fill directly
above the pipe and the adjacent soil. This relationship is defined as a set-
tlement ratio, expressed as:
(9-11)
where s
g
is the settlement of the natural ground adjacent to the sewer pipe,
s
m
is the compression of the columns of soil of height pB
c
, (s
m
s
g
) is the
settlement of the critical plane, s
f
is the settlement of the bottom of the
sewer pipe, and d
c
is the deflection of the sewer pipe.
The fill load on a pipe installed in a positive-projecting embankment
condition is influenced by the product of the settlement ratio, r
sd
, and the
projection ratio, p. The projection ratio p is the vertical distance the pipe
projects above the original ground surface, divided by the outside vertical
height of the pipe (B
c
). Recommended settlement ratio design values are
listed in Table 9-1.
Figure 9-8 is a graphical solution by Spangler that permits reasonable
estimates of C
c
for various conditions of H/B
c
r
sd
and p. Since the effect of
is nominal, K was assumed to be 0.19 for the projection condition
and 0.13 for the trench condition. Figure 9-8 will provide an estimate of
C
c
, which is well within the accuracy of the theoretical assumptions.
In Fig. 9-8, the family of straight lines represents the incomplete condi-
tions, whereas the curves represent the complete conditions. The straight
r
ss sd
s
sd
mg
f
c
m
()()−
C
e
K
H
B
H
B
eHH
c
K
H
B
c
e
c
K
H
B
e
c
e
c
−
−
⎛
⎝
⎜
⎞
⎠
⎟
2
2
1
2
when
C
e
K
HH
c
K
H
B
e
c
−
−
2
1
2
when
STRUCTURAL REQUIREMENTS 253

lines intersect the curves where H
e
equals H. These diagrams can be used
to determine the minimum height of fill for which the plane of equal set-
tlement will occur within the soil mass.
Where the r
sd
p product is zero, the load coefficients term C
c
is equal to
H/B
c
. Substituting this value in Eq. (9-8) results in the load, W
c
, being equal
to the weight of fill above the pipe. For positive values of r
sd
p, the load on
the pipe will be greater than the weight of fill above the pipe, and for neg-
ative values the load will be less than the weight of fill above the pipe.
9.2.2.5. Loads for Negative-Projecting Embankment
and Induced Trench Conditions
This type of installation is normally used when the pipe is installed in
a relatively narrow or deep stream bed or drainage path. The pipe is
installed in a shallow trench of such depth that the top of the pipe is
below the natural ground surface or compacted fill, then covered with an
earth fill or embankment which extends above the original ground level.
Sometimes straw, hay, cornstalks, sawdust, or similar materials may be
added to the trench backfill to augment the settlement of the interior
prism. The greater the value of the negative projection ratio, p, and the
more compressible the trench backfill over the sewer pipe, the greater will
be the settlement of the interior prism of soils in relation to the adjacent
fill material. In using this technique, the plane of equal settlement must
fall below the top of the finished embankment. This action generates
upward shearing forces which relieve the load on the sewer pipe.
An induced trench sewer pipe, as illustrated in Fig. 9-9, is first installed
as a positive-projecting sewer pipe. The embankment then is built up to
some height above the top and is thoroughly compacted as it is placed. A
trench of the same width as the sewer pipe is next excavated directly over
the sewer pipe down to or near its top. This trench is refilled with loose,
compressible material and the balance of the embankment is completed in
a normal manner.
254 GRAVITY SANITARY SEWER DESIGN AND CONSTRUCTION
TABLE 9-1. Recommended Design Values of r
sd
Type of Sewer Pipe Soil Conditions Settlement Ratio, r
sd
Rigid Rock or unyielding foundation 1.0
Rigid Ordinary foundation 0.5 to 0.8
Rigid Yielding foundation 0 to 0.5
Rigid Negative-projecting installation 0.3 to 0.5
Flexible Poorly compacted side fills 0.4 to 0
Flexible Well-compacted side fills 0

The fill load on a pipe installed in a negative-projecting embankment
condition is computed by the equation:
W
c
C
n
wB
d
2
(9-12)
where
W
c
load, lb/ft (N/m)
w density of backfill material, lb/ft
3
(kg/m
3
)
B
d
width of the trench, ft (m)
and
(9-13)
and
(9-14)
C
e
K
H
B
H
B
eHH
n
K
H
B
d
e
d
K
H
B
e
d
e
d
−
−
−
−
⎛
⎝
⎜
⎞
⎠
⎟
2
2
1
2
when
C
e
K
HH
n
K
H
B
e
d
−
−
−
2
1
2
when
STRUCTURAL REQUIREMENTS 255
FIGURE 9-9. Induced trench pipe.

If the material within the subtrench is densely compacted, Eq. (9-12)
can be expressed as:
W
c
C
n
wB
d
B
d
(9-15)
where B
d
is the average of the trench width and the outside diameter of
the pipe.
In the case of the induced trench sewer pipe, B
c
is substituted for B
d
in
Eq. (9-12). B
c
is the width of the sewer pipe in feet or meters, assuming the
trench in the fill is no wider than the sewer pipe.
The settlements that influence loads on negative-projecting embank-
ment installations are shown in Fig. 9-10. To evaluate the H
e
term in Eqs.
(9-13) and (9-14), it is necessary to determine, numerically, the relation-
ship between the pipe deflection and the relative settlement between the
prism of fill directly above the pipe and the adjacent soil. This relationship
is defined as a settlement ratio, expressed as:
(9-16)
r
sssd
s
sd
g
d
f
c
d
()
256 GRAVITY SANITARY SEWER DESIGN AND CONSTRUCTION
FIGURE 9-10. Settlements that influence loads on negative-projecting sewer pipes.

Recommended settlement ratio design values are listed in Table 9-1.
For negative-projecting embankment installations, the projection ratio, p,
is the vertical distance from the top of the pipe to the original ground sur-
face or compacted fill, at the time of installation, divided by the width of
the trench.
In general, the notation for calculation of loads on negative-projection
conditions follows that given for positive projections. The depth of the
top of pipe below the critical plane is defined by pB
d
, in which p is
defined as the negative projection ratio. If the natural ground surface is
on a transverse slope, the vertical distance may be taken as the average
distance from the top of the pipe to the top of the trench, at both sides of
the trench. Furthermore, s
d
is defined as the compression within the fill,
for height pB
d
.
Present knowledge of the value of the settlement ratio for induced
trench sewer pipe is meager. Research reported by Taylor (1971) of the
Illinois Department of Highways indicated that the measured settlement
ratio of 48-inch (1,200-mm) reinforced concrete pipe culvert installed
under induced trench conditions under 30 ft (9 m) of fill, varied from
0.25 to 0.45.
Figure 9-11 provides values of C
n
versus H/B
d
for various values of r
sd
,
for values of p equal to 0.5, 1, 1.5, and 2. For other values of p between 0.5
and 2, values of C
n
may be obtained by interpolation. As with the previ-
ous figures, only one value of K is used. The family of straight lines rep-
resents the incomplete conditions, whereas the curves represent the com-
plete conditions. The straight lines intersect the curves at the point where
the height of the plane of equal settlement, H
e
, equals the height of the top
of embankment, H. These diagrams can therefore be used to determine
the height of the plane of equal settlement above the top of the pipe.
9.2.2.6. Sewer Pipe under Sloping Embankment Surfaces
Cases arise where the sewer pipe has different heights of fill on the two
sides because of the sloping surface of the embankment or when an
embankment exists on one side of the sewer pipe only. Design based on
the larger fill height may not yield conservative values. When yielding
ground may envelope the sewer pipe, a surcharge on one side of the
sewer pipe may result in vertical displacement.
Sample Calculations
Example 9-5. Determine the load on a 48-inch-diameter reinforced con-
crete sewer pipe installed as a positive-projecting pipe under a fill 32 ft
high above the top of the pipe. The wall thickness of the sewer pipe is
5 inches and the density of fill is 125 lb/ft
3
.
STRUCTURAL REQUIREMENTS 257

Assume the projection ratio is 0.5 and the settlement ratio is 0.6.
Then H 32 ft; B
c
4.83 ft; H/B
c
6.63; r
sd
p 0.5 0.6 0.3; C
c
(from
Fig. 9-8) 9.2; and W
c
9.2 125 (4.83)
2
26,800 lb/ft (392,300 N/m).
Example 9-6. Determine the load on the sewer pipe of Example 9-5 when
installed as a negative-projecting sewer pipe in a trench whose depth is
such that the top of the sewer pipe is 7 ft below the surface of the natural
ground in which the trench is dug. The width of the trench is 2 ft greater
than the outside diameter of the sewer pipe.
258 GRAVITY SANITARY SEWER DESIGN AND CONSTRUCTION
FIGURE 9-11. Diagrams for coefficient C
n
for negative-projecting and induced
trench sewer pipes.

Assume the settlement ratio 0.3. Then H 32 ft; B
d
4.83 2
6.83 ft; H/B
d
4.69; p 1; C
n
(from Fig. 9-11) 3; and W
c
3 125
(6.83)
2
17,500 lb/ft (255,950 N/m).
Example 9-7. Determine the load on the sewer pipe of Example 9-5 when
installed as an induced trench sewer pipe with its top 2.5 ft below the ele-
vation to which the soil is compacted thoroughly for a distance of 12 ft on
each side of the sewer pipe.
Assume the settlement ratio 0.3. Then H 32 ft; B
c
4.83; H/B
c
6.63; papproximately 0.5; C
n
(from Fig. 9-11) 4.8; and W
c
4.8
125 (4.83)
2
14,000 lb/ft (204,300 N/m).
9.2.2.7. Loads for Trenchless Installation Conditions
This type of installation is used where surface or other conditions prohibit
installation of the pipe by conventional open-cut methods or where it is nec-
essary to install the pipe under an existing embankment. The theories set
forth in this Manual will usually be appropriate for materials where jacking
of the sewer pipe is possible and for tunnels in homogeneous soils of low
plasticity. Where a tunnel is to be constructed through materials subject to
unusually high internal pressures and stresses, such as some types of clay or
shales which tend to squeeze or well, or through blocky and seamy rock, the
loads on the sewer pipe cannot be determined from the factors discussed
here. Reference should be made to the following section on tunnels.
Horizontal directional drilling (HDD) and microtunneling have become
very common since the last edition of this Manual. Each of these methods
imposes its own type of loads on the pipe being installed. In the past, HDD
pipe engineering has focused primarily on installation techniques. Because
HDD installations are not typically utilized for gravity sanitary sewers, the
design guidance is not covered in this Manual. For specific projects that
may utilize HDD, the reader is advised to consult ASTM F1962, Standard
Guide for Use of Maxi-Horizontal Directional Drilling for Placement of
Polyethylene Pipe or Conduit Under Obstacles, Including River Crossings,
and the ASCE Manual of Practice 108, Pipeline Design for Installation by
Directional Drilling. Pipe installed by microtunneling can be treated simi-
larly to pipe installed by pipe jacking, utilizing the appropriate equations
herein. (Jacked sewer pipe is assumed to carry the earth load as it is pushed
into place [“Jacked-in-Place Pipe Drainage” 1960; ACPA 1960].)
The various trenchless methods of constructing sanitary sewers are
described in Chapter 12.
9.2.2.7.1. Load-Producing Forces
For the materials considered in this Manual, the vertical load acting on
the jacked sewer pipe or tunnel supports, and eventually the sewer pipe
in the tunnel, is the resultant of two major forces. First is the weight of the
overhead prism of earth within the width of the jacked sewer pipe or
STRUCTURAL REQUIREMENTS 259

tunnel excavation. Second is the shearing forces generated between the
interior prisms and the adjacent material caused by the internal friction
and cohesion of soils.
During excavation of a tunnel, and varying somewhat with construc-
tion methods, the soil directly above the face of the tunnel tends to settle
slightly in the period immediately after excavation and prior to placement
of the tunnel support. Also, the tunnel supports and the sewer pipe must
deflect and settle slightly when the vertical load comes on them. This
downward movement or tendency for movement induces upward shear-
ing forces which support a part of the weight of the prism of earth above
the tunnel. In addition, the cohesion of the material provides further sup-
port for the weight of the prism of earth above the tunnel. The resultant
load on the horizontal plane on the top of the tunnel and within the width
of the tunnel excavation is equal to the weight of the prism of earth above
the tunnel minus the upward friction forces and cohesion of the soil along
the limits of the prism of soil over the tunnel.
Hence, the forces involved with gravity earth loads on jacked sewer
pipe or tunnels in such soils are similar to those described for loads on
sewer pipe in trenches, except for the cohesion of the material. Cohesion
also exists in the case of loads in trenches and embankments, but is neg-
lected because the cohesion of the disturbed soil is of minor consequence
and may be absent altogether if the soil is saturated. However, in the case
of jacked sewer pipe or in tunnels where the soil is undisturbed, cohesion
can be an appreciable factor in the loads and may be considered safely if
reasonable coefficients are assumed.
Jacking stresses must be investigated in pipe that is to be jacked into
place. The critical section is at the pipe joint where the transfer of stress
from one pipe to the adjacent pipe occurs. Jointing materials should be
used which will provide uniform bearing around the pipe circumference
(ACPA 1960). Thrust at the joint is usually transmitted through the
tongue or groove, but not both. Concrete stress in the tongue or groove
should be checked and additional reinforcements for both longitudinal
and bending stresses provided if required.
9.2.2.7.2. Marston’s Formula
The earth load on a pipe installed under these conditions is computed
by the equation:
W
t
C
t
wB
t
2
2cC
t
B
t
(9-17)
where
W
t
load, lb/ft (N/m)
w density of soil material, lb/ft
3
(kg/m
3
)
B
t
maximum width of the tunnel excavation, ft (m)
B
c
in the case of jacked pipe
c cohesion coefficient, lb/ft
2
(N/m
2
)
260 GRAVITY SANITARY SEWER DESIGN AND CONSTRUCTION

and
(9-18)
In Eq. (9-17), the C
t
wB
t
2
term is similar to the trench equation (9-4) for
trench loads, except that H is the distance from the ground surface to the
top of the tunnel, and B
t
is substituted for B
d
. The 2cC
t
B
t
term accounts for
the cohesion of the undisturbed soil. Conservative design values of the
coefficient of cohesion for various soils are listed in Table 9-2. To obtain
C
e
K
t
K
H
B
t
1
2
2−
′
′
STRUCTURAL REQUIREMENTS 261
FIGURE 9-12. Sewer pipe in tunnel.
TABLE 9-2. Recommended Safe Values of Cohesion
Values of c
Material kPa lb/ft
2
Clay, very soft 2 40
Clay, medium 12 250
Clay, hard 50 1,000
Sand, loose dry 0 0
Sand, silty 5 100
Sand, dense 15 300
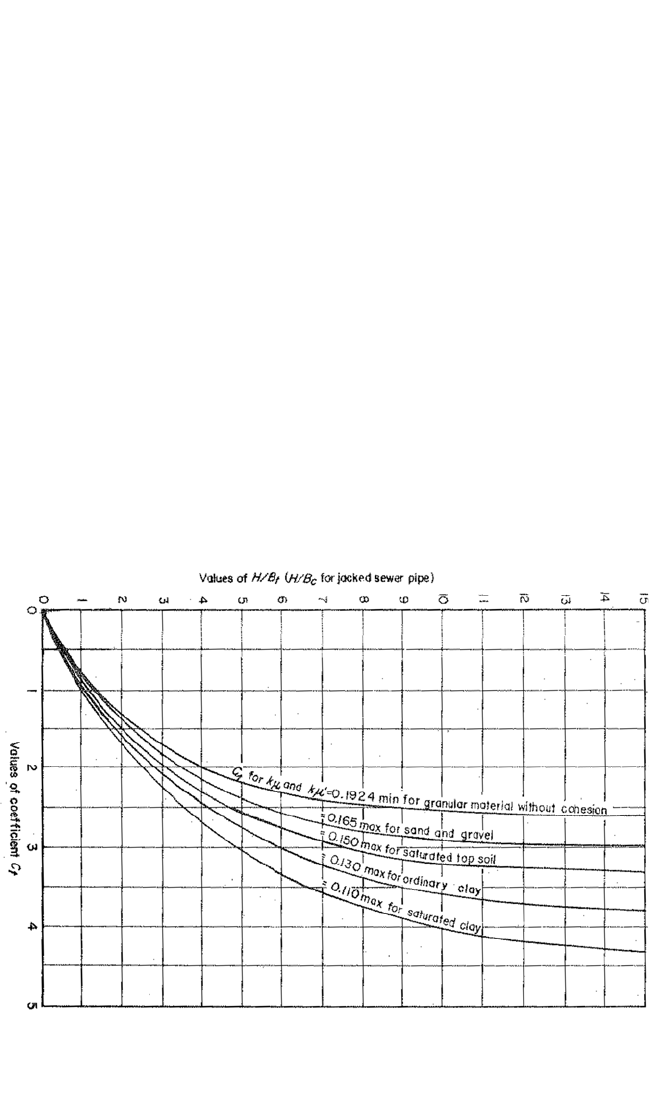
the total earth load for any given height of cover, width of bore or tunnel,
and type of soil, the value of the cohesion term is subtracted from the
value of the trench load term.
The values of the coefficient for C
t
for various ratios of H/B
t
and various
materials can be obtained from Fig. 9-13 or Fig. 9-4. Values of K and K
are the same as those noted in Fig. 9-4. An analysis of the formula for com-
puting C
t
indicates that for very high values of H/B
t
, the coefficient C
t
approaches the limiting value of 1/(2K). Hence, when the tunnel is very
deep, the load on the tunnel can be calculated readily by using the limit-
ing value of C
t
.
In addition to the earth loads, axial loads encountered during installa-
tion must be considered. In estimating axial loads, it is necessary to pro-
vide for a uniform distribution of the jacking force around the periphery
of the pipe. This can be accomplished either through maintaining close
tolerances for parallelism of the ends of the pipe; by providing a spacer of
plywood or rubber; or by ensuring the jacking forces are distributed
through a jacking frame to the pipe parallel to the axis of the pipe. Under
most circumstances, the cross-sectional area of the pipe wall will be ade-
quate to resist the pressures encountered.
262 GRAVITY SANITARY SEWER DESIGN AND CONSTRUCTION
FIGURE 9-13. Diagram for coefficient C
t
for jacked sewer pipe or tunnels in
undisturbed soil.

To calculate the jacking force required, the forces that arise from the
site conditions and the construction methods have to be analyzed. The
forces resulting from site conditions include:
• Size, shape, mass and external surface of the pipe.
• The length of the jacking/microtunneling operation.
• Type of soil (or soils) that will be encountered over the length of
the drive.
• Position of the water table.
• Stability of the soil.
• Depth and mass of the overburden.
• Vibratory loading.
Factors that can be controlled during the construction process and that
impact the jacking force include:
• Amount of overcut of the bore.
• The use of lubricants, such as bentonite.
• Misalignment of the pipeline along the length of the bore.
• Rate of advancement of pipeline.
• Frequency and duration of stoppages.
Once the jacking forces have been calculated, the forces relating to the
advancement of the cutting head and shield must be added. The informa-
tion must be given to the pipe manufacturer to ensure that pipe of proper
strength and joint end area is supplied.
9.2.2.7.3. Tunnel Soil Characteristics
The discussion regarding unit weight and coefficient of friction for san-
itary sewers in trenches applies equally to the determination of earth
loads on jacked sewer pipe or sewer pipe in tunnels through undisturbed
soil. The one additional factor that enters into the determination of loads
on tunnels is c, the coefficient of cohesion. An examination of Eq. (9-17)
shows that the proper selection of c is very important; unfortunately, it
can vary widely even for similar types of soils.
It may be possible in some instances to obtain undisturbed samples of
the material and to determine the value of c by appropriate laboratory
tests. Such testing should be done whenever possible. It is suggested that
conservative values of c be used to allow for a saturated condition of the
soil or for other unknown factors. Design values should probably be
about 33% of the laboratory test value to allow for uncertainties. Recom-
mended safe values of cohesion for various soils (if it is not practicable to
determine c from laboratory tests) are shown in Table 9-2.
STRUCTURAL REQUIREMENTS 263

It is suggested that the value of c be taken as zero in the zone subject to
seasonal frost and cracking because of desiccation or loss of strength from
saturation. In addition, a minimum value for (wB
t
2c) should be assumed
in cases where 2c approaches wB
t
. In many cases, the jacking force neces-
sary to install the pipe will govern.
9.2.2.7.4. Effect of Excessive Excavation
Where the tunnel is constructed by a method that results in excessive
excavation and where the voids above the sewer pipe or tunnel lining are
not backfilled carefully, or packed with grout or other suitable backfill
materials, saturation of the soil or vibration eventually may destroy the
cohesion of the undisturbed material above the sewer pipe and result in
loads in excess of those calculated using Eq. (9-17). If this situation is
anticipated, it is suggested that Eq. (9-17) be modified by eliminating the
cohesion term. The calculated loads then will be the same as those
obtained from Eq. (9-4).
9.2.2.7.5. Loads for Tunnels
When the sanitary sewer is to be constructed in a tunnel through homo-
geneous soils of low plasticity, design should be based on the theories set
forth in the previous section describing jacked sewer pipe. The design of
tunnels through other types of materials is discussed in this section. The
usual procedure in tunnel construction is to complete the excavation first
and then place either a cast-in-place concrete liner or a sewer pipe, and
then grout or concrete it in place. Additional strength in such a section can
be obtained by means of pressure grouting to strengthen the surrounding
material instead of relying totally on the liner or pipe itself. Tunnel loads
are therefore usually determined for purposes of selecting supports to be
used during excavation, and the sewer pipe or cast-in-place liner is
designed primarily to withstand loads from pressure grouting.
A complete discussion of tunnels is not within the scope of this Man-
ual, and the design engineer’s attention is called to references listed at the
end of this chapter (USACE undated; Proctor and White 1968; “Soil Resis-
tance” 1948; Van Iterson 1948).
Sample Calculation
Example 9-8. Assume the width of excavation, B
t
78 inches 6.5 ft; type
of soil is silty sand (K0.150, c 100 lb/ft
2
, and w 110 lb/ft
3
); and
the depth of the tunnel, H 40 ft. Then H/B
t
40/6.5 6.15 and C
t
(from
Fig. 9-14) 2.83. Employing Eq. (9-17), W
t
2.83 6.5 (110 6.5 2
100); or W
t
9,500 lb/ft (138,300 N/m).
If the tunnel were very deep, C
t
1/(2K) 3.33, and W
t
11,200 lb/ft
(162,700 N/m).
264 GRAVITY SANITARY SEWER DESIGN AND CONSTRUCTION

9.2.7.7.6. Load-Producing Forces
When the tunnel is to be constructed through soils which tend to
squeeze or swell (such as some types of clay or shale) or through blocky to
seamy rock, the vertical load cannot be determined from a consideration
of the factors discussed previously, and Eq. (9-17) is not applicable.
The determination of rock pressures exerted against the tunnel lining is
largely an estimate based on previous experience of the performance of
linings in similar rock formations, although attempts at numerical analy-
sis of stress conditions around a tunnel shaft have been made.
In the case of plastic clay, the full weight of the overburden is likely to
come to rest on the tunnel lining some time after construction. The extent
of lateral pressures to be expected has not as yet been determined fully,
especially the passive resistance which will be maintained permanently
by a plastic clay in the case of a flexible, ring-shaped tunnel lining. For
normally consolidated clays, suggested lateral pressures are on the order
of 2/3 to 7/8 of vertical overburden pressures.
On the other hand, when tunneling through sand, only part of the
weight of the overburden will come to rest on the tunnel lining at any
time if adequate precautions are taken. The relief will be the result of the
transfer of the soil weight immediately above the tunnel to the adjoining
soil mass by shearing stresses along the vertical planes. In this case,
Marston’s formula may be used for estimating the total load which the
tunnel lining may have to carry.
Great care must be taken to prevent any escape of sand into the tunnel
during its construction. Moist sand will usually arch over small openings
and not cause trouble in this respect; however, entirely dry sand (which is
sometimes encountered) is liable to trickle into the tunnel through gaps in
the temporary lining. Wet sand or sand under the natural water table will
flow readily through the smallest gaps. Sand movements of this kind
destroy most (if not all) of the arching around the tunnel, with a resulting
strong increase of both vertical and horizontal pressures on the supports
of the lining. Such cases have been recorded and have caused consider-
able difficulty. All soil parameters required for design should be obtained
from laboratory testing.
9.3. LIVE LOADS AND MINIMUM COVER
In designing sanitary sewers, it is necessary to consider the impact of
live loads as well as the earth loads. Live loads become a greater consider-
ation when pipe is installed with shallow cover under unsurfaced road-
ways, railroads, and/or airport runways and taxiways. The distribution of
a live load at the surface on any horizontal plane in the subsoil is shown in
Fig. 9-14. The intensity of the load on any plane in the soil mass is greatest
STRUCTURAL REQUIREMENTS 265

at the vertical axis directly beneath the point of application and decreases
in all directions outward from the center of application. As the distance
between the plane and the surface increases, the intensity of the load at
any point on the plane decreases.
9.3.1. General Pressure Distribution
Concentrated and distributed superimposed loads should be consid-
ered in the structural design of sewers, especially where the depth of
earth cover is less than 8 ft (2.4 m). Where these loads are anticipated, they
are added to the predetermined trench load. Superimposed loads are cal-
culated by use of Holl’s and Newmark’s modifications to Boussinesq’s
equation (Spangler 1946).
9.3.1.1. Concentrated Loads
Holl’s integration of Boussinesq’s solution leads to the following equa-
tion for determining loads due to superimposed concentrated load, such
as a truck wheel load (Fig. 9-14):
W
sc
C
s
PF/L (9-19)
where
W
sc
the load on the conduit, in lb/ft (kg/m) of length
P the concentrated load, in lb (kg)
F the impact factor
266 GRAVITY SANITARY SEWER DESIGN AND CONSTRUCTION
FIGURE 9-14. Concentrated superimposed load vertically centered over sewer pipe.

C
s
the load coefficient, a function of B
c
/(2H) and L/(2H), where H
the height of fill from the top of conduit to ground surface, in ft
(m) and B
c
the width of conduit in ft (m)
L the effective length of conduit, in ft (m).
The effective length of a sewer pipe is defined as the length over which
the average load caused by surface traffic wheels produces nearly the
same stress in the sewer pipe wall as does the actual load which varies in
intensity from point to point. An effective length, L, equal to 3 ft (1 m) for
pipe greater than 3 ft (1 m) long, and the actual length for pipe segments
shorter than 3 ft (1 m) are recommended.
If the concentrated load is displaced laterally and longitudinally from a
vertically centered location over the section of sewer pipe under consider-
ation, the load on the pipe can be computed by algebraically adding the
effect of the concentrated load on various rectangles, each with a corner
centered under the concentrated load. Values of C
s
in Table 9-3 divided by
4 equals the load coefficient for a rectangle whose corner is vertically cen-
tered under the concentrated load.
9.3.1.2. Distributed Loads
For the case of a superimposed load distributed over an area of consid-
erable extent (Fig. 9-15), the formula for load on the sewer pipe is:
W
sd
C
s
pFB
c
(9-20)
where
W
sd
the load on the sewer pipe, lb/ft (N/m)
p the intensity of distributed load, lb/ft
2
(N/m
2
)
F impact factor
B
c
the width of the sewer pipe, ft (m)
C
s
load coefficient, which is a function of D/(2H) and (M/2H)
from Table 9-3
H height from the top of the sewer pipe to the ground surface, ft (m)
and D and M are the width and length, respectively, of the area over
which the distributed load acts, ft (m).
For the case of a uniform load offset from the center of the sewer pipe,
the loads per unit length of pipe may be determined by a combination of
rectangles. The load on the sewer pipe can be computed by algebraically
adding the effect of various rectangles of loaded area. It is more conven-
ient to work in terms of load under one corner of a rectangular loaded
area rather than at the center. Dividing the tabular values of C
s
by 4 will
give the effect for this condition. Stresses from various types of surcharge
STRUCTURAL REQUIREMENTS 267

TABLE 9-3. Values of Load Coefficientss, C
s
, for Concentrated and Distributed
Superimposed Loads Vertically Centered Over Conduit*
D
2H
or
B
c
2H 0.1 0.2 0.3 0.4 0.5 0.5 0.7 0.8 0.9 1.0 1.2 1.5 2.0 5.0
0.1 0.019 0.037 0.053 0.067 0.079 0.089 0.097 0.103 0.108 0.112 0.117 0.121 0.124 0.128
0.2 0.037 0.072 0.103 0.131 0.155 0.174 0.189 0.202 0.211 0.219 0.229 0.238 0.244 0.248
0.3 0.053 0.103 0.149 0.190 0.224 0.252 0.274 0.292 0.306 0.318 0.333 0.345 0.355 0.360
0.4 0.067 0.131 0.190 0.241 0.284 0.320 0.349 0.373 0.391 0.405 0.425 0.440 0.454 0.460
0.5 0.079 0.155 0.224 0.284 0.336 0.379 0.414 0.441 0.463 0.481 0.505 0.525 0.540 0.548
0.6 0.089 0.174 0.252 0.320 0.379 0.428 0.467 0.499 0.524 0.544 0.572 0.596 0.613 0.624
0.7 0.097 0.189 0.274 0.349 0.414 0.467 0.511 0.546 0.584 0.597 0.628 0.650 0.674 0.688
0.8 0.103 0.202 0.292 0.373 0.441 0.499 0.546 0.584 0.615 0.639 0.674 0.703 0.725 0.740
0.9 0.108 0.211 0.306 0.391 0.463 0.524 0.574 0.615 0.647 0.673 0.711 0.742 0.766 0.784
1.0 0.112 0.219 0.318 0.405 0.481 0.544 0.597 0.639 0.673 0.701 0.740 0.774 0.800 0.816
1.2 0.117 0.229 0.333 0.425 0.505 0.572 0.628 0.674 0.711 0.740 0.783 0.820 0.849 0.868
1.5 0.121 0.238 0.345 0.440 0.525 0.596 0.650 0.703 0.742 0.774 0.820 0.861 0.894 0.916
2.0 0.124 0.244 0.355 0.454 0.540 0.613 0.674 0.725 0.766 0.800 0.849 0.894 0.930 0.956
*Influence coefficients for solution of Holl’s and Newmark’s integration of the Boussinesq equation for vertical stress.
M
or
L
2H 2H

loadings can be computed using computer solutions (Jumikis 1969; 1971).
For determination of the stress below a point such as A in Fig. 9-16, as a
result of the loading in the rectangle BCDE, the area may be considered to
consist of four rectangles: AJDF AJCG AHEF AHBG. Each of these
four rectangles has a corner at point A. By computing D/(2H) and
M/(2H) for each rectangle, the load coefficient for each rectangle can be
taken from Table 9-3. Because point A is at the corner of each rectangle,
STRUCTURAL REQUIREMENTS 269
FIGURE 9-15. Distributed superimposed load vertically centered over sewer
pipe (lb/ft
2
47.9 N/m
2
).
FIGURE 9-16. Diagram for obtaining stress at point A caused by load in shaded
area BCDE.
Newmark, N. M. (1935). “Simplified computation of vertical pressures in
elastic foundations.” Circular 24, Illinois Experiment Station, Urbana, Ill.

the load coefficients from Table 9-3 should be divided by 4. A combina-
tion of the stresses from the four rectangles, with signs as indicated above,
gives the desired stress.
Values of C
s
can be read directly from Table 9-3 if the area of the dis-
tributed superimposed load is centered vertically over the center of the
sewer pipe under consideration.
9.3.1.3. Highway Truck Loads
Unless other data are available, it is safe to estimate that truck wheel
loads are the greatest loads to be supported. HS-20 wheel loadings have
been the long-term standard for highway and bridge design and are
equally applicable for estimating loads on sewers. With the advent of
larger trucks, many states have gone to HS-25 or even HS-32 design vehi-
cles. Figure 9-17 shows the American Association of State Highway and
Transportation Officials (AASHTO) loading for both H-20 and HS-20
design vehicles.
If a rigid or flexible pavement designed for heavy-duty traffic is pro-
vided, the intensity of a truck wheel load is usually reduced sufficiently
so that the live load transmitted to the pipe is negligible. In the case of
flexible pavements designed for light-duty traffic but subjected to heavy
truck traffic, the flexible pavement should be considered as fill material
270 GRAVITY SANITARY SEWER DESIGN AND CONSTRUCTION
FIGURE 9-17. AASHTO H-20/HS-20 design vehicle loadings.
American Association of State Highway and Transportation Officials
(AASHTO). (1997). “Standard specifications for highway bridges,” twelfth
ed., AASHTO, Washington, D.C.

over the top of the pipe. In analyses, the most critical AASHTO loadings
shown in Fig. 9-17 are used in either the single mode or passing mode.
Each of these loadings is assumed to be applied through dual-wheel
assemblies uniformly distributed over a surface area of 10 inches by 20
inches (254 mm by 508 mm), as shown in Fig. 9-18.
The total wheel load is then assumed to be transmitted and uniformly
distributed over a rectangular area on a horizontal plane at the depth, H,
as shown in Fig. 9-19 for a single HS-20 dual wheel.
Distributed load areas for the alternate load and the passing mode for
either loading are developed in a similar manner. Recommended impact
factors, F, to be used in determining live loads imposed on pipe with less
than 3 ft (0.9 m) of cover when subjected to dynamic traffic loads are listed
in the accompanying Table 9-4.
STRUCTURAL REQUIREMENTS 271
FIGURE 9-18. Wheel load surface contact area.
American Concrete Pipe Association (ACPA). (2000). “Concrete pipe
design manual,” ACPA, Irving, Tex. Reprinted with permission.
Figure 9-19 Distributed load area, single HS-20 dual wheel.
American Concrete Pipe Association (ACPA). (2000). “Concrete pipe
design manual,” ACPA, Irving, Tex. Reprinted with permission.

As the depth, H, increases, the critical loading configuration can be
either one HS-20 wheel load, two HS-20 wheel loads in the passing mode,
or the alternate load in the passing mode. Since the exact geometric rela-
tionship of individual or combinations of surface wheel loads cannot be
anticipated, the most critical loading configurations and the outside
dimensions of the distributed load areas within the indicated cover depths
are summarized in Table 9-5.
9.3.1.4. Railroad Loads
In determining the live load transmitted to a pipe installed under rail-
road tracks, the weight on the locomotive driver axles plus the weight of
the track structure, including ballast, is considered to be uniformly distrib-
uted over an area equal to the length occupied by the drivers multiplied by
the length of ties. Typically, tie length is assumed to be 8.5 ft (2.6 m). The
American Railway Engineering and Maintenance of Way Association
(AREMA) recommends a Cooper E80 loading with axle loads and axle
spacing, as shown in Fig. 9-20. In addition, 200 lb/ft (2,900 N/m) should be
allowed for the weight of the track structure.
Typically, railroads require an impact factor of 1.75 for depth of cover
up to 5 ft (1.5 m). Between 5 and 30 ft (1.5 and 9.1 m), the impact factor is
reduced by 0.03 per ft (0.1 per m) of depth. Below a depth of 30 ft (9.1 m),
the impact factor is 1.
272 GRAVITY SANITARY SEWER DESIGN AND CONSTRUCTION
TABLE 9-4. Impact Factors for Highway Truck Loads
H, Height of Cover F, Impact Factor
0 to 1 ft (0 to 0.30 m) 1.3
1 ft, 1 inch to 2 ft (0.31 to 0.61 m) 1.2
2 ft, 1 inch to 3 ft (0.62 to 0.91 m) 1.1
3 ft (0.91 m) 1
American Concrete Pipe Association (ACPA). (2000). “Concrete pipe design manual,”
ACPA, Irving, Tex. Reprinted with permission.
TABLE 9-5. Critical Loading Configurations
HPDistributed Load Area
1.33 ft (0.40 m) 16,000 lb (71,170 N) 1.67 1.75H (0.83 1.75H)
1.33 to 4.1 ft (0.41 to 1.25 m) 32,000 lb (142,340 N) 5.67 1.75H (0.83 1.75H)
4.1 ft (1.25 m) 48,000 lb (213,515 N) 5.67 1.75H (4.83 1.75H)
American Concrete Pipe Association (ACPA). (2000). “Concrete pipe design manual,”
ACPA, Irving, Tex. Reprinted with permission.

9.3.1.5. Aircraft Loads
The distribution of aircraft wheel loads on any horizontal plane in the
soil mass is dependent on the magnitude and characteristics of the aircraft
loads, the aircraft’s landing gear configuration, the type of pavement
structure, and the subsoil conditions. Heavier gross aircraft weights,
including the advent of New Large Aircraft (NLA) such as the Airbus
A380, have resulted in multiple wheel undercarriages consisting of dual-
wheel assemblies, dual tandem assemblies, or even “tridem” (three
wheels in a row) assemblies. The distribution of wheel loads through
rigid and flexible pavements are shown in Figs. 9-21 and 9-22. If a rigid
pavement is provided, an aircraft wheel load concentration is distributed
STRUCTURAL REQUIREMENTS 273
FIGURE 9-20. Cooper E80 load distribution.
American Railway Engineering and Maintenance of Way Association
(AREMA). (1981–1982). “Manual for railway engineering,” AREMA,
Washington, D.C.
FIGURE 9-21. Aircraft pressure distribution for rigid pavements.
American Concrete Pipe Association (ACPA). (2000). “Concrete pipe
design manual,” ACPA, Irving, Tex. Reprinted with permission.

over an appreciable area and is substantially reduced in intensity at the sub-
grade. For multi-wheeled landing gear assemblies, the total pressure inten-
sity is dependent on the interacting pressures produced by each individual
wheel. The maximum load transmitted to a pipe varies with the pipe size
under consideration, the pipe’s relative location with respect to the particu-
lar landing gear configuration, and the height of fill between the top of the
pipe and the subgrade surface. For a flexible pavement, the area of the load
distribution at any plane in the soil mass is considerably less than for a rigid
pavement. The interaction of pressure intensities due to individual wheels
of a multi-wheeled landing gear assembly is also less pronounced at any
given depth of cover. In present airport design practices, the aircraft’s max-
imum takeoff weight is used since the maximum landing weight is usually
considered to be about three-quarters of the takeoff weight.
Currently, culvert design for airports is governed by the Federal Avia-
tion Administration (FAA) under Advisory Circular (AC)150/5320-5B,
Airport Drainage. AC 150/5320-5B provides information on the required
depths and diameters of the culvert system for given overlying pavement
surfaces. This AC contains basic parameters for culvert design for aircraft
274 GRAVITY SANITARY SEWER DESIGN AND CONSTRUCTION
FIGURE 9-22. Aircraft pressure distribution for flexible pavements.
American Concrete Pipe Association (ACPA). (2000). “Concrete pipe
design manual,” ACPA, Irving, Tex. Reprinted with permission.

weights up to 1.5 million pounds on traditional-style landing gear config-
urations, such as the double tandem found on a B747. NLA are predicted
to weigh around 1.2 million pounds and feature complex gear designs
with triple- and quad-tandem gear posts. If designing for an airport that
will be serving NLA, the wheel loading factors associated with these gear
configurations will have to be evaluated.
Additional information regarding the calculation of live loads under
rigid airport pavement and taxiways can be found in the Portland Cement
Association’s publication Vertical Pressure on Culverts Under Wheel
Loads on Concrete Pavement Slabs (PCA 1951).
9.3.1.6. Construction Loads
During grading operations it may be necessary for heavy construction
equipment to travel over an installed pipe. Unless adequate protection is
provided, the pipe may be subjected to load concentrations in excess of
the design loads. Before heavy construction equipment is permitted to
cross over a pipe, a temporary earth fill should be constructed to an eleva-
tion at least 3 ft (0.9 m) over the top of the pipe. The fill should be of suffi-
cient width to prevent possible lateral displacement of the pipe.
Sample Calculations
Example 9-9. Determine the load on a 24-inch-diameter pipe under 3 ft of
cover caused by a 10,000-lb truck wheel applied directly above the center
of the pipe.
Assume the pipe section is 2.5 ft long; the wall thickness is 2 inches;
and the impact factor 1. Then B
c
24 4 28 inches 2.33 ft; L 2.5 ft;
and H 3 ft. Finally, B
c
/2H 2.33/6 0.39; and L/2H 2.5/6 0.41;
the load coefficient is 0.240 from Table 9-3. Substituting in Eq. (9-19):
Example 9-10. Determine the load on a 48-inch-diameter concrete pipe
under 6 ft of cover (bottom of ties to top of pipe) resulting from the
Cooper E80 railroad loading.
Assume the pipe wall thickness is 4 inches The locomotive load con-
sists of four 80,000-lb axles spaced 5 ft center-to-center; the impact factor
is 1.4; and the weight of the track structure is 200 lb/ft. Then B
c
48 9
56 inches or 4.67 ft; H 6 ft; D 8 ft; and M 20 ft. The unit load plus
impact at the base of the ties is:
4 80 000 1 4
820
200
8
2 825
2
8
12
0
,.
,/;
.
lb ft
2
D
H
W
sc
0 240
10 000 1 0
25
960.
,.
.
// lb ft (14,000 N m)
STRUCTURAL REQUIREMENTS 275

The influence coefficient is 0.641 (Table 9-3).
From Eq. (9-20):
W
sd
0.641 2,825 4.67 8,460 lb/ft (123,420 N/m).
9.4. DIRECT DESIGN AND INDIRECT DESIGN
The structural design of rigid pipe for installed conditions is defined
as Direct Design, in which all stresses induced within the pipe (including
moment, thrust, shear, diagonal tension, radial tension, and crack con-
trol) are evaluated for a defined external pressure distribution. ASCE
Standard 15-98, Standard Practice for Direct Design of Buried Precast
Concrete Pipe Using Standard Installations (SIDD) (ASCE 2000), and
AASHTO Soil-Reinforced Concrete Structure Interaction Systems, Sec-
tion 16 (AASHTO 1997) present detailed procedures with applicable
structural design equations for the installed direct design condition. A
software program titled PIPECAR, available through the Federal High-
way Administration (FHWA), can also be used for the structural analysis
and design of circular reinforced concrete pipe.
Indirect Design procedures for rigid pipe involve the determination of
the load-carrying capacity of the pipe under the T.E.B. test load condition
and evaluation of the earth and live loads the pipe is subjected to under
the installed condition. The load-carrying capacity of the pipe under the
test condition of loading is correlated with the installed condition of load-
ing and bedding by means of a bedding factor. The numerical value of the
bedding factor is predetermined by the ratio of the maximum tension
stress induced within the pipe wall under the test load to the maximum
tension stress induced within the pipe wall under the installed load.
A combination of Direct Design pressure distribution for standard
installations and correlation with the T.E.B. test load with appropriate
bedding factors simplifies the necessary detailed mathematical computa-
tion required for the determination of required pipe strength. The Indirect
Design method of analysis can also be accomplished utilizing the
Marston-Spangler Theory of Loads and Supporting Strengths.
For flexible pipe, the predominant source of structural load-carrying
capability is the external pressure on the pipe exerted by the surrounding
embedment material as the pipe deforms under load. Therefore, all flex-
ible pipes are evaluated by Direct Design procedures for the installed
condition. The structural design of circular flexible pipe is based on com-
pression wall thrust, wall buckling, and limiting deformation/deflection
to acceptable limits. For flexible thermoplastic and thermosetting plastic
pipe, strain limits are also evaluated.
M
H2
20
12
167..
276 GRAVITY SANITARY SEWER DESIGN AND CONSTRUCTION

9.5. RIGID PIPE STRUCTURAL DESIGN
Three methods of design analysis are available for rigid pipe, depend-
ing on the pipe material. The methods are:
1. Standard Installation Direct Design (SIDD) utilizing ASCE Standard
15-98, AASHTO Standard Specification for Highway Bridges, Section
16, or the FHWA PIPECAR computer program.
2. Standard Installation Indirect Design, as outlined in ACPA’s Concrete
Pipe Design Manual (ACPA 2000).
3. Marston-Spangler Theory of Loads and Supporting Strength.
Method 1 is applicable only to reinforced concrete pipe. Method 2 is
applicable to both concrete pipe and reinforced concrete pipe. Method 3 is
applicable to all other rigid pipe materials, including clay pipe, fiber
cement pipe, and cast-in-place concrete structures.
9.5.1. Direct Design of Concrete Pipe
ASCE Standard 15-98 provides guidance for the design of standard
installations of reinforced precast concrete pipe. This method is automated
in the FHWA PIPECAR computer program. The SIDD method accounts for
the interaction between the pipe and soil envelope in determining loads and
distribution of earth pressure on a buried pipe. The loads and pressure dis-
tributions are used to calculate the moment, thrust, and shear in the pipe
wall, and required pipe reinforcement for ASCE Standard Installations. This
standard utilizes two Standard Installations—one in embankments and one
in trenches—as well as specific requirements for soils classifications and com-
paction requirements for four installation types. These are based on the
results of pipe–soil interaction, together with an evaluation of current con-
struction practice, equipment, procedures, and experience. The structural
design of a concrete pipe is based on a limits state design procedure that
accounts for strength and serviceability criteria. To design the concrete pipe,
the owner and/or engineer must establish the following design criteria:
• Intended use of the pipeline.
• Pipe inside diameter.
• Pipeline plan and profile drawings with installation cross sections,
as required.
• Design earth cover height above the top of the pipe.
• The allowable Standard Installation type as defined in ASCE Stan-
dard 15-38. (Type 1 requires the most effort and control in bedding
and backfill construction but minimizes the design loads on the
pipe. Type 1 is the simplest to construct but imposes greater require-
ments on the pipe.)
STRUCTURAL REQUIREMENTS 277

• Soil data sufficient to determine in situ conditions for allowable
ASCE and ACPA Standard Installations (including in situ soil classi-
fication) and overfill weight per volume.
• Performance requirements for pipe joints.
• Design live and surcharge loadings, if any.
• Design intermittent internal hydrostatic pressures, if required.
• Crack width control criteria.
• Cement type, if different from that in ASTM C1417.
The design of a concrete pipe for a particular Standard Installation type
is based on the assumption that the specified design bedding and fill
requirements will be achieved during construction of the installation.
The Standard Embankment Installation, and the accompanying termi-
nology, are shown in Fig. 9-23. Table 9-6 shows the varying types of
embankment installations and the necessary bedding requirements. The
Standard Trench Installation, and accompanying terminology, are shown
278 GRAVITY SANITARY SEWER DESIGN AND CONSTRUCTION
FIGURE 9-23. Standard embankment installation.
From American Society of Civil Engineers (ASCE), Direct Design of Buried
Concrete Pipe Standards Committee. (2000). “Standard practice for direct
design of buried precast concrete pipe using standard installations
(SIDD),” ASCE Standard No. 15-98, ASCE, Reston, Va.

STRUCTURAL REQUIREMENTS 279
TABLE 9-6. Standard Embankment Installations Soil
and Minimum Compaction Requirements
Installation Haunch and
Type Bedding Thickness Outer Bedding Lower Side
Type 1 D
0
/24 minimum, not less 95% Category I 90% Categogy I,
than 3 inches (75 mm). 95% Category II,
If rock foundation, use or
D
0
/12 minimum, not less 100% Category III
than 6 inches (150 mm)
Type 2 D
0
/24 minimum, not less 90% Category I 85% Category I,
than 3 inches (75 mm). or 90% Category II,
If rock foundation, use 95% Category II or
D
0
/12 minimum, not less 95% Category III
than 6 inches (150 mm).
Type 3 D
0
/24 minimum, not less 85% Category I, 85% Category I,
than 3 inches (75 mm). 90% Category II, 90% Category II,
If rock foundation, use or or
D
0
/12 minimum, not less 95% Category III 95% Category III
than 6 inches (150 mm).
Type 4 No bedding required, No compaction No compaction
except if rock foundation, required, except if required, except if
use D
0
/12 minimum, not Category III, use Category III, use
less than 6 inches (150 mm). 85% Category III 85% Category III
Notes:
1. Compaction and soil symbols—i.e. “95% Category I” refers to Category 1 soil material
with a minimum standard Proctor compaction of 95%. See illustration 4.5 for equivalent
modified Proctor values.
2. Soil in the outer bedding, haunch, and lower side zones, except within D
0
/3 from the pipe
springline, shall be compacted to at least the same compaction as the majority of soil in the
overfill zone.
3. Substrenches
3.1 A subtrench is defined as a trench with its top below finished grade by more than
0.1 H or, for roadways, its top is at an elevation lower than 1 inch (0.3 m) below the
bottom of the pavement base material.
3.2 The minimum width of a subtrench shall be 1.33 D
0
or wider if required for adequate
space to attain the specified compaction in the haunch and bedding zones.
3.3 For subtrenches with walls of natural soil, any portion of the lower side zone in the
subtrench wall shall be at least as firm as an equivalent soil placed to the compaction
requirements specified for the lower side zone and as firm as the majority of soil in
the overfill zone, or shall be removed and replaced with soil compacted to the speci-
fied level.
American Society of Civil Engineers (ASCE), Direct Design of Buried Concrete Pipe Stan-
dards Committee. (2000). “Standard practice for direct design of buried precast concrete
pipe using standard installations (SIDD),” ASCE Standard No. 15-98, ASCE, Reston, Va.

in Fig. 9-24, with Table 9-7 indicating the soils and compaction require-
ments for the trench installation.
In evaluating actual loads on the pipe, a finite element analysis pro-
gram (SPIDA) was programmed with the ASCE and ACPA Standard
Installations and many design runs were made (ASCE 2000). An evalua-
tion of the output of the designs by Dr. Frank J. Heger produced a load
pressure diagram, Fig. 9-25, significantly different from those proposed
by previous theories. This difference is particularly significant under the
pipe in the lower haunch area and is due, in part, to the assumption of the
existence of partial voids adjacent to the pipe wall in this area.
Table 9-8 relates the generic soil types designated in Tables 9-6 and 9-7
to soil classifications established under the Unified Soil Classification Sys-
tem (USCS) and AASHTO soil classification systems.
Although it is possible to hand-calculate the design of a concrete pipe
using this method, the necessity of analyzing multiple states makes the
use of a computer program preferable. PIPECAR was developed by Simp-
son Gumpertz & Heger, Inc. for the FHWA and uses the SIDD design
method to design concrete pipe to the AASHTO method. Although ver-
sions of the software can be downloaded from FHWA web site without
280 GRAVITY SANITARY SEWER DESIGN AND CONSTRUCTION
FIGURE 9-24. Standard trench installation.
From American Society of Civil Engineers (ASCE), Direct Design of
Buried Concrete Pipe Standards Committee. (2000). “Standard practice
for direct design of buried precast concrete pipe using standard installa-
tions (SIDD),” ASCE Standard No. 15-98, ASCE, Reston, Va.

STRUCTURAL REQUIREMENTS 281
TABLE 9-7. Standard Trench Installations Soil and
Minimum Compaction Requirements
Installation Haunch and
Type Bedding Thickness Outer Bedding Lower Side
Type 1 D
0
/24 minimum, not less 95% Category I 90% Categogy I,
than 3 inches (75 mm). 95% Category II,
If rock foundation, use or
D
0
/12 minimum, not less 100% Category III
than 6 inches (150 mm)
Type 1 D
0
/24 minimum, not less 95% Category I 90% Category I,
than 3 inches (75 mm). 95% Category II,
If rock foundation, use or
D
0
/12 minimum, not less 100% Category III
than 6 inches (150 mm).
Type 2 D
0
/24 minimum, not less 90% Category I 85% Category I,
than 3 inches (75 mm). or 90% Category II,
If rock foundation, use 95% Category II or
D
0
/12 minimum, not less 95% Category III
than 6 inches (150 mm).
Type 3 D
0
/24 minimum, not less 85% Category I, 85% Category I,
than 3 inches (75 mm). 90% Category II, 90% Category II,
If rock foundation, use or or
D
0
12 minimum, not less 95% Category III 95% Category III
than 6 inches (150 mm).
Type 4 No bedding required, No compaction No compaction
except if rock foundation, required, except if required, except if
use D
0
/12 minimum, not Category III, use Category III, use
less than 6 inches (150 mm). 85% Category III 85% Category III
Notes:
1. Compaction and soil symbols—i.e. 95% Category I”—refers to Category I soil material
with minimum standard Proctor compaction of 95%. See illustration 4.8 for equivalent
modified Proctor values.
2. The trench top elevation shall be no lower than 0.1 H below finished grade or, for road-
ways, its top shall be no lower than an elevation of 1 inch (0.3 m) below the bottom of the
pavement base material.
3. Soil in bedding and haunch zones shall be compacted to at least the same compaction as
specified for the majority of soil in the backfill zone.
4. The trench width shall be wider than shown if required for adequate space to attain the
specified compaction in the haunch and bedding zones.
5. For trench walls that are within 10 degrees of vertical, the compaction or firmness of the
soil in the trench walls and lower side zone need not be considered.
6. For trench walls with greater than 10 degree slopes that consist of embankment, the lower
side shall be compacted to at least the same compaction as specified for the soil in the
backfill zone.
American Society of Civil Engineers (ASCE), Direct Design of Buried Concrete Pipe Stan-
dards Committee. (2000). “Standard practice for direct design of buried precast concrete
pipe using standard installations (SIDD),” ASCE Standard No. 15-98, ASCE, Reston, Va.
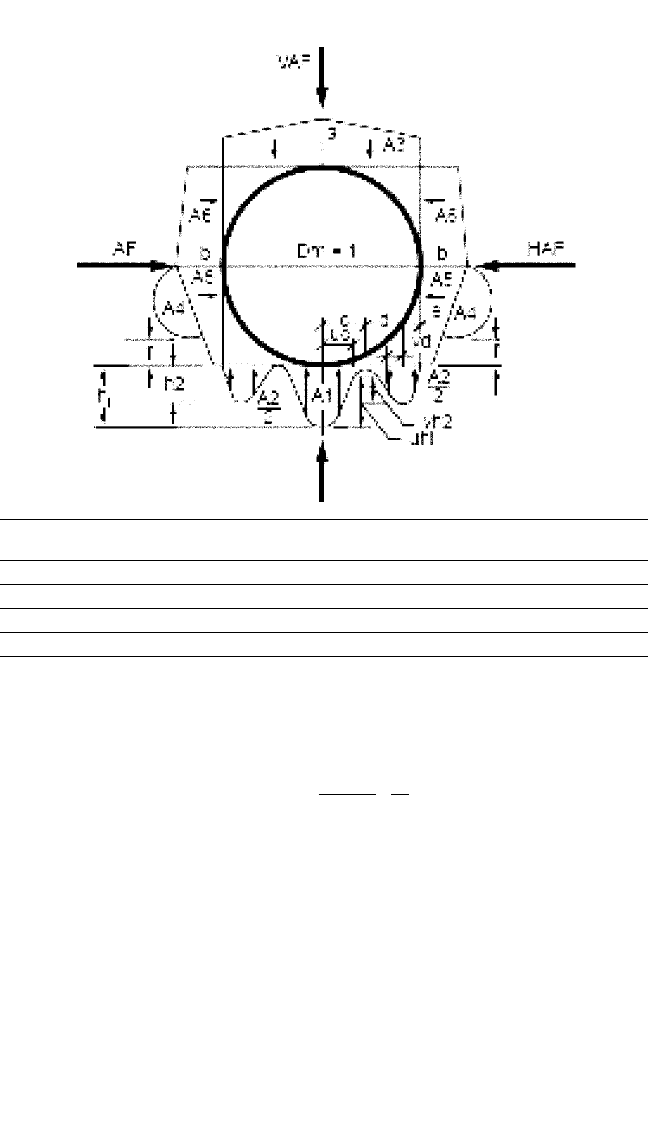
282 GRAVITY SANITARY SEWER DESIGN AND CONSTRUCTION
FIGURE 9-25. Arching coefficients and Heger Earth Pressure Distribution.
American Society of Civil Engineers (ASCE), Direct Design of Buried
Concrete Pipe Standards Committee. (2000). “Standard practice for direct
design of buried precast concrete pipe using standard installations
(SIDD),” ASCE Standard No. 15-98, ASCE, Reston, Va.
Installation
Type VAF HAF A1 A2 A3 A4 A5 A6 a b c e f u v
1 1.35 0.45 0.62 0.73 1.35 0.19 0.08 0.18 1.40 0.40 0.18 0.08 0.05 0.80 0.80
2 1.40 0.40 0.85 0.55 1.40 0.15 0.08 0.17 1.45 0.40 0.19 0.10 0.05 0.82 0.70
3 1.40 0.37 1.05 0.35 1.40 0.10 0.10 0.17 1.45 0.36 0.20 0.12 0.05 0.85 0.80
4 1.45 0.30 1.45 0.00 1.45 0.00 0.11 0.18 1.45 0.30 0.28 0.00 – 0.90 –
Notes:
1. VAF and HAF are vertical and horizontal arching factors. These coefficients represent non-dimensional
total vertical and horizontal loads on the pipe, respectively. The actual total vertical and horizontal
loads are (VAF) (PL) and (HAF) (PL), respectively, where PL is the prism load.
2. PL, the prism load, is the weight of the column of earth cover over the pipe outside diameter and is
calculated as:
3. Coefficients A1 through A5 represent the integration of non-dimensional vertical and horizontal com-
ponents of soil pressure under the indicated portions of the component pressure diagrams (i.e., the
area under the component pressure diagrams). The pressures are assumed to vary either paraboli-
cally or linearly, as shown, with the non-dimensional magnitudes at governing points represented by
h1, h2, uh1, vh2, a and b. Non-dimensional horizontal and vertical dimensions of component pres-
sure regions are defined by c, d, e, vc, vd, and f coefficients.
4. is calculated as (0.5ce).
h1 is calculated as (1.5A1)/(c)(1+u).
h2 is calculated as (1.5A2)/[(d)(1+v)+(2e)]
PL w H
DxD
00
4
96 12
()
⎛
⎝
⎜
⎜
⎜
⎞
⎠
⎟
⎟
⎟
⎟
⎡
⎣
⎢
⎢
⎤
⎦
⎥
⎥

charge, updated versions of the software, compatible with graphic user
interfaces, can be obtained from the American Concrete Pipe Association
(ACPA) for a nominal charge.
9.5.2. Standard Installations Indirect Design
As an alternative to the SIDD method and the use of computer pro-
grams, the ACPA developed a design method which combines the Indirect
Design methods formerly used with the Marston-Spangler equations with
STRUCTURAL REQUIREMENTS 283
TABLE 9-8. Equivalent USCS and AASHTO Soil Classifications
for SIDD Soil Designations
Representative Soil Types Percent Compaction
Standard Modified
SIDD Soil USCS AASHTO Proctor Proctor
Gravelly Sand (SW) SW, SP A1, A3 100 95
GW, GP 95 90
90 85
85 80
80 75
61 59
Sandy Silt (ML) GM, SM, ML; A2, A4 100 95
also GC, SC with 95 90
less than 20% 90 85
passing No. 200 85 80
sieve 80 75
49 46
Silty Clay (CL) CL, MH, GC, SC A5, A6 100 90
95 85
90 80
85 75
80 70
45 40
Silty Clay (CL) CH A7 100 90
but not allowed 95 85
for haunch or 90 80
bedding 45 40
American Society of Civil Engineers (ASCE), Direct Design of Buried Concrete Pipe Stan-
dards Committee. (2000). “Standard practice for direct design of buried precast concrete
pipe using standard installations (SIDD),” ASCE Standard No. 15-98, ASCE, Reston, Va.

the Standard Installations. This design method is presented both in ACPA
Standard Installations and Bedding Factors for the Indirect Design
Method, Design Data 40 (ACPA 1993) and in the ACPA Concrete Pipe
Design Manual (ACPA 2000).
Although developed for the Direct Design method, the Standard
Installations are readily applicable to and simplify the Indirect Design
method. The Standard Installations are easier to construct and provide
more realistic designs than the historical B, C, and D beddings. Devel-
opment of bedding factors for the Standard Installations, as presented
in the following paragraphs, follows the concepts of reinforced con-
crete design theories. The basic definition of a bedding factor is that it is
the ratio of maximum moment in the T.E.B. test to the maximum
moment in the buried condition, when the vertical loads under each
condition are equal:
(9-21)
where
B
f
bedding factor
M
TEST
maximum moment in pipe wall under a T.E.B. test load,
inch-lb (N-m)
M
FIELD
maximum moment in pipe wall under field loads, inch-lb
(N-m).
Consequently, to evaluate the proper bedding factor relationship, the
vertical load on the pipe for each condition must be equal, which occurs
when the springline axial thrusts for both conditions are equal. In accor-
dance with the laws of statics and equilibrium, M
TEST
and M
FIELD
are:
(9-22)
and
(9-23)
where
N
FS
axial thrust at the springline under a T.E.B. test load, lb/ft (N/m)
D internal pipe diameter, inch (mm)
t pipe wall thickness, inch (mm)
M
FI
moment at the invert under field loading, inch-lb/ft (N-mm/m)
N
FI
axial thrust at the invert under field loads, lb/ft (N/m)
c thickness of concrete cover over the inner reinforcement,
inch (mm).
MMtN Nc
FIELD FI FI FI
[. ] [. ]0 38 0 125
MNDt
TEST FS
[. ] ( )0 318
B
M
M
f
TEST
FIELD
284 GRAVITY SANITARY SEWER DESIGN AND CONSTRUCTION

Substituting equations:
(9-24)
Using SIDD, bedding factors were determined for a range of pipe
diameters and depths of burial. These calculations were based on 1-inch
(25.4-mm) cover over the reinforcement, a moment arm of 0.875d between
the resultant tensile and compressive forces, and a reinforcement diame-
ter of 0.075t. Evaluations indicated that for A, B, and C pipe wall thick-
nesses, there was negligible variation in the bedding factor due to pipe
wall thickness or the concrete cover, c, over the reinforcement. The result-
ing bedding factors are presented in Table 9-9.
9.5.2.1. Determination of Bedding Factor
For trench installations, as discussed previously, experience indicates
that active lateral pressure increases as the trench width increases to the
transition width, provided the side fill is compacted. A parameter study
of the Standard Installations indicates the bedding factors are constant for
all pipe diameters under conditions of zero lateral pressure on the pipe.
These bedding factors exist at the interface of the wall of the pipe and the
soil and are called the minimum bedding factors, B
fo
, to differentiate them
from the fixed bedding factors developed by Spangler. Table 9-10 pres-
ents the minimum bedding factors.
B
NDt
MtN Nc
f
FS
FI FI FI
(. ) ( )
(. ) (. )
0 318
0 38 0 125
STRUCTURAL REQUIREMENTS 285
TABLE 9-9. Bedding Factors, Embankment Conditions, B
fe
Standard Installation
Pipe Diameter Type 1 Type 2 Type 3 Type 4
12 inches (300 mm) 4.4 3.2 2.5 1.7
24 inches (600 mm) 4.2 3.0 2.4 1.7
36 inches (900 mm) 4.0 2.9 2.3 1.7
72 inches (1,820 mm) 3.8 2.8 2.2 1.7
144 inches (3,650 mm) 3.6 2.7 2.2 1.7
1. For pipe diameters other than listed in Table 9-9, embankment condition factors, B
fe
can be
obtained by interpolation.
2. Bedding factors are based on the soils being placed with the minimum compaction speci-
fied in Fig. 9-23 and Table 9-6 for each Standard Installation.
American Concrete Pipe Association (ACPA). (2000). “Concrete pipe design manual,”
ACPA, Irving, Tex. Reprinted with permission.

The bedding factor is conservatively assumed to vary linearly between
the minimum bedding factor and the bedding factor at the transition
width, which is the embankment condition bedding factor.
The equation for this variable trench bedding factor is:
(9-25)
where
B
c
outside horizontal span of pipe, ft (m)
B
d
trench width at top of pipe, ft (m)
B
dt
transition width at top of pipe, ft (m)
B
fe
bedding factor, embankment
B
fo
minimum bedding factor, trench
B
fv
variable bedding factor, trench.
Transition width values, B
dt
are provided in tables in the ACPA Con-
crete Pipe Design Manual (ACPA 2000) or can be calculated as identified
previously in Fig. 9-5.
For pipe installed with 6.5 ft (2 m) or less of overfill and subjected to
truck loads, the controlling maximum moment may be at the crown rather
than the invert. Consequently, the use of an earth load bedding factor may
produce unconservative designs. Crown and invert moments of pipe for a
range of diameters and burial depths subjected to HS-20 truck live loadings
were evaluated by the ACPA. The ACPA also evaluated the effect of bed-
ding angle and live load angle (width of loading on the pipe). When HS-20
or other live loadings are encountered to a significant degree, the live load
bedding factors, B
fLL
, presented in Table 9-11 are satisfactory for a Type 4
Standard and become increasingly conservative for Types 3, 2, and 1.
B
BBBB
BB
B
fv
fe fo
d
c
dt
c
fo
()()
()
286 GRAVITY SANITARY SEWER DESIGN AND CONSTRUCTION
TABLE 9-10. Trench Minimum Bedding Factors, B
fo
Standard Installation Minimum Bedding Factor, B
fo
Type 1 2.3
Type 2 1.9
Type 3 1.7
Type 4 1.5
1. Bedding factors are based on the soils being placed with the minimum compaction speci-
fied in Fig. 9-24 and Table 9-7 for each Standard Installation.
2. For pipe installed in trenches dug in previously constructed embankment, the load and
the bedding factor should be determined as an embankment condition unless the backfill
placed over the pipe is of lesser compaction than the embankment.
American Concrete Pipe Association (ACPA). (2000). “Concrete pipe design manual,”
ACPA, Irving, Tex. Reprinted with permission.

TABLE 9-11. Bedding Factors, B
fLL
, for HS-20 Live Loadings
Fill
Pipe Diameter, inches (mm)
Height, 12 24 36 48 60 72 84 96 108 120 144
ft (m) (300) (600) (900) (1,200) (1,500) (1,800) (2,100) (2,400) (2,700) (3,000) (3,600)
0.5 (0.15) 2.2 1.7 1.4 1.3 1.3 1.1 1.1 1.1 1.1 1.1 1.1
1 (0.3) 2.2 2.2 1.7 1.5 1.4 1.3 1.3 1.3 1.1 1.1 1.1
1.5 (0.45) 2.2 2.2 2.1 1.8 1.5 1.4 1.4 1.3 1.3 1.3 1.1
2.0 (0.6) 2.2 2.2 2.2 2.0 1.8 1.5 1.5 1.4 1.4 1.3 1.3
2.5 (0.75) 2.2 2.2 2.2 2.2 2.0 1.8 1.7 1.5 1.4 1.4 1.3
3.0 (0.9) 2.2 2.2 2.2 2.2 2.2 2.2 1.8 1.7 1.5 1.5 1.4
3.5 (1.05) 2.2 2.2 2.2 2.2 2.2 2.2 1.9 1.8 1.7 1.5 1.4
4 (1.20) 2.2 2.2 2.2 2.2 2.2 2.2 2.1 1.9 1.8 1.7 1.5
4.5 (1.35) 2.2 2.2 2.2 2.2 2.2 2.2 2.2 2.0 1.9 1.8 1.7
5 (1.5) 2.2 2.2 2.2 2.2 2.2 2.2 2.2 2.2 2.0 1.9 1.8
5.5 (1.65) 2.2 2.2 2.2 2.2 2.2 2.2 2.2 2.2 2.2 2.0 1.9
6 (1.8) 2.2 2.2 2.2 2.2 2.2 2.2 2.2 2.2 2.2 2.1 2.0
6.5 (1.95) 2.2 2.2 2.2 2.2 2.2 2.2 2.2 2.2 2.2 2.2 2.2
1. For pipe diameters other than listed in Table 9-11, BfLL values can be obtained by interpolation.
American Concrete Pipe Association (ACPA). (2000). “Concrete pipe design manual,” ACPA, Irving, Tex. Reprinted with permission.

9.5.2.2. Pipe Strengths and Safety Factors
The structural design of rigid sewer pipe systems relates to the prod-
uct’s performance limit, expressed in terms of strength of the installed
sewer pipe. Based on anticipated field loadings and concrete and reinforc-
ing steel properties, calculations of shear, thrust, and moment can be
made and compared to the ultimate strength of the section.
For precast concrete sewer pipes, the design strength is commonly
related to a T.E.B. test strength measured at the manufacturing plant, as
illustrated in Fig. 9-26. The plant test is much more severe because it
develops shearing forces in the pipe wall that usually are not encountered
in the field. Special reinforcement to resist shear in testing may be
required in heavily reinforced sewer pipe, which would not be required
by the more uniformly distributed field loading. In either case, the design
load is equal to the field strength divided by the factor of safety. The
design load is the calculated load on the pipe, and the field strength is the
ultimate load which the pipe will support when installed under specified
conditions of bedding and backfilling.
Since numerous reinforced concrete pipe sizes are available, T.E.B. test
strengths are classified by D-loads. The D-load concept provides strength
classification of pipe independent of pipe diameter. For reinforced circu-
lar pipe, the T.E.B. test load in lb/ft (N/m) equals the D-load times the
inside diameter in feet (millimeters). The required T.E.B. strength of non-
288 GRAVITY SANITARY SEWER DESIGN AND CONSTRUCTION
FIGURE 9-26. Both laboratory testing and field conditions should be used for
rigid sewer pipe strength determination.

reinforced concrete pipe is expressed in lb/ft(N/m), not as a D-load, and
is computed by the equation:
(9-26)
where
W
E
earth load, lb/ft (N/m)
B
fe
bedding factor, earth load
W
L
live load, lb/ft (N/m)
B
fLL
bedding factor, live load
F.S. safety factor.
The required T.E.B. strength of circular reinforced concrete pipe is
expressed as D-load and is computed by the equation
(9-27)
where
D internal pipe diameter, inch (mm) and all other variables are as in
Eq. (9-26).
The Indirect Design method employs a safety factor between yield stress
and the desired working stress. In the Indirect Method, the factor of safety is
defined as the relationship between the ultimate strength D-load and the
0.01-inch- (0.3-mm)-crack D-load. The 0.01-inch- (0.3-mm)-crack D-load
(D0.01) is the maximum T.E.B. test load supported by a concrete pipe before
a crack occurs having a width of 0.01 inch (0.3 mm) measured at close inter-
vals, throughout a length of at least 1 ft (300 mm). The ultimate D-load (D
u
)
is the maximum T.E.B. test load supported by a pipe. D-loads are expressed
in pounds per linear foot per foot of inside diameter (N/m/mm). The rela-
tionship between D
u
and the 0.01-inch- (3-mm)-crack D-load is specified in
the ASTM Standards C76 and C655 on concrete pipe. The relationship
between D
u
and the 0.01-inch- (3-mm)-crack D-load is 1.5 for 0.01-inch-
(3-mm)-crack D-loads of 2,000 or less; 1.25 for 0.01-inch- (3-mm)-crack
D-loads of 3,000 or more; and a linear reduction from 1.5 to 1.25 for 0.01-
inch- (3-mm)-crack D-loads greater than 2,000 and less than 3,000. Therefore,
a factor of safety of 1 should be applied if the 0.01-inch- (3-mm)-crack
strength is used as the design criterion rather than the ultimate strength. The
0.01-inch- (3-mm)-crack width is an arbitrarily chosen test criterion and not a
criterion for field performance or service limit.
When an HS-20 truck live loading is applied to the pipe, the live load bed-
ding factor, B
fLL
, is utilized as indicated in Eq. (9-27), unless the earth load
D-load
W
B
W
B
FS
D
E
fe
L
fLL
⎡
⎣
⎢
⎢
⎤
⎦
⎥
⎥
..
TEB
W
B
W
B
FS
E
fe
L
fLL
... ..
⎡
⎣
⎢
⎢
⎤
⎦
⎥
⎥
STRUCTURAL REQUIREMENTS 289

bedding factor, B
fe
, is of lesser value. If the earth load bedding factor is lower,
use the lower B
fe
value in place of B
fLL
. For example, with a Type 4 Standard
Installation of a 48-inch- (1,200-mm)-diameter pipe under 1 ft (0.3 m) of fill,
the factors used would be B
fe
1.7 and B
fLL
1.5; but under 2.5 ft (0.75 m) or
greater fill, the factors used would be B
fe
1.7 and B
fLL
1.7, rather than 2.2.
For trench installations with trench widths less than transition width, B
fLL
would be compared to the variable trench bedding factor, B
fv
.
9.5.3. Marston-Spangler Supporting Strength Calculations
9.5.3.1. General Relationships
As noted previously, the inherent strength of a rigid sewer pipe usually is
given by its strength in the T.E.B. test. Although this test is both convenient
and severe, it does not reproduce the actual field load conditions. Thus, to
select the most economical combination of bedding and sewer pipe strength,
a relationship must be established between calculated load, laboratory
strength, and field strength for various installation conditions (Fig. 9-26).
Field strength, moreover, depends on the distribution of the reaction
against the bottom of the sewer pipe and on the magnitude and distribu-
tion of the lateral pressure acting on the sides of the pipe. These factors
therefore make it necessary to qualify the term “field strength” with a
description of conditions of installation in a particular case, as they affect
the distribution of the reaction and the magnitude and distribution of lat-
eral pressure. Just as for sewer pipe load computations, it is convenient
when determining field strength to classify installation conditions as
either trench or embankment.
9.5.3.2. Laboratory Strength
Rigid sewer pipe is tested for strength in the laboratory by the T.E.B. test
(Fig. 9-26). Methods of testing are described in detail in ASTM C301 for vitri-
fied clay sewer pipe and in C497 for concrete and reinforced concrete sewer
pipe. The minimum strengths required for the T.E.B. tests of the various
types of rigid sewer pipe are stated in the ASTM specifications for the pipe.
As noted above, in the case of reinforced concrete sewer pipe, labora-
tory strengths are divided into two categories: the load that will produce
a 0.01-inch (0.3-mm) crack and the ultimate load the sewer pipe will with-
stand. Nonreinforced concrete and clay sewer pipe class designations
indicate the ultimate strength in T.E.B. directly in pounds per foot (new-
tons per meter) for any diameter.
9.5.4. Design Relationships
The field strength is equal to the T.E.B. test strength of the pipe times
the bedding factor. The ratio of the strength of a sewer pipe under any
290 GRAVITY SANITARY SEWER DESIGN AND CONSTRUCTION

stated condition of loading and bedding to its strength measured by the
T.E.B. test is called the bedding factor.
Bedding factors for trenches and embankments were determined
experimentally between 1925 and 1935 at Iowa State College. They can
also be calculated for most classes of bedding (Spangler 1956). The
experimentally determined and calculated relationships may be com-
bined as follows to determine the required bedding factor for any given
pipe class:
(9-28)
By rearranging this expression, the required T.E.B. strength for a given
class of bedding can be calculated as follows:
(9-29)
The strength of reinforced concrete sewer pipe in pounds per foot
(newtons per meter) at either the 0.01-inch- (0.3-mm)-crack or ultimate
load, divided by the nominal internal diameter of the sewer pipe in
inches (millimeters), is defined as the D-load strength. Different classes
of reinforced concrete pipe per ASTM C76 and other reinforced con-
crete pipe specifications are defined by D-load strengths. For example,
ASTM C76 Class IV reinforced concrete sewer pipe is manufactured to
a D-load of 2,000 lb/ft/ft of diameter (100 N/m/mm) to produce the
0.01-inch (0.3-mm) crack, and 3,000 lb/ft/ft (150 N/m/mm) to produce
the ultimate load. Consequently, a 48-inch- (1,200-mm)-diameter Class
IV reinforced concrete sewer pipe per ASTM C76 would have a mini-
mum laboratory strength of 8,000 lb/ft (120,000 N/m) to produce the
0.01-inch (0.3-mm) crack and 12,000 lb/ft (180,000 N/m) at ultimate
strength.
(9-30)
In considering the design requirements, the engineer should evaluate the
options of different types of rigid sewer pipe and different bedding
classes, keeping in mind the differences in the relationship between test
loadings and field loadings. It is customary when designing for 0.01-inch-
(0.3-mm)-crack loads to use a factor of safety of 1, and when designs are
based on ultimate strengths to use a factor of safety varying between 1.25
and 1.5.
D-load
Design Load Safety Factor
Bedding Factor Diameter
Required T.E.B.
Strength
Design Load Factor of Safety
Bedding Factor
Bedding Factor
Design Load Factor of Safety
T.E.B. Strength
STRUCTURAL REQUIREMENTS 291

9.5.5. Rigid Sewer Pipe Installation—Classes of Bedding
and Bedding Factors for Trench Conditions
Four classes of beddings, shown in Fig. 9-27, are used most often for
sewer pipes in trenches. They are described in the following subsections.
9.5.5.1. Class A Bedding—Concrete Cradle
The sewer pipe is bedded in a cast-in-place cradle of plain or reinforced
concrete having a thickness equal to one-quarter of the inside pipe diameter,
with a minimum of 4 inches (100 mm) and a maximum of 15 inches (380
mm) under the pipe barrel and extending up the sides for a height equal to
292 GRAVITY SANITARY SEWER DESIGN AND CONSTRUCTION
FIGURE 9-27. Classes of bedding for rigid sewer pipes in trench.
In rock trench, excavate at least 6 inches (152.4 mm) below bell of pipe
except where a concrete cradle is used (inch 25.4 mm). Bedding thick-
ness under pipe barrel, b, shall be
1
⁄
8
B
c
, 100 mm (4”) min, 150 mm (6”) max.
American Concrete Pipe Association (ACPA). (2000). “Concrete pipe
design manual,” ACPA, Irving, Tex. Reprinted with permission.

one-quarter of the outside diameter. The cradle shall have a width at least
equal to the outside diameter of the sewer pipe barrel plus 8 inches (200 mm).
Construction procedures must be executed carefully to prevent the sewer pipe
from floating off line and grade during placement of the cradle concrete.
If the cradle is made of reinforced concrete, the reinforcement is placed
transverse to the pipe and 3 inches (76 mm) clear from the bottom of the
cradle. The percentage of reinforcement, p, is the ratio of the area of trans-
verse reinforcement to the area of concrete cradle at the pipe invert above
the centerline of the reinforcement.
Consideration must be given to the points at which the cradle (or arch,
described in the next section) begins and terminates with respect to the
pipe joints. In general, the concrete cap, cradle, or envelope starts and ter-
minates at the face of a pipe bell or collar to avoid shear cracks.
Haunching and initial backfill above the cradle to 12 inches (300 mm)
above the crown of the sewer pipe should be placed and compacted as
described in later sections of this chapter. The cradle must be cured suffi-
ciently to develop full bedding support prior to final backfilling.
The bedding factor for Class A concrete cradle bedding is 2.2 for plain
concrete with lightly tamped backfill; 2.8 for plain concrete with carefully
tamped backfill; up to 3.4 for reinforced concrete with the percentage of
reinforcement, p, equal to 0.4%; and up to 4.8 with p equal to 1%.
9.5.5.2. Class A Bedding—Concrete Arch
The sewer pipe is bedded in carefully compacted granular material
having a minimum thickness of one-eighth of the outside sewer pipe
diameter but not less than 4 inches (100 mm) or more than 6 inches (150
mm) between the sewer pipe barrel and bottom of the trench excavation.
Granular material is then placed to the springline of the sewer pipe and
across the full breadth of the trench. The haunching material beneath the
sides of the arch must be compacted so as to be unyielding. Crushed stone
in the 0.25- to 0.75-inch (5- to 20-mm) size range is the preferred material.
The top half of the sewer pipe is covered with a cast-in-place plain or rein-
forced concrete arch having a minimum thickness of 4 inches (100 mm) or
one-quarter of the inside pipe diameter but not to exceed 15 inches (380
mm), and having a minimum width equal to the outside sewer pipe diam-
eter plus 8 inches (200 mm).
If the arch is made of reinforced concrete, the reinforcement is placed
transverse to the pipe and 2 inches (50 mm) clear from the top of the arch.
The percentage of reinforcement is the ratio of the transverse reinforce-
ment to the area of concrete arch above the top of the pipe and below the
centerline of the reinforcement.
The bedding factor for Class A concrete arch-type bedding is 2.8 for
plain concrete; up to 3.4 for reinforced concrete with p equal to 0.4%; and
up to 4.8 for p equal to 1%.
STRUCTURAL REQUIREMENTS 293

9.5.5.3. Class B Bedding
The sewer pipe is bedded in carefully compacted granular material
having a minimum thickness of one-eighth of the outside sewer pipe
diameter but not less than 4 inches (100 mm) or more than 6 inches (150
mm) between the pipe barrel and the bottom of the trench excavation.
Granular material is then placed to the springline of the pipe and across
the full width of the trench. The haunching material beneath the arches of
the pipe must be compacted so as to be unyielding. Crushed stone in the
0.25- to 0.75-inch (5- to 20-mm) size range is the preferred material. Both
haunching and initial backfill to a minimum depth of 12 inches (300 mm)
over the top of the sewer pipe should be placed and compacted.
The bedding factor for Class B bedding is 1.9.
9.5.5.4. Class C Bedding
The sewer pipe is bedded in compacted granular material. The bed-
ding has a minimum thickness of one-eighth of the outside sewer pipe
diameter but not less than 4 inches (100 mm) or more than 6 inches (150 mm),
and shall extend up the sides of the sewer pipe to one-sixth of the pipe
outside diameter. The remainder of the side fills, to a minimum depth of
6 inches (150 mm) over the top of the pipe, consists of lightly compacted
backfill.
The bedding factor for Class C bedding is 1.5.
9.5.5.5. Class D Bedding
For this class of bedding the bottom of the trench is left flat, as cut by
excavating equipment. Successful Class D installations of rigid conduits
can be achieved in locations with appropriate soil conditions, trench
width control, and light superimposed loads. Care must be taken to pre-
vent point loading of sewer pipe bells. The excavation of bell holes will
prevent such loading. Existing soil should be shovel-sliced or otherwise
compacted under the haunching of the sewer pipe to provide some uni-
form support. In poor soils, granular bedding material is generally a more
practical cost-effective installation.
Since the field conditions with Class D bedding can approach the load
conditions for the T.E.B. test, the bedding factor for Class D bedding is 1.1.
9.5.6. Encased Pipe
Total encasement of rigid sewer pipe in concrete may be necessary
where the required field strength cannot be obtained by other bedding. A
typical concrete encasement detail is shown in Fig. 9-28. The bedding fac-
tor for concrete encasement varies with the thickness of concrete and the
294 GRAVITY SANITARY SEWER DESIGN AND CONSTRUCTION

use of reinforcing, and may be greater than that for a concrete cradle or
arch. Concrete thickness and reinforcing should be determined by the
application of conventional structural theory and analysis. The bedding
factor for the encasement shown in Fig. 9-28 is 4.5.
Concrete encasement also may be required for sanitary sewers built in
deep trenches to ensure uniform support or for sewer pipe built on com-
paratively steep grades where there is the possibility that earth beddings
may be eroded by currents of water under and around the pipe. Flotation of
the pipe during concrete placement should be prevented by suitable means.
Sample Calculations
Example 9-11. Refer to Example 9-1, which describes the backfill load on a
24-inch- (610-mm)-diameter pipe with 14 ft (4.3 m) of cover; the load was
found to be 4,720 lb/ft. If vitrified clay pipe is to be specified and a factor
of safety of 1.5 is selected, the design load will be 4,720 1.5 or 7,080 lb/ft
(103,300 N/m).
The crushing strength requirement of 24-inch- (610-mm)-diameter
extra-strength clay sewer pipe (ASTM C700) based on the T.E.B. method
is 4,400 lb/ft. Dividing this into 7,080 lb/ft (the design load), the mini-
mum required bedding factor of 1.61 is obtained. Figure 9-27 and the
accompanying information indicates that a Class B bedding is required
for this installation.
STRUCTURAL REQUIREMENTS 295
FIGURE 9-28. Typical concrete encasement details (inch 25.4 mm).

Example 9-12. Refer to Example 9-3. If a 24-inch- (610-mm)-diameter rein-
forced concrete sewer pipe (one line of reinforcement near center of wall)
and a factor of safety of 1.5 based on the minimum ultimate test strength are
selected, the design load will be 1.50 5,750 or 8,620 lb/ft (125,900 N/m).
If the minimum ultimate test strength of the pipe is 6,000 lb/ft (ASTM
C76, Class IV-3,000 D), the required bedding factor will be 8,620/6,000
or 1.44. According to Fig. 9-27, this installation will require a Class C
bedding.
9.5.7. Field Strength in Embankments
It is possible for the active soil pressure against the sides of rigid sewer
pipe placed in an embankment to be a significant factor in the resistance
of the structure to vertical load. This factor is important enough to justify
a separate examination of the field strength of embankment sewer pipe.
The following discussion of field strength in embankments is based on
the theory developed by Marston and Spangler. Given the potential for
variations from the ideal conditions assumed in this theory, the design
engineer should approach designs based on this theory with some caution.
With time, lateral pressures for trench installation usually will approach
“at rest” conditions, which correspond to vertical overburden times a
factor (usually between 0.5 and 1). However, for a negative-projecting
conduit, a positive-projecting conduit, and induced trench embankment
conditions, the lateral pressure magnitude and distribution may be much
different, and these may control the structural design of the sewer pipe.
9.5.8. Positive-Projecting Sewer Pipe
The bedding factor for rigid sewer pipes installed as projecting sewer
pipe under embankments or in wide trenches depends on the class of
bedding in which the sewer pipe is laid, the magnitude of the active lat-
eral soil pressure against the sides of the sewer pipe, and the area of the
sewer pipe over which the active lateral pressure is effective.
For projecting sewer pipe, the bedding factor L
f
is:
(9-31)
in which A is a sewer pipe shape factor; N is a parameter which is a func-
tion of the bedding class; x is a parameter dependent on the area over
which lateral pressure effectively acts; and q is the ratio of total lateral
pressure to total vertical load on the sewer pipe.
Classes of bedding for projecting sewer pipe are shown in Fig. 9-29.
The values of A for circular, elliptical, and arch sewer pipe are shown
L
A
Nxq
f
296 GRAVITY SANITARY SEWER DESIGN AND CONSTRUCTION

in Table 9-12. Values of N for various classes of bedding are given in
Table 9-13. Values of x for circular, elliptical, and arch sewer pipe are
listed in Table 9-14.
The projection ratio, m, in Eq. (9-32) refers to the fraction of the sewer
pipe diameter over which lateral pressure is effective. For example, if
lateral pressure acts on the top half of the sewer pipe above the hori-
zontal diameter, m equals 0.5. The ratio of total lateral pressure to total
STRUCTURAL REQUIREMENTS 297
FIGURE 9-29. Classes of bedding for projecting sewer pipes (ft 0.3 m; inch
25.4 mm).

298 GRAVITY SANITARY SEWER DESIGN AND CONSTRUCTION
TABLE 9-12. Values of A for Circular, Elliptical, and Arch Sewer Pipe
Sewer Pipe Shape A
Circular 1.431
Elliptical:
Horizontal elliptical and arch 1.337
Vertical elliptical 1.021
TABLE 9-13. Values of N
Value of N
Sewer Pipe Shape
Horizontal Vertical
Class of Bedding Circular Elliptical Elliptical
A (reinforced cradle) 0.421–0.505 — —
A (unreinforced cradle) 0.505–0.636 — —
B 0.707 0.630 0.516
C 0.840 0.763 0.615
D 1.310 — —
TABLE 9-14. Values of x
x
Class A
Bedding Other than Class A Bedding
Fraction of
Sewer Pipe Horizontal Vertical
Subjected to Circular Circular Elliptical Elliptical
Lateral Pressure Sewer Pipe Sewer Pipe Sewer Pipe Sewer Pipe
0 0.150 0 0 0
0.3 0.743 0.217 0.146 0.238
0.5 0.856 0.423 0.268 0.457
0.7 0.811 0.594 0.369 0.639
0.9 0.678 0.655 0.421 0.718
1.0 0.638 0.638 — —

vertical load, q, for positive-projecting sewer pipe may be estimated by
the formula:
(9-32)
where
K the ratio of unit lateral pressure to unit vertical pressure
(Rankine’s ratio)
H height of cover
B
c
outside diameter of pipe.
A value of K equal to 0.33 usually will be sufficiently accurate for use in
Eq. (9-32). Values of C
c
are found in Fig. 9-8.
9.5.9. Negative-Projecting Sewer Pipe
The bedding factor for negative-projecting sewer pipe may be the same
as that for trench conditions corresponding to the various classes of bedding
given in Section 9.5.5. The bedding factors for Class B, C, and D bedding do
not take into account lateral pressures against the sides of the sewer pipe
because unfavorable construction conditions often prevail at the bottom of a
trench. However, in the case of negative-projecting sewer pipe, conditions
may be more favorable and it may be possible to compact the side fill soils to
the extent that some lateral pressure against the sewer pipe can be relied on.
If such favorable conditions are anticipated, it is suggested that the bed-
ding factor be computed by means of Eqs. (9-31) and (9-32), using a value of
K equal to 0.15 for estimating the lateral pressure on the sewer pipe.
9.5.10. Induced Trench Conditions
Induced trench sewer pipes usually are installed as positive-projecting
sewer pipes before the overlying soil is compacted and the induced trench
is excavated. Therefore, lateral pressures are effective against the sides of
the sewer pipe and the bedding factor should be calculated using Eqs.
(9-31) and (9-32).
9.6. FLEXIBLE PIPE STRUCTURAL DESIGN
Several types of flexible pipe are available for use as sanitary sewer
pipe material. Among the most common are ductile iron pipe (DIP), acry-
lonitrile-butadiene-styrene (ABS) composite pipe, and ABS solid wall
pipe, polyvinyl chloride (PVC) pipe, polyethylene (PE) pipe, fiberglass-
q
mK
C
H
B
m
K
cc
2
⎛
⎝
⎜
⎞
⎠
⎟
STRUCTURAL REQUIREMENTS 299

reinforced plastic (FRP), and reinforced plastic mortar (RPM) pipe.
Coated corrugated metal pipe (CMP) has been used for sanitary sewer
pipe, but its use is not common.
9.6.1. General Method
Flexible sewer pipes under earth fills and in trenches derive their abil-
ity to support load from their inherent strength plus the passive resistance
of the soil as the pipe deflects and the sides of the sewer pipe move out-
ward against the soil side fills. Proper compaction of the soil side fills is
important to the long-term structural performance of flexible sewer pipe.
This type of pipe fails by excessive deflection and by collapse, buckling,
cracking, or delamination rather than by rupture of the sewer pipe walls,
as in the case of rigid pipes. The extent to which flexible pipe deflects is
most commonly used to judge performance and as a basis for design. The
amount of deflection considered permissible is dependent on physical
properties of the pipe material used and on project limitations.
The limiting buckling stress for flexible pipes takes into account the
restraining effect of the soil structure around the pipe and the properties
of the pipe wall. Equations for the critical stress in the pipe wall can be
found in manufacturers’ handbooks for the various types of pipe.
Empirical data on long-term deflection in different burial conditions
generally can be obtained from the manufacturer. When such design data
are not available, the approximate long-term deflection of flexible sewer
pipe can be calculated using the Modified Iowa Formula developed by
Watkins and Spangler (1958):
(9-33)
where
X horizontal deflection, in inches (mm)
K
b
bedding factor
D
L
deflection lag factor
W
c
load, in lb/ft (N/m)
r mean radius of pipe, in inches (mm)
E modulus of tensile elasticity, in lb/inch
2
(N/m
2
)
I moment of inertia per length, in inches (mm) to fourth power
per inch (mm)
Emodulus of soil reaction, in lb/inch
2
(N/m
2
).
Equation (9-33) was developed primarily for flexible corrugated metal
sewer pipe under embankments, but has been shown to be applicable to
most flexible pipe materials.
X
DKWr
EI E r
L
b
c
5
3
0 061.
′
300 GRAVITY SANITARY SEWER DESIGN AND CONSTRUCTION

For small deflections, the vertical deflection Y may be assumed to
approximately equal the horizontal deflection X in Eq. (9-33). Much
research is being conducted on the application of Eq. (9-33) to pipe having
a low ratio of pipe stiffness to soil stiffness where the vertical deflection
may not be assumed to approximately equal the horizontal deflection.
The result of this research is beyond the scope of this chapter but should
be reviewed by the designer as a part of the design process.
Flexible sewer pipes that are to support a fill should not be placed
directly on a cradle or on pile bents. If such supports are necessary, they
should have a flat top and be covered with a compressible earth cushion.
In those instances where flexible pipe is to be encased in concrete, the pipe
manufacturer should be consulted. Flexible pipes should not be encased
in concrete unless the encasement is designed for the full vertical load as a
rigid pipe.
The passive resistance of the soil at the sides of the pipe greatly influ-
ences pipe deflection. This passive resistance is expressed as the modulus
of soil reaction, E. It is generally recognized as being related to the degree
of compaction of the soil and to the type of soil. Extensive laboratory and
field tests by the U.S. Bureau of Reclamation have resulted in the estab-
lishment of an empirical relationship between modulus of soil reaction,
degree of compaction of bedding, and type of bedding material. Recom-
mended values for E in Eq. (9-33) have been developed and are given in
Table 9-15 (Howard 1977). (See Table 9-16 for soil symbol definitions.)
The deflection lag factor, empirically determined, compensates for the
time consolidation characteristics of soil, which may permit flexible sewer
pipes to continue to deform for some period after installation. Long-term
deflection will be greater with light or moderate degrees of compaction of
side fills when compared to values for heavy compaction. The better the
compaction, the lower the initial deflection and the greater the magnitude
of the long-term lag factor. Lag factors greater than 2.5 have been
recorded in dry soil. Recommended values of this factor range from 1.25
to 1.5. Bedding requirements for flexible sewer pipe installation are dis-
cussed below.
Values of the bedding constant, K
b
, depending on the width of the
sewer pipe bedding, are shown in Table 9-17.
In the deflection formula [Eq. (9-33)], the first term in the denominator,
EI (stiffness factor), reflects the influence of the inherent stiffness of the
sewer pipe on deflection. The second term, 0.061 Er
3
, reflects the influ-
ence of the passive pressure on the sides of the pipe. With flexible pipes,
the second term is normally predominant.
It should be noted that the E values in Table 9-15 are average values.
Using them results in a 50% chance that the actual deflections will be
higher than calculated. A conservative approach would be to use 75% of
the E values given to calculate maximum deflections.
STRUCTURAL REQUIREMENTS 301

TABLE 9-15. Average Values of Modulus of Soil Reaction E, for Initial Flexible Pipe Deflection
E’ for Degree of Compaction of Bedding, in psi (Pa)
Moderate, 85%–95% High, 95%
Soil Type Pipe Bedding Material Slight, 85% Proctor, Proctor, 40%–70% Proctor, 70%
(United Classification System
a
) Dumped 40% Relative Density Relative Density Relative Density
Fine-grained soils (LL 50)
b
Soils with medium to high plasticity
CH, MH, CH-MH No data available; consult a competent soils engineer; otherwise use E 0
Fine-grained soils (LL 50)
Soils with medium to no plasticity
CL, ML, ML-CL, with less than 25%
coarse-grained particles 50 (340) 200 (1,380) 400 (2,760) 1,000 (6,890)
Fine-grained soils (LL 50)
Soils with medium to no plasticity
CL, ML, ML-CL, with more than 25%
coarse-grained particles
Coarse-grained soils with fines
GM, GC, SM, SC, with more than 12% fines 100 (690) 400 (2,760) 1,000 (6,890) 2,000 (13,790)
Coarse-grained soils with little or no fines
GW, GP, SW, SP
c
(contains less than 12% fines) 200 (1,380) 1,000 (6,890) 1,000 (6,890) 2,000 (13,790)
Crushed rock 1,000 (6,890) 3,000 (20,680) 3,000 (20,680) 3,000 (20,680)
1. Standard Proctors in accordance with ASTM D698 are used with this table.
2. Values applicable only for fills less than 50 ft (15 m). Table does not include any safety factor. For use in predicting initial deflections only, the appropriate deflection lag
factor must be applied for long-term deflections. If bedding falls on the borderline between two compaction categories, select lower E value or average the two values.
3. It should be noted that the E values in Table 9-15 are average values. Using them results in a 50% chance that the actual deflections will be higher than calculated. A con-
servative approach would be to use 75% of the E values given to calculate maximum deflections.
a
ASTM Designation D2487, USBR Designation E-3.
b
LL, liquid limit.
c
Or any borderline soil beginning with one of these symbols (e.g., GM-GC, GC-SC).

The performance of the flexible sewer pipe in retaining its shape and
integrity is largely dependent on the selection, placement, and com-
paction of the envelope of soil surrounding the structure. For this reason,
as much care should be taken in the design of the bedding and initial
backfill as is used in the design of the sewer pipe. The backfill material
selected should preferably be of a granular nature to provide good shear
characteristics. Cohesive soils are generally less suitable because of the
importance of proper moisture content and the difficulty of obtaining
proper compaction in a limited work space. If the pipe–soil envelope is
subject to variations in the groundwater level, the engineer will need to
take steps to prevent migration of fines from the surrounding material
into the granular backfill, resulting in a loss of sidewall support.
STRUCTURAL REQUIREMENTS 303
TABLE 9-16. Soil Classifications
a
Soil Class Group Symbol Typical Names Comments
I Crushed rock Angular, 6–40 mm
II GW Well-graded gravels 40 mm maximum
GP Poorly graded gravels
SW Well-graded sands
SP Poorly graded sands
III GM Silty gravels
GC Clayey gravels
SM Silty sands
SC Clayey sands
IV MH, ML Inorganic silts Not recommended for
CH, CL Inorganic clays bedding, haunching,
V OL, OH Organic silts and clays or initial backfill
PT Peat
a
Adapted, with permission, from ASTM D2321-89, “Standard Practice for Underground
Installation of Thermoplastic Pipe for Sewers and Other Gravity-Flow Applications.”
Copyright © 2005 ASTM International, West Conshohocken, Penn.
TABLE 9-17. Values of Bedding Constant, K
b
Bedding Angle, in degrees K
b
0 0.110
30 0.108
45 0.105
60 0.102
90 0.096
120 0.090
180 0.083

If, under embankment conditions, the material placed around the
sewer pipe is different from that used in the embankment, or if for con-
struction reasons fill is placed around the sewer pipe before the embank-
ment is built, the compacted backfill should cover the pipe by at least 1 ft
(0.3 m) and extend at least one diameter to either side.
9.6.2. Loads on Flexible Plastic Pipe
The load carried by a buried flexible pipe in a narrow trench may be
calculated using the Marston formula [Eq. (9-3)]. A conservative design
approach may be used by assuming the dead load carried by a flexible
pipe–soil system in any installation to be the prism load. For normal
installations, the prism load is the maximum load that can he developed.
The load on a projecting flexible sewer pipe is calculated using Eq. (9-8).
As before, the load coefficient (C
c
) depends on the projection ratio (p), set-
tlement ratio (r
sd
), and the ratio of fill height to pipe width (H/B
c
), and can
be determined from Fig. 9-8. For flexible projecting pipe, the product r
sd
p
is negative or zero. As shown in Fig. 9-8, when the product is zero the
load coefficient, C
c
, equals H/B
c
. Equation (9-8) then becomes equivalent
to Eq. (9-1), which gives the prism load:
W
d
HwB
c
9.6.3. Thermoplastic Pipe
A wide range of physical properties is available from various plastic
sewer pipe materials. Many have ASTM or ANSI specifications. Thermo-
plastic pipe materials (ABS, PE, and PVC) are all affected by tempera-
ture. Specified test requirements are applicable at 73.4 °F (23 °C). At
higher temperatures, the plastic becomes less rigid but impact strength is
increased. Lower temperatures result in increased brittleness but greater
pipe stiffness. Pipe being installed at low temperatures requires careful
handling. Certain chemicals will increase the possibility of environmental
stress cracking (ESC) for certain thermoplastics. Typically, these com-
pounds include concentrated oxidizing agents, organic chemicals, and
oils, fats, and waxes. If any of these compounds are expected in high con-
centrations, the engineer should review the proposed application with the
pipe manufacturer. It may be possible to compensate by utilizing a differ-
ent plastic formulation or by utilizing another material.
9.6.3.1. Laboratory Load Test
The standard test to determine pipe stiffness or load deflection charac-
teristics of plastic pipe is the parallel-plate loading test. This test is con-
ducted in accordance with ASTM D2412, Standard Test Method for
304 GRAVITY SANITARY SEWER DESIGN AND CONSTRUCTION

External Loading Properties of Plastic Pipe by Parallel-Plate Loading. In
the test, a short length of pipe is loaded between two rigid, parallel flat
plates as they are moved together at a controlled rate. Load and deflection
are noted. The parallel-plate loading test determines the pipe stiffness
(PS) at a prescribed deflection, which for convenience in testing is arbi-
trarily set at 5%. This is not to be considered a limitation on field deflec-
tion. The pipe stiffness is defined as the value obtained by dividing the
force (F) per unit length by the resulting deflection in the same units at the
prescribed percentage deflection, and is expressed in pounds per square
inch (newtons per square millimeter):
(9-34)
where
F force per unit length, in lb/inch (N/mm)
Y deflection, in inches (mm)
E modulus of elasticity, in lb/inch
2
(N/m
2
)
r mean radius of pipe, in inches (mm)
I t
3
/12
t wall thickness, in inches (mm).
Minimum required pipe stiffness values are stated in plastic sewer
pipe specifications. Table 9-18 lists the ASTM specifications for the vari-
ous types of plastic pipe and the corresponding pipe stiffness values.
The stiffness factor, SF, is the pipe stiffness multiplied by the quantity
0.149r
3
.
(9-35)
(9-36)
The stiffness factor, EI, is used in the Modified Iowa Formula [Eq. (9-33)]
to determine approximate field deflections under earth loads. It is the
engineer’s responsibility to establish the acceptable field deflection limit
and to design the installation accordingly. The manufacturer should be
consulted for recommended field installation deflection limits.
Specifications also may require that some types of plastic sewer pipe
withstand extreme deflections, such as 40% of the original diameter in a
parallel-plate loading test, without evidence of splitting, cracking, or break-
ing. There is no corresponding load requirement. These extreme deflection
tests are instantaneous and are intended for production quality control
during pipe manufacturing. Although these extreme deflections (observed
SF r PS 0 149
3
.
()
SF EI
F
Y
r
0 149
3
.
PS
F
Y
EI
r
0 149
3
.
STRUCTURAL REQUIREMENTS 305

in ASTM D2412 testing) are limiting in terms of duration and extent of
pipe distortion, they can be important to the engineer in selecting sewer
pipe materials of construction.
9.6.3.2. Methods of Analysis
Plastic pipe analysis requires the engineer to check values that include
pipe stiffness, pipe deflection, ring buckling strength, hydrostatic wall
buckling, wall crushing strength, and wall strain cracking.
Pipe Stiffness. When plastic pipe is installed in granular backfills, the
stiffness of the plastic pipe selected will affect the end performance. Stiff-
306 GRAVITY SANITARY SEWER DESIGN AND CONSTRUCTION
TABLE 9-18. Stiffness Requirements for Plastic Sewer Pipe
Parallel-Plate Loading
Required stiffness
ASTM Nominal diameter, at 5% deflection,
Material Specification D, inches (mm) lb/inch
2
(kPa)
ABS Composite D2680 8–15 (200–380) 200 (1,380)
RPM D3262 8–18 (200–450) 17–99 (Varies)
20–108 (500–2,750) 10 (69)
PVC D2729 2 (50) 59 (407)
(PVC-12454) 3 (75) 19 (131)
4 (100) 11 (76)
5 (125) 9 (62)
6 (150) 8 (55)
D2729 2 (50) 74 (510)
(PVC-13364) 3 (75) 24 (165)
4 (100) 13 90)
5 (125) 12 (83)
6 150) 10 (69)
D3034 4–15 (100–375)
SDR 41 28 (193)
SDR 35 46 (317)
SDR 26 115 (792)
SDR 23.5 135 (930)
F679 18–48 (450–1,200) 46 (317)
115 (792)
F794 4–48 (100–1,200) 46 (317)
F949 4–36 (100–900) 317 (46)
8 and 10 (200 and 250) 792 (115)
F1803 18–60 (450–1,500) 46 (317)
PVC Composite D2680 8–15 (200–375) 200 (1,380)

ness for plastic pipes is most widely discussed in terms of pipe stiffness
(F/Y), which must be measured by the ASTM D2412 test. Most plastic
pipe standards have specific minimum required pipe stiffness levels.
Although pipe stiffness is used to estimate deflections due to service
loads, stiffness is also the primary factor in controlling installation
deflections.
AASHTO controls installation deflection with a flexibility factor (FF)
limit indicated in Eqs. (9-37) and (9-38).
(9-37)
(9-38)
where
D mean pipe diameter, inch (m)
E the initial modulus (Young’s modulus) of the pipe wall
material, lb/inch
2
(N/m
2
)
I pipe wall moment of inertia, inch
4
/inch (m
4
/m)
C
FF
constant: 95 English (0.542 metric)
PS pipe stiffness, lb/inch
2
(N/m
2
)
r mean pipe radius, inch (m)
C
PS
constant: 565 English (98,946 metric).
Deflection. Excessive pipe deflections should not occur if the proper
pipe is selected and it is properly installed and backfilled with granular
materials. However, when pipes are installed in cohesive soils, the deflec-
tion can be excessive. Deflections occur from installation loadings (the
placement and compaction of backfill) and service loads due to soil cover
and live loads.
In installations in cohesive soils, where heavy compaction equipment
is often used or when difficult to compact backfill materials (GP, SP, CL,
ML, etc.; refer to Table 9-8) are used, specifying a minimum pipe stiffness
of 46 psi (317 N/m
2
) or twice that required by Eq. (9-38), whichever is less,
is desirable to facilitate backfill compaction and control installation
deflections.
Deflections under service loads depend mostly on the quality and com-
paction level of the backfill material in the pipe envelope. Service load
deflections are generally evaluated by using Spangler’s Iowa Formula:
Y
D
KWr
EI E r
=
′
3
3
0 061 (. )
PS
EI
r
C
D
PS
0 149
3
.
FF
D
EI
C
FF
2
1000
STRUCTURAL REQUIREMENTS 307

where
Y/D pipe deflection, percent
K bedding constant
W service load on crown of pipe, lb/inch (N/mm)
r mean pipe radius, inches (mm)
E and I have meanings previously given
Emodulus of soil reaction, lb/inch
2
(N/m
2
).
However, it significantly overpredicts deflections for stiffer pipes [pipe
stiffnesses greater than 100 lb/inch
2
(4,790 N/m
2
)] and underpredicts
deflections for less stiff pipes [pipe stiffnesses less than 20 lb/inch
2
(960
N/m
2
)]. In both cases, the error is roughly a factor of 2. The form of the
Iowa Formula (Eq. 9-28) easiest to use is shown in Eq. (9-39):
(9-39)
where
Y/D pipe deflection, percent
D
L
deflection lag factor
1 minimum value for use only with granular backfill and if
the full soil prism load is assumed to act on the pipe
1.5 minimum value for use with granular backfill and
assumed trench loadings
2.5 minimum value for use with CL and ML backfills, for
conditions where the backfill can become saturated, etc.
K bedding constant (typically 0.11)
P service load on the crown of the pipe, lb/inch
2
(N/m
2
)
PS pipe stiffness, lb/inch
22
(N/m
2
)
Emodulus of soil reaction, lb/inch
2
(N/m
2
).
Table 9-15 provides generally accepted values that may apply to specific
site conditions and backfill materials if they do not become saturated or
inundated.
Wall Stress (Crushing). Wall stress is evaluated on the basis of conven-
tional ring compression formulas. Because of the time-dependent
strength levels of plastic materials, long-term loads such as soil and other
dead loads must be evaluated against the material’s long-term (50-year)
strength. Very short-term loads, such as rolling vehicle loads, may be
evaluated using initial properties. The following equations are used to
evaluate wall stress:
(9-40)
T
DP
ST
ST
2
Y
D
DKP
PS E
L
0 149 0 061
100
.().()+
′
⎛
⎝
⎜
⎞
⎠
⎟
308 GRAVITY SANITARY SEWER DESIGN AND CONSTRUCTION

(9-41)
(9-42)
where
T
ST
thrust due to short-term loads
D pipe diameter or span, ft (m)
P
ST
short-term load at the top of the pipe, psf (N/m
2
)
T
LT
thrust due to long-term loads
P
LT
long-term load at the top of the pipe, psf (N/m
2
)
A required wall area using a minimum factor of safety of 2 (A/10
6
inch
2
/ft)
f
i
initial tensile strength level, psi (N/m
2
) (Table 9-19)
f
50
50-year tensile strength level, psi (N/m
2
) (Table 9-19).
Ring Buckling. The backfilled pipe may buckle whether the groundwa-
ter table is above the bottom of the pipe or not. The critical buckling stress
may be evaluated by the AASHTO formula shown in Eq. (9-43):
(9-43)
where
f
cr
maximum, critical stress in the pipe wall, psi (N/m
2
), using a
factor of safety of 2
r mean pipe radius, inch (m)
A pipe wall area, inch
2
/inch (mm
2
/m)
B water buoyancy factor
1 0.33 h
w
/h
h
w
height of water surface above the top of pipe, ft (m)
h height of cover above the top of pipe, ft (m)
M
s
soil modulus of the backfill material, psi (N/m
2
)
E 50-year modulus of elasticity of the pipe wall material, psi (N/m
2
)
I pipe wall moment of inertia, inch
4
/inch (mm
4
/m)
Hydrostatic Buckling. When pipes are submerged but not adequately
backfilled, the critical hydrostatic pressure to cause buckling can be eval-
uated by the Timoshenko buckling formula provided in Eq. (9-44). The
variable C is used to account for the decrease in buckling stress due to
pipe out-of-roundness, P
cr
.
f
r
A
BM EI
r
cr
s
077
0 149
3
.
.
A
T
f
T
f
ST
i
LT
210
50
6
⎛
⎝
⎜
⎞
⎠
⎟
T
DP
LT
LT
2
STRUCTURAL REQUIREMENTS 309

TABLE 9-19. Mechanical Properties for Plastic Pipe Design
Initial Initial 50-Year 50-Year
Minimum Minimum Minimum Minimum Strain Pipe
Tensile Modulus Tensile Modulus Limit Stiffness
Type of Strength of Elasticity Strength of Elasticity Percent kPa
Pipe MPa (psi) MPa (psi) Standard Cell Class MPa (psi) MPa (psi) (%) (psi)
Smooth Wall, PE 20.7 758 ASTM D 3350, 335434C 9.93 152 5 Varies
(3,000) (110,000) ASTM F 714 (1,440) (22,000)
Corrugated PE 20.7 758 ASTM D 3350, 335412C 6.21 152 5 Varies
(3,000) (110,000) AASHTO M 294 (900) (22,000)
Ribbed, PE 20.7 758 ASTM D 3350, 335434C 9.93 152 5 320
(3,000) (110,000) AASHTO M 278 (1,440) (22,000) (46)
ASTM F 679
Smooth Wall, PVC 48.3 2,758 ASTM D 1754, 12454C 25.51 965 5 320
(7,000) (400,000) AASHTO M 278 (3,700) (140,400) (46)
ASTM F 679
Smooth Wall, PVC 41.4 3,034 ASTM D 1784, 12364C 17.93 1,092 3.5 320
(6,000) (440,000) ASTM F 679 (2,600) (158,400) (46)
Ribbed, PVC 41.4 3,034 ASTM D 1784, 12454C 17.93 1,092 3.5 70 (10)
(6,000) (440,000) ASTM F 794 (2,600) (158,400) 320 (46)
Ribbed, PVC 48.3 2,758 ASTM D 1784, 12454C 25.51 965 5 348
(7,000) (400,000) ASTM F 794 & (3,700) (140,000) (50)
ASTM F 949
PVC Composite 48.3 2,758 ASTM D 1784, 12454C 25.51 965 5 1,380
(7,000) (400,000) ASTM D 2680 (3,700) (140,000) (200)
U.S. Army Corp of Engineers (USACE). (1998). “Engineering and design: Conduits, culverts, and pipes, “ Engineer Manual 1110-2-2902, USACE,
Washington, D.C.

(9-44)
where
P
cr
critical buckling pressure, psf (N/m
2
)
C ovality factor
0% deflectionC 1
1% deflectionC 0.91
2% deflectionC 0.84
3% deflectionC 0.76
4% deflectionC 0.70
5% deflectionC 0.64
K constant 216 English [1.5(10)
12
metric],
r mean pipe radius, inch (m)
Poisson’s ratio for the pipe wall material (typically 0.33 to 0.45).
A factor of safety of 2 is typically applied for round pipe. However,
note that 5% pipe deflection reduces P
cr
to 64% of its calculated value.
Equation (9-44) can be conservatively applied to hydrostatic uplift forces
acting on the invert of round pipes.
Wall Strain Cracking. Wall strain cracking is a common mode of failure
in plastic pipe. AASHTO provides information on the allowable long-
term strain limits for many plastics. Excessive wall strain will lead to an
accelerated premature failure of the pipe. The typical long-term strain
value for PE and PVC is 5% at a modulus of 400,000 psi (2,760 MPa), or
3.5% for PVC with a modulus of 440,000 psi (3,030 MPa)
(9-45)
where
ε
b
bending strain due to deflection, percent
t
max
pipe wall thickness, inch (m)
D mean pipe diameter, inch (m)
Y/D pipe deflection, percent
ε
limit
maximum long-term strain limit of pipe wall, percent
F.S. safety factor, minimum 2 recommended.
ε
ε
b
max limit
t
D
Y
D
Y
D
FS
003
1002
.
.
..
⎛
⎝
⎜
⎜
⎜
⎞
⎠
⎟
⎟
⎟
PC
KEI
r
cr
()
()1
23
⎛
⎝
⎜
⎞
⎠
⎟
STRUCTURAL REQUIREMENTS 311

9.6.4. Thermosetting Resin (Fiberglass) Pipe
Reinforced thermosetting resin pipe (RTRP), commonly referred to as
fiberglass pipe, is designed and manufactured in accordance with stan-
dards presented by the American National Standards Institute (ANSI),
the American Water Works Association (AWWA), and ASTM Interna-
tional (ASTM). The standards used for designing and manufacturing
RTRP for sanitary sewage and other liquids under pressure are ANSI/
AWWA C950. Gravity sewer pipe is designed under ASTM D3262.
The design procedures within these standards are conservative. The
basis of the design standard is that fiberglass behaves as a flexible con-
duit when subjected to internal pressure and external loading conditions.
The pipe is designed separately to withstand external loads and internal
pressures.
9.6.4.1. Design Conditions
The following conditions should be established before performing
structural design calculations:
• Nominal Pipe Size. Nominal pipe sizes are given in Tables 1 through
6 of ANSI/AWWA Standard C950.
• Working Pressure. The pressure class of the pipe should be equal to or
greater than the working pressure in the system. The working pres-
sure will be minimal, or zero, in gravity lines.
• Surge Pressure. Surge pressure should be calculated using recog-
nized hydraulic equations. The surge pressure is equal to zero in
gravity lines.
• Soil Conditions. The stresses in the soil at a depth below the ground
surface, which includes those due to the weight above the pipe and
any buoyant forces that the water in the soil exerts.
• Pipe-Laying Conditions. Soil conditions for the pipe zone embedment
and native material at pipe depth.
• Depth of Cover. The minimum and maximum cover measured from
the burial depth to the top of the pipe.
• Vehicular Traffic Load. Vehicular traffic loads are calculated as out-
lined earlier in this chapter.
9.6.4.2. Other Design Considerations
Fiberglass pipe systems are resistant to corrosion, both inside and out,
in a wide range of fluid-handling applications. As a result, additional lin-
ings and exterior coatings are not required. Fiberglass composite piping
systems have excellent strength-to-weight properties. The ratio of strength
per unit of weight of fiberglass composites is greater than that of iron, car-
bon, and stainless steels. Fiberglass composites are lightweight, ranging
312 GRAVITY SANITARY SEWER DESIGN AND CONSTRUCTION

from one-sixth the weight of similar steel products to one-tenth the
weight of similar concrete products.
9.6.4.3. Design Method
The design method for fiberglass pipe is based on ANSI/AWWA C950
or AWWA M45. The most important property of the pipe is to determine
the wall thickness that will withstand external trench loadings and inter-
nal pressures. From the determined wall thickness, the designer can then
select the nominal thickness and standard pressure class from those spec-
ified for fiberglass pipe.
9.6.4.3.1. Determining Internal Pressure
The hydrostatic design basis (HDB) of the fiberglass pipe is defined in
terms of reinforced wall hoop stress or hoop strain on the inside surface of
the pipe as per ANSI/AWWA C950. The HDB of fiberglass pipe is based on
a 50-year product performance and will vary for different manufacturers
depending on the materials and composition used in the reinforced wall.
For stress basis HDB:
(9-46, English)
(9-46, SI)
For strain basis HDB:
(9-47, English)
(9-47, SI)
where
P
c
pressure class, lb/in
2
(kPa)
HDB hydrostatic design basis, lb/in
2
(N/m
2
)
F.S. factor of safety, 1.8
t pipe reinforced wall thickness, inch (mm)
E
H
hoop tensile modulus of elasticity for pipe, lb/in
2
(GPa)
(See Table 9-20)
D mean pipe diameter, inch (mm)
(OD t)
OD outside diameter, inch (mm).
P
HDB
FS
tE
D
c
H
..
⎛
⎝
⎜
⎞
⎠
⎟
⎛
⎝
⎜
⎞
⎠
⎟
2
10
6
P
HDB
FS
tE
D
c
H
..
⎛
⎝
⎜
⎞
⎠
⎟
⎛
⎝
⎜
⎞
⎠
⎟
2
P
HDB
FS
t
D
c
..
⎛
⎝
⎜
⎞
⎠
⎟
⎛
⎝
⎜
⎞
⎠
⎟
2
10
3
P
HDB
FS
t
D
c
..
⎛
⎝
⎜
⎞
⎠
⎟
⎛
⎝
⎜
⎞
⎠
⎟
2
STRUCTURAL REQUIREMENTS 313

There are two design factors required in ANSI/AWWA Standard C950
for internal pressure design. The first design factor is the ratio of short-term
ultimate hoop tensile strength, S
i
, to hoop tensile stress, S
r
, at pressure class
P
c
. The hoop tensile strength values for typical sewer pipe are given in Table
9-20. Hoop tensile strength for sizes not shown in Table 9-20 can be found in
Table 10 of ANSI/AWWA Standard C950. All of these requirements are
based on a minimum design factor of 4 on initial hydrostatic strength. The
second design factor is the ratio of HDB to hoop stress or strain, S
r
, at pres-
sure class P
c
. This minimum design factor is 1.8 for fiberglass pipe.
9.6.4.3.2. Determining Working Pressure
The pressure class of the pipe should be equal to or greater than the
working pressure in the system.
P
c
P
w
where P
w
working pressure, psi (Pa).
9.6.4.3.3. Determining Bending Stress and Strain
Ring bending strain (or stress) should not occur when the pipe reaches
the allowable long-term pipe deflection. The following equations verify
that this condition is not met.
314 GRAVITY SANITARY SEWER DESIGN AND CONSTRUCTION
TABLE 9-20. Hoop Tensile Strength for Fiberglass Pipe
Pressure Class, psi (kPa)
Nominal
100 (689) 150 (1,034) 200 (1,379) 250 (1,724)
Pipe Size, Minimum Hoop Tensile Strength
inch (mm) lbf/inch of width (kN/m of width)
8 (200) 1,600 (280) 2,400 (420) 3,200 (560) 4,000 (700)
12 (300) 2,400 (420) 3,600 (630) 4,800 (840) 6,000 (1,050)
15 (375) 3,000 (525) 4,500 (788) 6,000 (1,050) 7,500 (1,313)
18 (450) 3,600 (630) 5,400 (945) 7,200 (1,260) 9,000 (1,575)
24 (600) 4,800 (840) 7,200 (1,260) 9,600 (1,680) 12,000 (2,100)
30 (750) 6,000 (1,050) 9,000 (1,575) 12,000 (2,100) 15,000 (2,625)
36 (900) 7,200 (1,260) 10,800 (1,890) 14,400 (2,520) 18,000 (3,150)
42 (1,100) 8,400 (1,470) 12,600 (2,205) 16,800 (2,940) 21,000 (3,675)
48 (1,200) 9,600 (1,680) 14,400 (2,520) 19,200 (3,360) 24,000 (4,200)
60 (1,500) 12,000 (2,100) 18,000 (3,150) 24,000 (4,200) 30,000 (5,250)
72 (1,800) 14,400 (2,520) 21,600 (3,780) 28,800 (5,040) 36,000 (6,300)
90 (2,300) 18,000 (3,150) 27,000 (4,725) 36,000 (6,300) 45,000 (7,875)
Reprinted from AWWA Standard C950-01: Fiberglass pressure pipe, by permission. Copyright
2001 American Water Works Association.

For stress basis:
(9-48, English)
(9-48, SI)
For strain basis (most common check):
(9-49)
where
b
maximum ring bending stress due to deflection, psi (MPa)
D
f
shape factor, dimensionless (See Table 9-21)
E ring flexural modulus of elasticity for the pipe, psi (GPa)
y
A
maximum allowable long-term vertical pipe deflection, inch (mm)
d maximum permitted long-term installed deflection, inch
(mm)—typically chosen to be less than y
A
D mean pipe diameter, inch (mm)
t total wall thickness, inch (mm)
S
b
long-term ring bending strain for the pipe, inch/inch (mm/mm)
F.S. factor of safety, 1.5
ε
b
maximum ring-bending strain due to deflection, inch/inch
(mm/mm).
The shape factor is dependent on both the pipe stiffness and the instal-
lation (e.g., backfill material, backfill density, compaction method, haunch-
ing, trench configuration, native soil characteristics, and vertical loading).
A conservative chart assuming that tamped compaction limits the long-
term deflections to 5% will give the shape factors in Table 9-21.
εε
b
f
A
b
b
f
D
y
D
t
D
S
FS
D
t
D
d
D
⎛
⎝
⎜
⎞
⎠
⎟
⎛
⎝
⎜
⎞
⎠
⎟
⎛
⎝
⎜
⎞
⎠
⎟
⎛
⎝
⎜
⎞
⎠
⎟
..
or
b
f
A
b
DE
y
D
t
D
SE
FS
10 10
33
⎛
⎝
⎜
⎞
⎠
⎟
⎛
⎝
⎜
⎞
⎠
⎟
..
b
f
A
b
DE
y
D
t
D
SE
FS
⎛
⎝
⎜
⎞
⎠
⎟
⎛
⎝
⎜
⎞
⎠
⎟
..
STRUCTURAL REQUIREMENTS 315
TABLE 9-21. Shape Factors for Fiberglass Pipe
a
Pipe Stiffness, psi (kPa) D
f
9 (62) 8.0
18 (124) 6.5
36 (248) 5.5
72 (496) 4.5
a
Products may have use limits of other than 5% long-term deflection. In such cases, the
requirements should be proportionally adjusted. For example, a 4% long-term limiting deflec-
tion would result in a 50-year requirement of 80% of the values given in Table 9-21, whereas
a 6% limiting deflection would yield a requirement of 120% of the values given in Table 9-21.
Reprinted from AWWA Manual of Practice M45: Fiberglass pipe design, by permission. Copy-
right 2005 American Water Works Association.

9.6.4.3.4. Determining Deflection
Sewer pipe should be installed to ensure that external loading would
not cause a long-term decrease in the vertical diameter of the pipe. The
pipe must be capable of withstanding a 5% long-term deflection; there-
fore, the maximum allowable deflection may be stated as follows:
(9-50)
where
predicted vertical pipe deflection, fraction of mean diameter;
maximum deflection for fiberglass is typically 5%
permitted vertical pipe deflection, fraction of mean diameter
maximum allowable vertical pipe deflection, fraction of mean
diameter.
The amount of deflection is a function of the soil load, live load, native
soil characteristics at pipe elevation, pipe embedment material and den-
sity, trench width, haunching, and pipe stiffness.
(9-51, English)
(9-51, SI)
where
D
L
deflection lag factor, dimensionless; for long-term deflection use
a D
L
greater than 1
W
e
vertical soil load on pipe, psi (N/m
2
)
W
L
live load on pipe, psi (N/m
2
)
K
x
bedding coefficient, dimensionless, 0.1 for typical direct bury
PS pipe stiffness, psi (kPa)
M
s
composite soil constrained modulus, psi (MPa).
The lag factor converts the immediate deflection of the pipe to the
deflection of the pipe after many years. For long-term deflection predic-
tion, a value of 1 or greater is appropriate. The bedding coefficient reflects
the degree of support provided by the soil at the bottom of the pipe and
over which the bottom reaction is distributed. Assuming a typical direct
bury condition, a K
x
value of 0.1 is appropriate.
The long-term vertical soil load for pipe is given by Eq. (9-1).
y
DW W K
PS M
Le L x
S
()
,149 61 000
y
DW W K
PS M
Le L x
s
()
..0 149 0 061
⋅d
D
⋅ d
D
y
D
y
D
d
D
y
D
a
⋅
316 GRAVITY SANITARY SEWER DESIGN AND CONSTRUCTION

With the common acceptance that fiberglass pipe must be capable of
withstanding 5% long-term deflection, the maximum installed bending
strain may be expressed as:
(9-52)
9.6.4.3.5. Pipe Stiffness
The pipe stiffness can be determined by conducting parallel-plate load-
ing tests in accordance with ASTM D2412 using the following equations:
(9-53)
where
PS pipe stiffness, lb/inch
2
(N/m
2
)
E ring flexural modulus, lb/inch
2
(N/m
2
)
I moment of inertia of unit length, inch
4
/inch (mm
4
/mm) (t)
3
/12,
where t average thickness of pipe wall
r
m
mean pipe radius, inch (mm) (OD t)/2, where OD outside
diameter, inch (mm) and t average wall thickness, inches (mm).
y
t
vertical pipe deflection, inch (mm), when tested by ASTM D2412
with a vertical diameter reduction of 5%
F load per unit length, lb/ft (N/m).
9.6.4.3.6. Constrained Soil Modulus
The vertical loads on a flexible pipe cause a decrease in the vertical
diameter and an increase in the horizontal diameter. The horizontal
movement develops a passive soil resistance that helps support the pipe.
The passive soil resistance varies depending on the soil type and the
degree of compaction of the pipe backfill material, soil characteristics,
cover depth, and trench width.
The following equation is used to determine the soil modulus:
M
s
S
c
M
sb
(9-54)
where
M
s
composite constrained soil modulus, psi (kPa)
S
c
soil support combining factor from Table 9-23, dimensionless
PS
EI
ry
PS F y
mt
t
0 149 2
3
.( /)
/
or
ε
b
f
D
t
D
max ( . ) 005
⎛
⎝
⎜
⎞
⎠
⎟
STRUCTURAL REQUIREMENTS 317

318 GRAVITY SANITARY SEWER DESIGN AND CONSTRUCTION
TABLE 9-22. M
sb
based on Soil Type
a–h
Stiffness Categories 1 and 2 (SC1, SC2)
Vertical
Stress Depth for
Level,
a
s
120 pcf, SPD100, SPD95, SPD90, SPD85,
psi (kPa) ft (m) psi (kPa) psi (kPa) psi (kPa) psi (kPa)
1 (6.9) 1.2 (0.36) 2,350 (16,200) 2,000 (13,800) 1,275 (8,800) 470 (3,200)
5 (34.5) 6 (1.8) 3,450 (23,800) 2,600 (17,900) 1,500 (10,300) 520 (3,600)
10 (68.9) 12 (3.6) 4,200 (29,000) 3,000 (20,700) 1,625 (11,200) 570 (3,900)
20 (138) 24 (7.2) 5,500 (37,900) 3,450 (23,800) 1,800 (12,400) 650 (4,500)
40 (276) 48 (14.4) 7,500 (51,700) 4,250 (29,300) 2,100 (14,500) 825 (5,700)
60 (414) 72 (21.9) 9,300 (64,100) 5,000 (34,500) 2,500 (17,200) 1,000 (6,900)
Stiffness Categories 3 (SC3)
1 (6.9) 1.2 (0.36) 1,415 (9,800) 670 (4,600) 360 (2,500)
5 (34.5) 6 (1.8) 1,670 (11,500) 740 (5,100) 390 (2,700)
10 (68.9) 12 (3.6) 1,770 (12,200) 750 (5,200) 400 (2,800)
20 (138) 24 (7.2) 1,880 (13,000) 790 (5,400) 430 (3,000)
40 (276) 48 (14.4) 2,090 (14,400) 900 (6,200) 510 (3,500)
60 (414) 72 (21.9) 2,300 (15,900) 1,025 (7,100) 600 (4,100)
Stiffness Categories 4 (SC4)
1 (6.9) 1.2 (0.36) 530 (3,700) 255 (1,800) 130 (900)
5 (34.5) 6 (1.8) 625 (4,300) 320 (2,200) 175 (1,200)
10 (68.9) 12 (3.6) 690 (4,800) 355 (2,400) 200 (1,400)
20 (138) 24 (7.2) 740 (5,100) 395 (2,700) 230 (1,600)
0 (276) 48 (14.4) 815 (5,600) 460 (3,200) 285 (2,000)
60 (414) 72 (21.9) 895 (6,200) 525 (3,600) 345 (2,400)
a
Vertical stress level is the vertical effective soil stress at the springline elevation of the pipe.
It is normally computed as the design soil unit weight times the depth of fill. Buoyant unit
weight should be used below the groundwater level.
b
SC1 soils have the highest stiffness and require the least amount of compactive energy to
achieve a given density. SC5 soils, which are not recommended for use as backfill, have the
lowest stiffness and require substantial effort to achieve a given density.
c
SC1 soils have higher stiffness than SC2 soils, but data on specific soil stiffness values are
not available at the current time. Therefore, the soil stiffness of dumped SC1 soils can be
taken as equivalent to SC2 soils compacted to 90% of maximum Standard Proctor Density
(SPD90), and the soil stiffness of compacted SC1 soils can be taken as equivalent to SC2 soils
compacted to 100% of maximum Standard Proctor Density (SPD100).
d
The soil types SC1 to SC5 are defined in Table 9-25.
e
The numerical suffix to the SPD indicates the compaction level of the soil as a percentage of
maximum dry density determined in accordance with ASTM D698 or AASHTO T-99.
f
Engineers may interpolate intermediate values of M
sb
for vertical stress levels not shown in
the table.
g
For pipe installed below the water table, the modulus should be corrected for reduced ver-
tical stress due to buoyancy and by an additional factor of 1 for SC1 and SC2 soils with SPD
of 95, 0.85 for SC2 soils with SPD of 90, 0.70 for SC2 soils with SPD of 85, 0.50 for SC3 soils,
and 0.30 for SC4 soils.
h
It is recommended to embed pipe with stiffness of 9 psi (62 kPa) or less only in SC1 or SC2 soils.
Reprinted from AWWA Manual of Practice M45: Fiberglass pipe design, by permission. Copy-
right 2005 American Water Works Association.

M
sb
constrained soil modulus of the pipe zone embedment, psi
(kPa) (See Table 9-22).
To find the Soil Support Combining Factor, Table 9-23 must be used with
the following values:
M
sn
constrained soil modulus of native soil at pipe elevation, psi
(kPa) (see Table 9-24)
B
d
trench width at pipe springline, inch (mm).
9.6.4.3.7. Hydrostatic Design Basis for Stress and Strain
The maximum stress or strain resulting from the combined effects of
internal pressure and deflections should meet the following requirements.
For stress basis HDB:
(9-55)
(9-56)
b
c
b
pr
b
b
r
SE
SE
FS
≤
−
⎛
⎝
⎜
⎞
⎠
⎟
1
..
pr
b
c
b
pr
HDB
r
SE
FS
≤
−
⎛
⎝
⎜
⎞
⎠
⎟
1
ε
..
STRUCTURAL REQUIREMENTS 319
TABLE 9-23. Values for S
c
a
M
sn
/M
sb
B
d
/D 1.25 B
d
/D 1.5 B
d
/D 1.75 B
d
/D 2 B
d
/D 2.5 B
d
/D 3 B
d
/D 4 B
d
/D 5
0.005 0.02 0.05 0.08 0.12 0.23 0.43 0.72 1.00
0.01 0.03 0.07 0.11 0.15 0.27 0.47 0.74 1.00
0.02 0.05 0.10 0.15 0.20 0.32 0.52 0.77 1.00
0.05 0.10 0.15 0.20 0.27 0.38 0.58 0.80 1.00
0.1 0.15 0.20 0.27 0.35 0.46 0.65 0.84 1.00
0.2 0.25 0.30 0.38 0.47 0.58 0.75 0.88 1.00
0.4 0.45 0.50 0.56 0.64 0.75 0.85 0.93 1.00
0.6 0.65 0.70 0.75 0.81 0.87 0.94 0.98 1.00
0.8 0.84 0.87 0.90 0.93 0.96 0.98 1.00 1.00
1 1.00 1.00 1.00 1.00 1.00 1.00 1.00 1.00
1.5 1.40 1.30 1.20 1.12 1.06 1.03 1.00 1.00
2 1.70 1.50 1.40 1.30 1.20 1.10 1.05 1.00
3 2.20 1.80 1.65 1.50 1.35 1.20 1.10 1.00
5 3.00 2.20 1.90 1.70 1.50 1.30 1.15 1.00
a
In-between values of S
c
may be determined by straight-line interpolation from adjacent values.
Reprinted from AWWA Manual of Practice M45: Fiberglass pipe design, by permission. Copyright 2005
American Water Works Association.

320 GRAVITY SANITARY SEWER DESIGN AND CONSTRUCTION
TABLE 9-24. Constrained Soil Modulus of Native Soil
Native In Situ Soils
a
Cohesive
Granular q
u
b
M
sn
c
Blows/ft
d
(0.3 m) Description Tons/ft
2
kPa Description psi MPa
0–1 Very, very loose 0–0.125 0–13 Very, very soft 50 0.34
1–2 Very loose 0.125–0.25 13–25 Very soft 200 1.4
2–4 0.25–0.50 25–50 Soft 700 4.8
4–8 Loose 0.50–1.00 50–100 Medium 1,500 10.3
8–15 Slightly compact 1.0–2.0 100–200 Stiff 3,000 20.7
15–30 Compact 2.0–4.0 200–400 Very stiff 5,000 34.5
30–50 Dense 4.0–6.0 400–600 Hard 10,000 69.0
50 Very dense 6.0 600 Very hard 20,000 138.0
a
The constrained modulus M
sn
for rock is 50,000 psi (345 MPa).
b
q
u
unconstrained compressive strength, tons/ft
2
(kPa).
c
For embankment installation, M
sb
M
sn
M
s.
d
Standard penetration test per ASTM D1586.
Reprinted from AWWA Manual of Practice M45: Fiberglass pipe design, by permission. Copy-
right 2005 American Water Works Association.
For strain basis HDB:
(9-57)
(9-58)
where
pr
working stress due to internal pressure, lb/inch
2
(kPa)
HDB hydrostatic design basis, psi (kPa)
ε
b
bending strain due to maximum permitted deflection, inch/
inch (mm/mm)—See Eq. (9-49)
ε
pr
working strain due to internal pressure, inch/inch (mm/mm)
r
c
re-rounding coefficient, dimensionless
P
w
/435 (where P
w
435 psi) (English)
1 P
w
/3,000 (where P
w
3,000 kPa) (SI)
P
w
working pressure in pipe
PD
tH
w
H
2
ε
ε
b
c
b
pr
b
r
S
HDB
FS
≤
−
⎛
⎝
⎜
⎞
⎠
⎟
1
..
ε
ε
pr
b
c
b
pr
HDB
r
S
FS
≤
−
⎛
⎝
⎜
⎞
⎠
⎟
1
..

S
b
long-term ring bending strain for the pipe, inch/inch (mm/mm)
E ring flexural modulus, psi (kPa)
F.S.
pr
pressure safety factor, 1.8
b
bending stress due to the maximum permitted deflection, psi
(kPa)
F.S.
b
bending safety factor, 1.5.
9.6.4.3.8. Buckling
Due to the restraining influence of the soil, external radial pressure can
buckle pipe at a high pressure. The external loads should be equal to or
STRUCTURAL REQUIREMENTS 321
TABLE 9-25. Soil Stiffness Categories
Soil Stiffness
Category Unified Soil Classification System Soil Groups
a
AASHTO Soil Groups
b
SC1 Crushed rock: 15% sand, maximum 25%
passing the
3
⁄
8
inch sieve and maximum 5%
passing No. 200 sieve
c
SC2 Clean, coarse-grained soils: SW, SP, GW, GP, or A1, A3
any soil beginning with one of these symbols
with 12% or less passing a No. 200 sieve
d
SC3 Coarse-grained soils with fines: GM, GC, SM, A-2-4, A-2-5, A-2-6, or
SC, or any soil beginning withone of these A-4 or A-6 soils with
symbols with more than 12% fines more than 30% retained
Sandy or gravelly fine-grained soils: CL, ML on a No.200 sieve
(or CL-ML,CL/ML, ML/CL) with more than
30% retained on a No. 200 sieve
SC4 Fine-grained soils: CL, ML (or CL-ML, A-2-7, or A-4 or A-6 soils
CL/ML, ML/CL) with30% retained on a with 30% or less retained
No. 200 sieve on a No. 200 sieve
SC5 Highly plastic and organic soils: MH, CH, A5, A7
OL, OH, PT
a
ASTM D2487, Standard Classification of Soils for Engineering Purposes.
b
AASHTO M145, Classification of Soils and Soil Aggregate Mixtures.
c
SC1 soils have higher stiffness than SC2 soils, but data on specific soil stiffness values are
not available at the current time. Until such data are available, the soils stiffness of dumped
SC1 soils can be taken to be equivalent to SC2 soils compacted to 90% of maximum standard
Proctor density, and the stiffness of compacted SC1 soils can be taken to be equivalent to
SC2 soils compacted to 100% of maximum standard Proctor density. Even if dumped, SC1
materials should be worked into the haunch zone.
d
Uniform fine sands (SP) with more than 50% passing a No. 100 sieve are very sensitive to
moisture and should not be used as backfill for fiberglass pipe, unless the engineer has
given this specific consideration. If use of these materials is permitted, compaction and han-
dling procedures should follow the guidelines for SC3 materials.
Reprinted from AWWA Manual of Practice M45: Fiberglass pipe design, by permission. Copy-
right 2005 American Water Works Association.

less than the allowable buckling pressure. The allowable buckling pres-
sure is determined by the following equation:
(9-59)
where
q
a
allowable buckling pressure, lb/inch
2
(kPa)
M
s
composite constrained soil modulus, psi (kPa)
F.S. safety factor, 2.5
C
n
scalar calibration factor to account for nonlinear effects 0.55
s
factor to account for variability in stiffness of compacted soil;
suggested value is 0.9
k
modulus correction factor for Poisson’s ratio, commonly
assumed as 0.74
r mean pipe radius, inches (mm)
R
h
correction factor for depth of fill 11.4/(11 D/h) (English)
or 11.4/(11 D/1,000h) (SI); where h depth of pipe,
inches (m) and D mean diameter of the pipe, inches (mm).
(9-60)
If live loads are considered, as in gravity sewers, the buckling require-
ment is checked by the following equation:
(9-61, English)
(9-61, SI)
where
w
specific weight of water 0.0361 lb/inch
3
(9800 N/m
3
)
P
internal vacuum pressure, psi (kPa)
R
w
water buoyancy factor 1 0.33(h
w
)/h [0 h
w
h]
W
L
live load (as calculated previously)
W
c
soil load (as calculated previously)
h
w
height of water surface above the pipe top, inch (m)
h depth of soil, inch (m).
The total load for gravity sewers combines the live loads, water load
and the soil load as follows:
Total Load W
c
(R
w
) W
w
W
L
(9-62)
[()]
ww w c L a
hRWW q
10
3
≤
ww w c L a
hRWWq() ≤
ww w c v a
hRWPq() ≤
q
CEI Mk R
FS r
a
nss
h
( . )( ) ( )
(..)
..
12
033 067
322 GRAVITY SANITARY SEWER DESIGN AND CONSTRUCTION

where
(9-63, English)
(9-63, SI)
9.6.4.3.9. Axial Loads
Axial stresses in sanitary sewer pipe can occur in pipes that have hoop
expansion due to internal pressure, restrained thermal expansion, and
uneven bedding. The minimum requirements for axial strengths are spec-
ified in Sections 5.1.2.4 and 5.1.2.5 and Tables 11, 12, and 13 of ANSI/
AWWA C950.
9.6.4.3.10. Special Design Considerations
Special consideration should be made for shallow bedding, where H
2 ft (0.6 m), uneven bedding, differential settlement of unstable native
soils, restrained tension joints, unusually high surface or constructions
loads, or any extremely difficult construction conditions.
Sample Calculations
Example 9-13. Given the following parameters, verify whether the pipe
thickness will be adequate for a gravity sewer main to be installed under
a railroad.
Pipe properties:
• Nominal pipe diameter 60 inches
• Outside diameter of pipe 62.9 inches
• Outside diameter of joint 62.9 inches
• Minimum pipe stiffness 238 psi
• Minimum total wall thickness 2.16 inches
• Minimum liner thickness 0.04 inch
• Ultimate compressive strength 10,500 psi
• Hoop flexural modulus of pipe 1.40E06 psi
Installation conditions:
• Soil weight 120 lb/ft
3
• Water weight 62.4 lb/ft
3
• Soil cover depth 16 ft
• Live load (will be under railroad) 3.05 psi
Wh
www
W
h
w
ww
144
STRUCTURAL REQUIREMENTS 323

• Water table depth 16 ft
• Modulus of soil reaction (native material) 1,500 psi
Pipe geometry:
• Outside diameter 62.9 inches
• Mean diameter 60.78 inches
• Total wall thickness 2.16 inches
• Liner thickness 0.04 inch
• Structural wall thickness 2.12 inches
• Nominal interior diameter 58.2 inches
Factors and coefficients:
• Bedding coefficient 0.083
• D
f
3, obtained from Table 9-12
• Deflection lag factor 1
Step 1. Check pipe stiffness:
I (t
t
)
3
/12 (2.12)
3
/12 0.794 inch
4
/inch
r
m
(OD t)/2 (62.9 2.12)/2 30.39 inches
r
m
(5%) from ASTM D2412 r
m
1.025
PS 246.81
Step 2. Determine total load:
W
L
3.05 psi
W
W
(62.4)(16)/144 6.93 psi
R
w
1 0.33(16/16) 0.67
Total Load W
c
(R
w
) W
w
W
L
18.92 psi
Step 3. Check deflection:
y
Lc L x
s
DW W K
PS M
()
..
.% %
0 149 0 061
107 3
W
YH
c
s
144
120 16 144 13 33( )( )/ . psi
PS
E
(. ) (. )
( . )( . . )
1 4 06 0 794
0 149 1 025 30 39
3
PS
EI
r
m
0 149
3
.()
324 GRAVITY SANITARY SEWER DESIGN AND CONSTRUCTION

Step 4. Check bending strain:
Step 5. Check buckling:
W
c
(R
w
) W
w
W
L
q
a
243 psi 18.92 psi
Since all checks are correct, the design is acceptable.
9.6.5. Design of Ductile Iron Sewer Pipes
The design standard for ductile iron pipe (DIP) is based on its behavior
as a flexible conduit, capable of re-rounding under pressure. Therefore,
the pipe is designed separately to withstand external loads and internal
pressure. The current design approach, as outlined by the Ductile Iron
Pipe Research Association (DIPRA), includes the following:
• Design for internal pressures (static pressure plus surge pressure
allowance).
• Design for bending stress due to external loads (earth load plus
truck loads).
• Select the larger resulting net wall thickness.
• Add a 0.08-inch (2-mm) service allowance.
• Check deflection.
• Add a standard casting tolerance.
This procedure results in the total calculated design thickness, from
which the appropriate pressure class is chosen. It should be noted that
DIPRA has developed a computer program (dipra.exe) which will auto-
matically perform these calculations, and that can be downloaded from
the DIPRA web site (www.dipra.org).
9.6.5.1. Standard Laying Conditions
Several of the factors necessary to calculate the bending stress and
deflection are dependent on the type of laying condition and the width of
the bedding at the pipe bottom. To expedite the design calculations, the
five Standard Laying Conditions have been identified by DIPRA and
ASTM for installation of DIP. These Standard Laying Conditions are
shown in Fig. 9-30.
q
CEI Mk R
FS r
a
nssv
h
( . )( ) ( )
()
..
12
243
033 067
psi
ε
b
Df
t
D
max ( . ) . % . %.005 032 062
⎛
⎝
⎜
⎞
⎠
⎟
STRUCTURAL REQUIREMENTS 325

9.6.5.2. Stress Design
As noted previously, the stress design for DIP is based on the larger of
the values obtained from internal pressure and external ring bending
stress. By definition, the internal pressure of a gravity sanitary sewer
would be essentially 0 psi (Pa). Therefore, the designer can proceed to
evaluation of the ring bending stress.
326 GRAVITY SANITARY SEWER DESIGN AND CONSTRUCTION
FIGURE 9-30. Standard laying conditions for ductile iron pipe.
Reprinted with permission, © ASTM International, 100 Barr Harbor
Drive, West Conshohocken, PA 19428.

When a trench load of sufficient magnitude is applied, DIP behaves
similarly to other flexible conduits, deflecting to develop passive resist-
ance from the side fill soil, thereby transmitting part of the trench load to
the side fill soil. Thus, the load-carrying capacity of DIP is a function of
soil and ring stiffness. In addition, an upward reaction to the vertical
trench load exerted on the pipe develops in the trench embedment below
the pipe. Design for flexure is based on the Spangler equation for bending
stress (Spangler 1941). This equation utilizes both the bending stress coef-
ficient, K
b
, and the deflection coefficient, K
x
. Both coefficients are functions
of the width of the bedding under the pipe.
The design ring-bending stress that is recommended by DIPRA (2006) is
48,000 psi (330 MPa). This provides safety factors under trench loading of at
least 1.5 based on ring yield strength and at least 2 based on ultimate ring
stress. The following equation is used to calculate the trench load required
to develop a bending stress of 48,000 psi (330 MPa) at the pipe invert.
(9-64)
where
P
V
trench load P
e
P
t
, psi (MPa)
P
e
earth load, psi (MPa)
P
t
live load, psi (MPa)
f design maximum bending stress, 48,000 psi (330 MPa)
D outside diameter, inch (m)
t net thickness, inch (m)
K
b
bending moment coefficient, see Figure 9-30
K
x
deflection coefficient, see Figure 9-30
E modulus of elasticity, 24 10
6
psi (165 10
3
MPa)
Emodulus of soil reaction, see Figure 9-30.
Based on this equation, a net thickness can be calculated for the pipe. A
service allowance of 0.08 inches (2 mm) is then added to the net thickness.
The resulting thickness is the minimum thickness, t
1
.
9.6.5.3. Deflection Analysis
Deflection analysis of the DIP is based on the Modified Iowa For-
mula [Eq. (9-33)]. The maximum recommended ring deflection for
P
f
D
t
D
t
K
K
E
E
D
t
V
b
x
31
8
1
0 732
3
⎛
⎝
⎞
⎠
⎛
⎝
⎞
⎠
′
⎛
⎝
⎞
⎠
⎡
⎣
⎢
⎢
⎢
⎢
⎢
⎢
⎢
⎤
⎦
⎥
⎥
⎥
⎥
⎥
⎥
⎥
.
STRUCTURAL REQUIREMENTS 327

cement-mortar-lined DIP is 3% of the outside diameter. This provides a
minimum safety factor of at least 2 with regard to the failure of the cement-
mortar lining. The following equation is used to calculate the trench load
required to develop a ring deflection of 3% of the outside diameter.
(9-65)
where
t
1
minimum thickness, inch (m)
x design deflection, inch (m) (x/D 0.03).
The other variables have the same meaning as in Eq. (9-64). The t
1
required for deflection is compared to the t
1
resulting from the bending
stress design. The greater t
1
is used and is called the minimum manufac-
turing thickness.
9.6.5.4. Allowance for Casting Tolerance
Once the minimum manufacturing thickness is determined, an allow-
ance for casting tolerance is added to provide the latitude required by the
manufacturing process and to ensure that any negative deviations from
design thickness do not adversely impact the pipe. The casting tolerances
are dependent on pipe size, as shown in Table 9-26.
9.6.5.5. Design Aids
Manual use of the equations above for determining pipe thickness
requires significant calculations. If the design conditions can be limited to
P
xD
K
E
D
t
E
V
X
/
.
12
8
1
0 732
1
3
⎛
⎝
⎜
⎞
⎠
⎟
′
⎡
⎣
⎢
⎢
⎢
⎢
⎢
⎤
⎦
⎥
⎥
⎥
⎥
⎥
328 GRAVITY SANITARY SEWER DESIGN AND CONSTRUCTION
TABLE 9-26. Allowances for Casting Tolerance
Size, inches (mm) Casting Tolerance, inches (mm)
3–8 (75–200) 0.05 (1.3)
10–12 (250–300) 0.06 (1.5)
14–42 (350–1,050) 0.07 (1.8)
48 (1,200) 0.08 (2.0)
54–64 (1,350) 0.09 (2.3)
Reprinted from AWWA Standard C150/A21. 50-02: Thickness design of ductile-iron pipe, by
permission. Copyright 2002 American Water Works Association.

those included in the AWWA standards, then simplified design tables
provided by DIPRA can be utilized. The design criteria included in
ANSI/AWWA C150/A21.50 include:
• Yield strength in tension, 42,000 psi (289.59 MPa).
• Ring bending stress, 48,000 psi (330.96 MPa).
• Ring deflection, 3%.
• AASHTO H-20 truck loading at all depths, with 1.5 impact factor.
• Minimum depth of cover, 2.5 ft (0.7 m).
• Prism earth load for all pipe sizes.
• The DIPRA-defined five types of laying conditions.
In this case, the simplified design tables from DIPRA can be utilized to
calculate a maximum depth of cover for each size of pipe.
9.7. INSTALLATION
9.7.1. Recommendations for Field Procedures
The factor of safety against ultimate collapse of sewer pipe is about the
same as that used in the design of most engineered structures of mono-
lithic concrete. However, the design of sewer pipe is based on calculated
loads, bedding factors, and experimental factors, which are less well-
defined than the dead and live loads used in building design. It is there-
fore important that the loads imposed on the sewer pipe be not greater
than the design loads.
To obtain the objective of imposed loads being less than design loads,
the following procedures are recommended:
• Specifications. Construction specifications should set forth limits for
the width of trench below the top of sewer pipe. The width limits
should take into account the minimum width required to lay and join
sewer pipe, and the maximum allowable width for each class of sewer
pipe and bedding to be used. Where the depth is such that a positive-
projecting condition will be obtained, maximum width should be
specified as unlimited unless the width must be controlled for some
reason other than to meet structural requirements of the sewer pipe.
Appropriate corrective measures should be specified in the event the
maximum allowable width is exceeded. These measures may include
provision for a higher class of bedding or concrete encasement. Maxi-
mum allowable construction live loads should be specified for vari-
ous depths of cover if appropriate for the project.
• Construction Inspection. Construction should be observed by an expe-
rienced engineer or field representative who reports to a competent
field engineer.
STRUCTURAL REQUIREMENTS 329

• Testing. Sewer pipe testing should be under the supervision of a reli-
able testing laboratory, and close liaison should be maintained
between the laboratory and the field engineer.
• Field Conditions. The field engineer should be furnished with suffi-
cient design data to enable the intelligent evaluation of unforeseen
conditions. The field engineer should be instructed to confer with
the design engineer if changes in design appear advisable.
9.7.2. Effect of Trench Sheeting
Because of the various alternative methods employed in sheeting
trenches, generalizations on the proper construction procedure to follow
(to ensure that the design load is not exceeded) are risky and dangerous.
Each method of sheeting and bracing should be studied separately. The
effect of a particular system on the sewer pipe load, as well as the conse-
quences of removing the sheeting or the bracing, must be estimated.
When trench sheeting is necessary, it should be driven at least to the
bottom of the pipe bedding or foundation material, if used. In general, in
a constantly wet or dry area, sheeting and bracing should be left in place
to prevent reduction in lateral support at the sides of the pipe because of
voids formed by removal of the sheeting. Sheeting left in place should be
cut off as far below the surface as practicable, but in no case less than 3 ft
(0.9 m) below final ground elevation.
It is difficult to obtain satisfactory filling and compaction of the void left
when wood sheeting is pulled. If granular materials are used for backfill, it is
possible to fill and compact the voids left by the wood sheeting if the mate-
rial is placed in lifts and jetted as the sheeting is pulled. If cohesive materials
are used for backfill, a void will be left when the wood sheeting is pulled and
the full weight of the prism of earth contained between the sheeting will
come to bear on the sewer pipe. Therefore, wood sheeting driven alongside
the sewer pipe should generally not be pulled, but should be cut off and left
in place to an elevation of 1.5 ft (450 mm) above the top of the sewer pipe.
Steel sheeting to be removed should be pulled in increments as the
trench is backfilled, and the soil should he compacted to prevent forma-
tion of voids. The portion of wood sheeting to be removed should be han-
dled similarly.
Skeleton sheeting or bracing should be cut off and left in place to an
elevation of 1.5 ft (450 mm) above the top of the sewer pipe if removal of
the trench support might cause a collapse of the trench wall and a widen-
ing of the trench at the top of the conduit. Entire skeleton sheeting sys-
tems should be left in place if removal would cause collapse of the trench
before backfill can be placed.
Where steel soldier beams with horizontal lagging between the beam
flanges are used for sheeting trenches, efforts to reclaim the steel beams
330 GRAVITY SANITARY SEWER DESIGN AND CONSTRUCTION

before the trench is backfilled may damage pipe joints. It is recommended
that use of this type of sheeting be allowed only with stipulation that the
beams be pulled after backfilling and that the lagging be left in place.
Steel sheeting may be used and reused many times, so the relative
economy of this type of sheeting compared with timber or timber and sol-
dier beams should be explored. Because of the thinness of the sheeting, it
is often feasible to achieve reasonable compaction of backfill so that the
steel sheeting may be withdrawn with about the same factor of safety
against settlement of the surfaces adjacent to the trench as that for other
types of sheeting left in place.
9.7.3. Trench Boxes
Several backfilling techniques are possible when a trench box is used.
Granular material can be placed between the box and the trench wall
immediately after placing the box, and the box is advanced by lifting it
slightly before moving it forward. Boxes can be made with a step at the
rear which makes the trench wall accessible for compacting the embed-
ment against the walls. Also, the box can be used where the sewer pipe is
laid in a small subtrench, and the box is utilized only in the trench above
the top of the sewer pipe. Advancement of the box must be done carefully
to avoid pulling pipe joints apart.
9.7.4. OSHA Requirements
In addition to the structural design requirements for sewer installation,
the federal government and many state governments have passed specific
safety requirements for excavation and trenching. A review of state
requirements is beyond the scope of this Manual. In addition, although the
following information is current as of the date of the writing of this Man-
ual, engineers and contractors should review the appropriate state and
federal regulations to ensure that there have not been intervening changes.
The standard covering excavation safety is Title 29 Code of Federal
Regulations, Part 1926.650-652 (Subpart P), OSHA’s Rules and Regula-
tions for Construction Employment (Standard 29CFR1926.650). The stan-
dard covers all excavations made in the Earth’s surface, including trenches,
and the requirements for protective systems to be used.
OSHA defines an excavation as any man-made cut, cavity, trench, or
depression in the Earth’s surface as formed by earth removal. This can
include anything from excavations for home foundations to a new high-
way. A trench refers to a narrow excavation made below the surface of the
ground in which the depth is greater than the width, and the width does
not exceed 15 ft (4.5 m). Trenching is common in utility work, where
underground piping or cables are being installed or repaired.
STRUCTURAL REQUIREMENTS 331

If an excavation is more than 5 ft (1.5 m) in depth, there must be a pro-
tective system in place while workers are in the excavation. Excavations
more than 4 ft (1.2 m) in depth must have a way to get in and out (usually
a ladder) for every 25 ft (7.5 m) of horizontal travel.
OSHA standards require that no matter how deep the excavation is, a
“competent person” must inspect conditions at the site on a daily basis
and as frequently as necessary during the progress of work to make sure
that the hazards associated with excavations are eliminated before
workers are allowed to enter. A competent person has the following
qualifications:
• Has a thorough knowledge of Title 29 Code of Federal Regulations,
Part 1926.650-652 (Subpart P), OSHA’s Rules and Regulations for
Construction Employment.
• Understands how to classify soil types.
• Knows the different types and proper use of excavation safety
equipment (e.g., protective systems).
• Has the ability to recognize unsafe conditions, the authority to stop
the work when unsafe conditions exist, the knowledge of how to
correct the unsafe conditions, and does it!
If someone else must be called in order to stop the work, or the desig-
nated competent person does not stop unsafe acts and conditions, the per-
son is not acting “competently” within the meaning of the standard.
It is the responsibility of the competent person to conduct daily inspec-
tions prior to the start of any work and as needed throughout the shift. Part
of this inspection process includes determining the soil classification. OSHA
has included Standard 29CFR1926, Subpart P in Appendix A of its excava-
tion rule standard methods to make it easier for a competent person to clas-
sify soils. The ability to determine soil type correctly is critical because soil
type is one of the determining factors in specifying protective systems.
When a protective system is required, the three most commonly used
kinds of protective systems are shoring, shielding, and sloping. Each of
these protective systems is acceptable to OSHA; it is up to the competent
person to determine which method will be most effective for the job. The
competent person must inspect these systems regularly to ensure they are
functioning properly.
9.7.5. Pipe Bedding and Backfilling
9.7.5.1. General Concepts
The ability of a sewer pipe to safely resist the calculated soil load
depends not only on its inherent strength but also on the distribution of
332 GRAVITY SANITARY SEWER DESIGN AND CONSTRUCTION

the bedding reaction and on the lateral pressure acting against the sides of
the sewer pipe.
Construction of the sewer pipe–soil system focuses attention on the
pipe zone, which is made up of five specific areas: foundation, bedding,
haunching, initial backfill, and final backfill (see Fig. 9-31 for definitions
and limits of these five areas). However, all of these areas are not neces-
sarily referred to in all pipe design standards. The discussion in this section
is in general terms and is intended to describe the effect of the various
areas on the pipe–soil system. More detailed requirements are given in
the previous sections on pipe design and in Chapter 10.
For all sewer pipe materials, the calculated vertical load is assumed
to be uniformly distributed over the width of the pipe. This assumption
was originated by Marston’s work and is part of the bedding factors
developed by Spangler and presented in this chapter. Many years
of field experience indicate this assumption results in conservative
designs.
The load capacity of sewer pipes of all materials is influenced by the
sewer pipe–soil system, although the importance of the specific areas may
STRUCTURAL REQUIREMENTS 333
FIGURE 9-31. Trench cross section illustrating terminology.
Reprinted with permission, copyright ASTM International, 100 Barr Har-
bor Drive, West Conshohocken, PA 19428.

vary with different pipe materials. The information in this chapter
includes descriptions of pipe beddings for the following:
• Rigid sewer pipe in trench.
• Rigid sewer pipe in embankment.
• Flexible nonmetallic pipe.
• Ductile iron pipe.
Detailed information on pipe bedding classes is contained in the vari-
ous ANSI and ASTM specifications and industry literature for each mate-
rial. The engineer should consult the applicable specifications or literature
for information to be used in design.
9.7.5.2. Foundation
The foundation provides the base for the sewer pipe–soil system. In
trench conditions, the total weight of the pipe and soil backfill will nor-
mally be no more than the weight of the excavated soil. In this case, foun-
dation pressures are not increased from the initial condition, and the
designer should be concerned primarily with the presence of unsuitable
soils, such as peat or other highly organic or compressible soils, and with
maintaining a stable trench bottom.
If the full benefit of the bedding is to be achieved, the bottom of the
trench or embankment must be stable. Methods for achieving this condi-
tion are discussed in Chapter 10.
To ensure that the sewer pipe is properly bedded or embedded, it is
suggested that compaction tests be made at selected or critical locations,
or that the method of material placement be observed and correlated to
known results. Where compaction measurement or control is desired or
required, the recommended references are:
• Standard Method of Test for Relative Density of Cohesionless Soils,
ASTM D2049
• Standard Method of Test for Moisture Density Relations of Soils
Using 5.5-lb (2.5-kg) Hammer and 12-in (204.8-mm) Drop, ASTM
D698
• Standard Method of Test for Density of Soil in Place by the Rubber-
Balloon Method, ASTM D2167
• Standard Method of Test for Density of Soil in Place by the Sand-
Cone Method, ASTM D1556
• Standard Method of Test of Density of Soil and Soil-Aggregate in
Place by Nuclear Methods (Shallow Depth), ASTM D2922
It is recommended that the in-place density of Class I and Class II
embedment materials be measured by ASTM D2049 by percentage of
334 GRAVITY SANITARY SEWER DESIGN AND CONSTRUCTION

relative density, and Class III and Class IV measured by ASTM D2167,
Dl556, or D2922, by percentage of Standard Proctor Density according to
ASTM D698, or AASHTO T-99.
9.7.5.3. Bedding
The contact between a pipe and the foundation upon which it rests is
the sewer pipe bedding. The bedding has an important influence on the
distribution of the reaction against the bottom of the sewer pipe, and
therefore influences the supporting strength of the pipe as installed.
Some research (Griffith and Keeney 1967; Sikora 1980) has indicated
that well-graded crushed stone is a more suitable material for sewer pipe
bedding than well-graded gravel. Both materials, however, are better
suited than uniformly graded pea gravel.
Even though larger particle sizes give greater stability, the maximum
size and shape of granular embedment should also be related to the pipe
material and the recommendations of the manufacturer. For example,
sharp, angular embankment material larger than 0.5 to 0.75 inch (12 to
20 mm) should not be used against corrosion protection coatings. For
small sewer pipes, the maximum size should be limited to about 10% of
the pipe diameter.
Soil classifications under the United Soil Classification System, includ-
ing manufactured materials, are grouped into five broad categories
according to their ability to develop an interacting sewer pipe–soil system
(Table 9-16). These soil classes are described in ASTM D2321. In general,
crushed stone or gravel meeting the requirements of ASTM Designation
C33, Gradation 67 [0.75 inch to No. 4 (19 to 4.8 mm)] will provide the most
satisfactory sewer pipe bedding.
In some locations the natural soils at the level of the bottom of the
sewer pipe may be sands of suitable grain size and density to serve as
both foundation and bedding for the pipe. In such situations, as deter-
mined by the design engineer, it may not be necessary to remove and
replace these soils with the special bedding materials described above. If
the natural soil is left in place, it should be properly shaped for the class of
bedding required.
9.7.5.4. Haunching
The soil placed at the sides of a pipe from the bedding up to the spring-
line is the haunching. The care with which this material is placed has a
significant influence on the performance of the sewer pipe, particularly in
the space just above the bedding. Poorly compacted material in this space
will result in a concentration of reaction at the bottom of the pipe.
For flexible pipe, compaction of the haunching material is essential.
For rigid pipe, compaction can ensure better distribution of the forces on
STRUCTURAL REQUIREMENTS 335

the pipe. Material used for sewer pipe haunching should be shovel-sliced
or otherwise placed to provide uniform support for the pipe barrel and
to completely fill all voids under the pipe. Because of space limitations,
haunching material is often compacted manually. Results should be
checked to verify that the class of bedding or installation criteria are
achieved.
Material used in haunching may be crushed stone or sand, or a well-
graded granular material of intermediate size. If crushed stone is used, it
should be subject to the same size limitations and cautions regarding use
against corrosion protection coatings. Sand should not be used if the pipe
zone area is subject to a fluctuating groundwater table or where there is a
possibility of the sand migrating into the pipe bedding or trench walls.
9.7.5.5. Initial Backfill
Initial backfill is the material that covers the sewer pipe and extends
from the haunching to some specific point [6 to 12 inches (15 to 30 cm)]
above the top of the pipe, depending on the class of bedding. Its func-
tion is to anchor the sewer pipe, protect the pipe from damage by subse-
quent backfill, and ensure the uniform distribution of load over the top
of the pipe.
The initial backfill is usually not mechanically tamped or compacted
since such work may damage the sewer pipe, particularly if done over
the crown of the pipe. Therefore, it should be a material that will develop
a uniform and relatively high density with little compactive effort. Initial
backfill should consist of suitable granular material but not necessarily
as select a material as that used for bedding and haunching. Clayey
materials requiring mechanical compaction should not be used for initial
backfill.
The fact that little compaction effort is used on the initial backfill
should not lead to carelessness in choice or placement of material. Partic-
ularly for large sewer pipes, care should be taken in placing both the ini-
tial backfill and final backfill over the crown to avoid damage to the
sewer pipe.
9.7.5.6. Final Backfill
The choice of material and placement methods for final backfill are
related to the site of the sewer line. Generally, they are not related to the
design of the sewer pipe. Under special embankment conditions or
induced trench conditions, final backfill may play an important part in
the sewer pipe design. However, for most trench installations, final back-
fill does not affect the pipe design.
The final backfill of trenches in traffic areas, such as under improved
existing surfaces, is usually composed of material that is easily densified
336 GRAVITY SANITARY SEWER DESIGN AND CONSTRUCTION

to minimize future settlement. In undeveloped areas, the final backfill
often will consist of the excavated material placed with little compaction
and left mounded over the trench to allow for future settlement. Studies
have indicated that with some soils, this settlement may continue for
more than 10 years.
Trench backfilling should be done in such a way as to prevent drop-
ping material directly on top of a sewer pipe through any great vertical
distance. When placing material with a bucket, the bucket should be low-
ered so that the shock of falling earth will not cause damage.
An economical indicator of proper bedding and backfill execution on
flexible sewer pipes may be by testing the inside pipe deflection by a
go/no-go mandrel. Mandrel dimensions can be determined by applying
the initial deflection to the base inside diameter as determined from the
appropriate ASTM pipe standard. The initial deflection does not include
the deflection lag factor, as is applied to ultimate long-term design
deflection.
REFERENCES
American Association of State Highway and Transportation Officials (AASHTO).
(1997). “Standard specifications for highway bridges,” twelfth ed., AASHTO,
Washington, D.C.
American Concrete Pipe Association (ACPA). (1960). “Jacking reinforced concrete
pipe lines,” ACPA, Arlington, Va.
ACPA. (1993). “Standard Installations and Bedding Factors for the Indirect Design
Method, Design Data 40,” ACPA, Irving, Tex. Available online at www
.concrete-pipe.org/pdfs1/DD_40.pdf, accessed March 18, 2007.
ACPA. (2000). “Concrete pipe design manual,” ACPA, Irving, Tex.
American Railway Engineering and Maintenance of Way Association (AREMA).
(1981–1982). “Manual for railway engineering,” AREMA, Washington, D.C.,
1-4-26 and 8-10-10.
American Society of Civil Engineers (ASCE), Direct Design of Buried Concrete
Pipe Standards Committee. (2000). “Standard practice for direct design of
buried precast concrete pipe using standard installations (SIDD),” ASCE Stan-
dard No. 15-98, ASCE, Reston, Va.
Ductile Iron Pipe Research Association (DIPRA), (2006). “Design of ductile iron
pipe.” DIPRA, Birmingham, AL
American Water Works Association (AWWA). (2005). “Manual M45, Fiberglass
pipe design manual,” second ed., AWWA, Denver, Colo.
Griffith, J. S., and Keeney, C. (1967). “Load bearing characteristics of bedding
materials for sewer pipe.” J. Water Poll. Control Fed., 39, 561.
Howard, A. K. (1977). “Modulus of soil reaction (E) values for buried flexible
pipe.” J. Geotech. Engrg. Div., ASCE, Vol. 103, No. GT, Proc. Paper 12700, ASCE.
Reston, Va.
“Jacked-in-place pipe drainage.” (1960). Contractors and Engr. Monthly, 45.
STRUCTURAL REQUIREMENTS 337

Jumikis, A. R. (1969). “Stress distribution tables for soil under concentrated
loads.” Engineering Res. Pub. No. 48, Rutgers University, New Brunswick,
N.J., 233.
Jumikis, A. R. (1971). “Vertical stress tables for uniformly distributed loads on soil.”
Engineering Res. Pub. No. 52, Rutgers University, New Brunswick, N.J., 495.
Marston, A. (1930). “The theory of external loads on closed conduits in the light of
the latest experiments,” Bull. No. 96, Iowa Engineering Experiment Station,
Ames, Iowa.
Marston, A., and Anderson, A. O. (1913). “The theory of loads on pipes in ditches
and tests of cement and clay drain tile and sewer pipe,” Bull. No. 31, Iowa Engi-
neering Experiment Station, Ames, Iowa.
Portland Cement Association (PCA). (1951). “Vertical pressure on culverts under
wheel loads on concrete pavement slabs,” Pub. No. ST-65, PCA, Skokie, Ill.
Proctor, R. V., and White, T. L. (1968). “Rock tunneling with steel supports,” Com-
mercial Shearing and Stamping Co., Youngstown, Ohio.
Schlick, W. J. (1932). “Loads on pipe in wide ditches,” Bull. No. 108, Iowa Engi-
neering Experiment Station, Ames, Iowa.
Schrock, B. J. (1978). “Installation of fiberglass pipe.” J. Transp. Div., ASCE, Vol. 104,
No. TE6, Proc. Paper 14175, ASCE, Reston, Va.
Sikora, E. J. (1980). “Load factors and non-destructive testing of clay pipe.”
J. Water Poll. Control Fed., 53, 2964.
“Soil resistance to moving pipes and shafts.” (1948). Proc., 2nd Intl. Conf., Soil
Mech. and Found. Eng., 7, 149.
Spangler, M. G. (1956). “Stresses in pressure pipelines and protective casing
pipes.” J. Structural Div., ASCE, Vol. 82, No. ST5, Proc. Paper 1054, ASCE,
Reston, Va.
Spangler, M. G. (1941). “The structural design of flexible pipe culverts,” Bull. No.
153, Iowa Engineering Experiment Station, Ames, Iowa.
Spangler, M. G., and Hennessy, R. L. (1946). “A method of computing live loads
transmitted to underground conduits.” Proc., 26th Ann. Mtg., Highway Research
Board, Transportation Research Board, Washington, D.C., 179.
Taylor, R. K. (1971). “Final report on induced trench method of culvert installa-
tion,” Project 1HR-77, State of Illinois, Dept. of Public Works and Buildings,
Division of Highways, Springfield, Ill.
U.S. Army Corps of Engineers (USACE). (Undated). “Report of test tunnel,” Part
1, Vol. 1 and 2, Garrison Dam and Reservoir, USACE Publication Depot,
Hyattsville, Md.
Van Iterson, F., K. Th. (1948). “Earth pressure in mining.” Proc., 2nd Intl. Conf. Soil
Mech. and Found. Eng., 3, 314.
BIBLIOGRAPHY
Harell, R. F., and Keeney, C. (1977). “Loads on buried conduit—A ten-year
study.” J. Water Poll. Control Fed., 48, 1988.
Moser, A. P., Watkins, R. K., and Shupe, O. K. (1977). “Design and performance of
PVC pipes subjected to external soil pressure,” Buried Structure Laboratory,
Utah State University, Logan, Utah.
338 GRAVITY SANITARY SEWER DESIGN AND CONSTRUCTION

Seaman, D. J. (1979). “Trench backfill compaction control bumpy streets.” Water
and Sewage Works, 53, 67.
Watkins, R. K., and Spangler, M. G. (1958). “Some characteristics of the modulus
of passive resistance of soil: A study in similitude.” Proc., Highway Research
Board, Vol. 37, 576–583, Transportation Research Board, Washington, D.C.
Wenzel, T. H., and Parmelee, R. A. (1977). “Computer-aided structural analysis
and design of concrete pipe, concrete pipe and the soil-structural system,”
ASTM STP 630, ASTM International, West Conshohocken, Penn., 105–118.
STRUCTURAL REQUIREMENTS 339
This page intentionally left blank

10.1. INTRODUCTION
The purpose of the contract documents is to portray clearly, by words
and drawings, the nature and extent of the work to be performed, the con-
ditions known or anticipated under which the work is to be executed, and
the basis for payment. Most sewer construction projects are accomplished
by contracts entered into between an owner and a construction contrac-
tor. The contract documents, consisting of the contract forms, project
forms, conditions of the contract, specifications, drawings, addenda, and
change orders, if any, constitute the construction contract. In addition,
other exhibits may be included in the construction contract, such as the
bidding requirements and bid forms.
The contract drawings and the specifications together define the work
to be done by the contractor under the terms of the construction agree-
ment. These documents are complementary. What is called for by one is
to be executed as if called for by both.
The contract documents establish the legal relationship between the
owner and the contractor, as well as the duties and responsibilities of the
engineer. It follows that the engineer’s potential liability is influenced by
the contract documents, although the engineer is not a party to the con-
struction contract.
Experience in the courts over many years has revealed a number of
sensitive areas of potential liability which may not be covered in the doc-
uments developed internally by the owner and/or engineer. Among
these are:
• Means and methods of construction.
• Right to stop the work.
CHAPTER 10
CONSTRUCTION CONTRACT DOCUMENTS
341

• Safety.
• Insurance.
• Supervision.
• Indemnification.
In general terms, the contractor is responsible for means and methods
of construction, and safety and supervision of workmen. Only the owner
has the right to stop the work, and its insurance adviser makes final deci-
sions on insurance provisions. Subject to limitations of state law, the engi-
neer should be included with the owner as a party indemnified.
These provisions and many others are covered in an adequate manner
in the standard documents of the Engineers’ Joint Contract Documents
Committee (EJCDC 2002a through 2002e). These standard documents are
recommended as the basis for developing the contract documents. They
are further discussed in Section 10.3 of this chapter. Of course, good legal
advice is prudent in all contractual matters.
Prior to bidding, the project usually requires approval by the regula-
tory agencies. When approved, a permit to construct the project may be
issued. After the project has been approved and the contract documents
are in final form, bids are solicited.
For ease in bidding and administration, frequently the work is divided
into various items, with either unit or lump sum prices received for each
item of work. The contract documents must clearly describe and limit
these items to obviate all possible confusion in the mind of the bidder
with regard to methods of measurement and payment. The subdivision of
the work is often based on local customs, the customs and conventions of
the engineer, or the specific requirement of the owner.
Unit price bids have been used most generally where quantities of
work are likely to be variable and adjustment is found necessary during
construction. Linear feet (meters) of sewer, numbers of manholes, and
cubic yards (cubic meters) of rock excavation or concrete cradle are exam-
ples of such unit price items.
Lump sum bids have been applied most generally to special structures
that are completely defined and not subject to alteration or quantity
changes during construction. Lump sum bids may also be taken for an
entire sewer construction contract where the contract documents define
the work with sufficient completeness to permit the bidder to make an
accurate determination of the quantities of work. Such contracts may con-
tain unit adjustment prices for items of work, such as rock excavation,
piles, additional excavation, selected fill material, and sheeting require-
ments which cannot be determined precisely beforehand. An appropriate
quantity of the unit price work may be included for comparison of bids.
Both unit costs and unit adjustment prices, as applicable, are typically
reflected in the Schedule of Values. The purpose of the Schedule of Values
342 GRAVITY SANITARY SEWER DESIGN AND CONSTRUCTION

is to provide a basis for monthly progress payments. The administration
of the project, provided extensive changes are not made during construc-
tion, is simplified in the lump sum type of contract.
A final caveat: Administration of the contract is controlled by the con-
tract documents that must include applicable administrative contract pro-
visions required by federal, state, and local governments. The more the
contract documents put the engineer in control of the contractor’s activi-
ties, rather than of the results of the contractor’s work, the greater the
duties and legal obligation imposed on the engineer.
10.2. CONTRACT DRAWINGS
10.2.1. Purpose
The purpose of the contract drawings is to convey graphically the work
to be done, first to the owner, then to project reviewers, to the bidders,
and later to the construction observers/inspectors/engineer and the con-
tractor. All information that can best be conveyed graphically, including
configurations, dimensions, and notes, should be shown on the contract
drawings. Lengthy word descriptions are best included only in the speci-
fications and need not be repeated on the contract drawings.
As a general rule, contract drawings should be prepared carefully in a
neat, legible fashion. Hastily produced, sloppy drawings can lead to mis-
takes during construction which might be blamed on the condition of the
drawings. The drawings are an extension of the contract and should be
carefully considered. The following summarizes key points in obtaining
design information and preparing the contract drawings.
10.2.2. Field Data
A survey and investigation of the route of the sewer are required to
obtain information as to the existing topography, underground utilities,
and property boundaries to be shown on the contract drawings. The route
may be mapped from data obtained by conventional ground surveys
and/or by aerial photogrammetry. Field verification of dated photo-
graphs should be performed in order to properly represent the proposed
construction area. Survey work is discussed in some detail in Chapter 2.
When the location of the sewer has been well-defined by preliminary
studies, it may be possible to run the ground survey baseline directly on
the centerline of the proposed alignment. This procedure will facilitate
office plotting of field data and will later simplify stakeout of the sewer
for construction. If the actual alignment is not established by field sur-
veys, baselines or reference marks must be established in the field.
CONSTRUCTION CONTRACT DOCUMENTS 343

10.2.3. Preparation
Contract drawings generally are prepared using graphical computer-
aided design software to facilitate design updates and reduce drafting
time. There are typically several revisions of the drawings as the project
moves from the design phase through construction. The following repre-
sent typical revisions experienced during a sewer design project from
concept through construction:
• 60% Detail Drawings. Provided to communicate general concept of
sewer layout and obtain confirmation prior to more detailed design.
• 90% Detail Drawings. Detailed design produced for comment by
all reviewers prior to submitting to contractors for a bid price on
construction.
• Issue for Bid. Provided to contractors interested in performing the
proposed construction.
• Issue for Construction. Final adjusted drawings before construction
begins.
• Record Drawings. Final drawings of actual construction layout.
To track updates, a log of revisions should be maintained and is typi-
cally shown in the title block tagged with a revision number.
Typically, through the 60% design phase the sewer layout is provided
on plan sheets only. As the proposed layout is established, profile details
are drawn to coordinate with the plan view. The plan view is usually
drawn on the top half of the sheet and the profile is plotted directly
beneath it, on the bottom half at the same horizontal scale, facilitating
coordination of the two views.
The plan view should communicate detailed information on the pro-
posed sewer pipe location and relevant site conditions that would affect
the construction. Typical features include the following:
• Site topography.
• Property information and location of acquired rights-of-way or
easements.
• Existing aboveground and underground utilities.
• Existing pavement and edge of pavement locations.
• Contract limit lines.
• Additional site-specific details which may affect construction work.
When the plan view utilizes background aerial photographs, the
topography may be plotted directly on the aerial photographs. The site
topography and record data obtained from utility companies as to under-
ground utilities are also plotted on the plan. The plan showing existing
344 GRAVITY SANITARY SEWER DESIGN AND CONSTRUCTION

conditions is completed by plotting property and easement boundaries
from tax map information, deed descriptions, property maps of individ-
ual parcels, and physical evidence obtained by field survey. In many
cases, Geographic Information System (GIS) data on property informa-
tion can be downloaded directly from the county tax appraiser’s office. In
this case, boundary information can be imported directly onto the sewer
plan. When applicable, proposed temporary and permanent easement
boundaries are determined and drawn on the sewer drawings. Addi-
tional relevant information may include basement elevations and inverts
of existing utilities or other structures that may affect the work and
should also be shown. Contract limit lines are added to complete the
preparation of the drawings.
A profile of the ground surface along the proposed sewer alignment is
drawn and proposed sewer invert elevations are determined and plotted
on the profile.
The scale of the drawings should be large enough to show all of the
necessary surface and subsurface information without excessive crowd-
ing. A horizontal scale of 40 feet to the inch to 100 feet to the inch (1400 to
11000, or 5 to 10 meters to the centimeter) is suitable for many drawings.
However, in urban areas or smaller area details, 20 feet to the inch (1250,
or 2.5 meters to the centimeter) should be considered. In such areas, large-
scale drawings of street intersections are quite useful. Generally, a com-
mon vertical scale for the profile is 10 feet to the inch (1100, or meter to
the centimeter) or 2 to 5 feet to the inch (120 to 150, or 0.2 to 0.5 meter to
the centimeter) based on the height variation of the terrain. Larger scales
are used for sections and details.
Contract drawings are sometimes reduced to approximately one-half
scale and issued to bidders in this size for convenience. This practice
requires careful preparation of the full-size drawings to produce clear and
readable reductions. Reduced-size drawings should contain a note stating
the magnitude of size reduction (if it is an exact reduction, such as half-
size) and should always have a graphical scale.
Drawings are typically prepared using the U.S. Convention units. Sta-
tions will typically be represented in 100-foot increments followed by
subincrements of one foot. Benchmark elevations and design details,
including proposed sewer inverts, are typically presented in feet with two
decimal places of accuracy. Nominal sewer sizes should always be shown
in inches.
When plan and profiles are drawn using metric dimensions, stations
each will be 100-meter; horizontal dimensions should only be shown to
0.01 meter. Benchmark elevations will be given to 1 millimeter (i.e., three
places of decimals). However, it will generally be appropriate to show
sewer inverts, etc., to only two decimal places. Nominal sewer sizes
should always be shown in millimeters.
CONSTRUCTION CONTRACT DOCUMENTS 345

Lettering on contract drawings falls into three general categories:
• Labeling and dimensioning
• Notes
• Titles
The text font should be one that is easily read (such as the standard
Simplex font) with the recommended height of the text sized for the final
plotted height on the drawing document. Labeling and dimensioning of
existing conditions should have a text height of 0.06 inches. If the draw-
ings are later to be reduced in size, a minimum letter size of 0.08 inches
should be considered. Proposed facilities are labeled and dimensioned
with the same size or larger lettering, preferably 0.08 to 0.10 inches, and
should stand out from the lettering for existing facilities either by size or
by line weight. Additional notes should be lettered in the same size used
for labels of proposed facilities. Titles should be larger in size and be con-
sistent throughout the drawing set, preferably 0.12 to 0.14 inches. Finally,
assuming computer-aided design software is used, the drawing file text
should be placed in the proper corresponding layers according to their
function within the drawing, thus alleviating confusion during subse-
quent revisions of the drawing file.
Sections and details of the proposed sewer and appurtenances are typ-
ically inserted following the plan and profile sheets. Typically, each detail
has a detail number and reference page associated with it. Reference
numbers are used throughout the plan and profile sheets to refer to a spe-
cific detail number and page.
10.2.4. Contents
10.2.4.1. Arrangement
The most logical arrangement for a set of contract drawings develops
the project from general views to more specific views, and finally to more
minute details. The subsections below are arranged to follow this gener-
ally accepted order of drawing presentation.
10.2.4.2. Title Sheet
The title sheet should identify the project by presenting the following
information:
• Project name
• Contract number
• Federal or state agency project number (if applicable)
• Owner’s name
346 GRAVITY SANITARY SEWER DESIGN AND CONSTRUCTION

• Owner’s officials, key people, or dignitaries
• Engineer’s name
• Engineer’s project number
• Engineer’s address
• Engineer’s engineering business number
• Drawing set number (for distribution records)
• Professional engineer’s seal and signature
10.2.4.3. Title Blocks
Each sheet except the title sheet should have a title block containing the
following:
• Sheet title
• Project name
• Federal or state agency project number (if applicable)
• Owner’s name
• Engineer’s name
• Engineer’s seal and signature
• Sheet number
• Engineer’s project number
• Scale
• Date
• Designer, drafter, and checker identification
• Revisions identification block
• Sign-off by owner’s chief engineer or district superintendent (as
applicable)
10.2.4.4. Index/Legend
Contract drawings should contain an index that lists all of the draw-
ings in the set by title and drawing number in order of presentation. It
also is useful to provide a general plan map or key map sheet to identify
the sheets that show the details for each length of proposed sewer pro-
posed. These indices should be located on the drawing following the title
sheet. A legend showing a set of symbols for elements of topographic
abbreviations and the various items of the sewer works indicated in the
sewer drawings should be included on the index sheet. An example of a
legend for sewer drawings is shown in Figure 10-1.
10.2.4.5. Location Map
There should be a general location map showing the location of all
work in the contract in relation to the community, either on the title sheet
or on the index/legend sheet. This location map also may be used as an
index map as outlined in the preceding paragraph.
CONSTRUCTION CONTRACT DOCUMENTS 347

10.2.4.6. General Notes
Notes that pertain to more than one drawing should be presented on
the index/legend sheet. An example is a note warning that the location
and sizes of existing underground utilities shown on the contract draw-
ings are only approximate and that it is the responsibility of the contractor
to confirm or locate all underground utilities in the area of his work.
10.2.4.7. Subsoil Information
Whether or not the locations of soil borings made during the design
phase of a project and the boring logs should be included in the contract
documents is a decision that should be made only after proper legal advice
and consideration. In any event, whatever subsurface information has
348 GRAVITY SANITARY SEWER DESIGN AND CONSTRUCTION
FIGURE 10-1. Typical legend for sewer drawings.

been obtained should be made available to bidders. Drawings and specifi-
cations should indicate where special construction is required because of
known unfavorable subsoil conditions. Neither the owner nor the engineer
should guarantee subsoil conditions as a known element of the contract
agreement. If soil boring information is provided, location of the soil bor-
ings should be shown on the plan sheet.
10.2.4.8. Survey Control and Data
Survey control information may be shown on the sewer plan/profile
sheets or on a general plan on a separate sheet. Baseline bearings and dis-
tances should be included with reference ties to permanent physical fea-
tures. Vertical control points, or benchmarks, should be indicated, and the
datum plane used for determining these elevations must be defined. A
note indicating the dates of the ground survey and aerial photography
should be included.
10.2.4.9. Sewer Drawings
A continuous strip map, drawn directly above the profile, to indicate
the plan locations of all work in relation to surface topography and exist-
ing facilities is an integral part of each sewer plan and profile drawing.
The width of the strip map should be such that only topography which
directly affects construction or access to the work is indicated.
Drawings for sewers to be constructed within easements on private
property should show survey baseline and sewer alignment data. Widths
of proposed temporary and permanent easements should be dimensioned.
Sewer drawings should generally be oriented so that the flow in the
sewer is from right to left on the sheet. Each sewer plan should include a
North arrow consistent with this arrangement. Stationing should typi-
cally be upgrade from left to right, generally along the sewer centerline.
Survey baseline stationing also may be provided on the drawings but it
should not be substituted for stationing along the centerline of the sewer.
Stationing indicated on construction drawings for location of man-
holes and wye-branches or house connections is to be considered
approximate only and should be so noted. Record drawings after con-
struction must, however, give accurate locations of all features of a com-
pleted sewer system.
Locations of junction structures must be held firm as given on con-
struction drawings. Match lines should be used and should be easily iden-
tifiable. Special construction requirements, such as sheeting to be left in
place, should be shown on the drawings.
An example of a plan and profile for a sewer to be constructed is pro-
vided in Figure 10-2.
CONSTRUCTION CONTRACT DOCUMENTS 349

350
FIGURE 10-2. Typical plan and profile for sewer drawings.

10.2.4.10. Sewer Profile
Contract drawings should include a continuous profile of all sewer
runs indicating centerline ground surface and sewer elevations and
grades. Stationing shown on the plan should be repeated on the profile.
The profile is also a convenient place to show the size, slope, and type of
pipe; the limits of each size, pipe strength, or type; the locations of special
structures and appurtenances; and crossing utilities and drainage pipes.
Where interference with other structures is known to exist, explanatory
cross sections and notes should be included. Such cross sections, often
enlarged in scale, should be identified as to specific location and, if practi-
cable, should be placed on the plan/profile drawing near where the section
is cut. Examples of scenarios where cross sections are suitable include major
roadway, waterway, railroad, and/or utility crossings. By best judgment, if
the additional detail causes the plan/profile sheet to be cluttered, the detail
may be placed on attached sheets with an appropriate reference. If similar
utility crossings occur at multiple locations, a typical detail drawing depict-
ing the separation distance may also be included as a detail attachment.
10.2.4.11. Sewer Sections
When sewers consist of pipes of commonly known or specified dimen-
sions, materials, or shapes, no sewer sections need to be shown. For cast-
in-place concrete sections, complete dimensions with all reinforcement
steel shown should be included in the drawings.
10.2.4.12. Sewer Details
In unique cases, sewer details may be provided on the specific plan/
profile sheet showing the respective location of the detail. However, sep-
arate sheets of sewer details sheets that follow the plan/profile sheets are
most common. The details may be stand-alone, referring to common
structures detailed in multiple locations, or referenced details from the
plan/profile sheets.
The following details, when applicable, should be included:
• Trenching and Backfilling. Payment limits including those for rock
excavation and types of backfill materials.
• Pipe Bedding and Cushion. Dimensions, material types, and payment
limits.
• House Lateral Connections. Type and arrangement of fittings and min-
imum pipe grade.
• Special Connections. Type and configuration of fittings and dimensions.
• Manholes. Foundation, base, barrel, top slab, frame and cover, and
invert details.
CONSTRUCTION CONTRACT DOCUMENTS 351

• Sewer/Water Main Crossings. Separation requirements.
• Waterways, Highway, or Railroad Crossings. Casing, inverted siphon,
encasement, or other related details.
Many of these details find repeated use in sewer projects. Developing
standard details of these items, which may be reproduced for repeated
use in multiple sewer contracts, is helpful.
10.2.4.13. Special Details
Details that do not pertain directly to the sewer piping and are not cov-
ered by standard details should be provided on miscellaneous detail
sheets. The following would be included:
• Special Structures. Full details so that the finished work is struc-
turally sound and hydraulically correct.
• Special Castings. Sufficient details for the manufacturers to prepare
shop drawings. Standard casting items, such as manhole frames,
covers, and manhole steps, will be identified by reference to a man-
ufacturer’s catalog number in the specifications.
• Restoration Items. Complete details for pavement, sidewalk, and curb
repairs.
10.2.5. Record Drawings
During construction of the sewer project, the contractor or the engineer
should measure and record the locations of all wyes, stubs for future con-
nections, and other buried facilities which may have to be located in the
future. All construction changes from the original drawings, rock profiles,
and other special classes of excavated material also should be recorded by
the contractor or the engineer.
Contract drawings should be revised to indicate this field information
after the project is completed and a notation such as “Revised According to
Field Construction Records” or “Record Drawing” should be made on
each sheet. The term “As-Builts,” once a common notation, is not recom-
mended because it implies that all details illustrated in the drawings were
constructed specifically as shown. Rarely is this true. Consequently, the
engineer who certifies “As-Built” drawings may be exposed to potential
liability. A qualifying statement should be placed on record drawings to
the effect that the drawings are not warranted but are believed to represent
conditions upon completion of construction within reasonable tolerances
based on information furnished to, or obtained by, the engineer who certi-
fies the drawings. It is recommended that record sets of such revised
drawings should become a part of the owner’s permanent sewer records.
352 GRAVITY SANITARY SEWER DESIGN AND CONSTRUCTION

10.3. PROJECT MANUAL
10.3.1. Introduction
The bound volume containing the bidding documents, the agreement
forms, the conditions of the contract, and the specifications is preferably
termed the Project Manual. The commonly used title “Specifications” is
misleading in that the bound volume contains far more than the material
and workmanship requirements for the project, which is the definition of
the term “specifications.”
The introduction to this chapter (Section 10.1) recommended that the
standard documents of the Engineers’ Joint Contract Documents Com-
mittee (EJCDC 2002a through 2002e) be used as a basis for developing
contract documents. In addition, the “Commentary on Contract Docu-
ments” (Clark 1993) should also be used in the development of contract
documents. Due to the increased legal exposure of the engineer and
owner, the adoption of these standard documents (to benefit from mutual
legal experience) should be considered.
These documents are closely related and coordinated. Changes in one
may require changes in one or more of the others. Furthermore, the stan-
dard documents (as well as documents developed internally by the engi-
neer or owner) should be reviewed by the attorneys for both the owner
and the engineer for each project due to their legal consequences. It is
especially important that coordination of documents be reviewed if non-
standard documents are being used.
Standard documents generally provide acceptable documents and,
through widespread usage, are better understood and less subject to mis-
interpretation. Furthermore, they offer the user language which has been
tested by the courts.
Although there is a saving of time by utilizing standard documents in
preparation of contract documents, one should guard against irrelevant
or contradictory requirements within the entire contract document, par-
ticularly between standard and specific portions of the contract. Again,
good legal advice is essential.
The most widely used standard for organizing specifications, Master-
Format™, is published by the Construction Specifications Institute (CSI).
Recently, a new MasterFormat™ 2004 Edition (CSI 2004) was released,
which replaced the previous 1995 edition. The newer version incorporates
the most significant revisions in the product’s 40-year history. The major
differences between the 2004 and 1995 editions include the following:
expansion of the number of divisions from 16 to 50; creation of additional
separate divisions for specialty areas; reservation of divisions for future
expansion; and expansion of the numbering system from a five- to a six-
digit system.
CONSTRUCTION CONTRACT DOCUMENTS 353

10.3.2. Purpose
Documents contained in the Project Manual set forth the details of
the contractual agreement between the contractor and owner. They
describe the work to be done—complementing the information provided
on the drawings—and establish the method of payment. They also set
forth the details for the performance of the work, including necessary
time schedules and requirements for insurance, permits, licenses, and
other special procedures.
Documents contained in the Project Manual must be clear, concise, and
complete (CSI 2005). All portions should be written to avoid ambiguity in
interpretation. Specifications should be easily understood and should be
devoid of unnecessary words and phrases, yet they must completely out-
line the requirements of the project. Reference to standards, such as those
of ASTM International, can be used to reduce the bulk of the specifica-
tions without detracting from completeness. A high degree of writing
skill and thorough knowledge of standards are needed to produce a qual-
ity set of documents.
10.3.3. Arrangement
The arrangement of the contents of the Project Manual varies, depend-
ing to an extent on the requirements of the owner and the practices of the
engineer. Furthermore, arrangement and division of the contents are fre-
quently subject to local legal requirements.
Many government agencies, private owners, and engineers have
adopted the practices established by the CSI. As a means of standardiz-
ing the order of the documents and the location of contract subject matter
within the Project Manual, and thereby improving communications
among the construction team, it is recommended that the practices
embodied in the Project Resource Manual—CSI Manual of Practice (CSI
2005) be considered in the preparation of the Project Manual. The
EJCDC’s Uniform Location of Subject Matter (EJCDC 1995) is also recom-
mended as a guide in the preparation of Project Manuals to further
improve communications.
Preferably, all parts of the Project Manual are bound in a single vol-
ume. However, for extensive programs of sewer construction, a Standard
Project Manual may be developed, to be bound separately and incorpo-
rated by reference in manuals for individual but related projects.
The Project Manual is divided most logically into parts that each define
a phase or function in the overall administration and performance of the
contract. Details included in one section generally should not be repeated
in others. Refer to Section 10.3.10 for a checklist with general notes on con-
tent of these sections.
354 GRAVITY SANITARY SEWER DESIGN AND CONSTRUCTION

The assembled Project Manual should be prefaced with a cover page,
title page, and table of contents. A convenient arrangement which organ-
izes the parts in their logical order of use is as follows:
• Addenda
• Procurement Requirements
• Contracting Requirements
• Specifications
General notes on these sections may be found on the pages following,
with details covered in the included checklist.
10.3.4. Addenda
Addenda are issued during the bidding period to correct errors and
omissions in the contract documents, to clarify questions raised by bidders,
and to issue additions and deletions to the documents. Changes to both
graphic and written documents may be accomplished by an addendum.
Procedures for issuing addenda are described in the Instructions to
Bidders, and space for the bidder to acknowledge their receipt is provided
in the Bid Form. Addenda must be issued sufficiently in advance of the
bid opening to give bidders time to account for any modifications in the
preparation of bids.
10.3.5. Procurement Requirements
Procurement requirements instruct the bidders or proposers about
the established procedures for preparing and submitting their bids or
proposals, and should be clearly set forth in the Project Manual. This
section covers all requirements, instructions, and forms pertaining to
the submission of pricing in the form of bids or proposals from prospec-
tive contractors.
With respect to the use of the standard documents, the EJCDC and CSI
exclude procurement requirements from their definition of contract docu-
ments. This is primarily for two reasons: (1) much of their substance per-
tains to relationships before the agreement is signed and does not pertain
to the performance of the work; and (2) the EJCDC Standard General Con-
ditions of the contract apply to negotiated as well as to bid contracts.
However, in special circumstances (such as a detailed Bid Form for a com-
plex unit price contract), it may prove wise to attach the bid as an exhibit
to the agreement.
The procurement requirements for obtaining bids differ from the
requirements for obtaining proposals. The procurement requirements
include the following items.
CONSTRUCTION CONTRACT DOCUMENTS 355

10.3.5.1. Solicitation
Bid solicitations fall into two categories: Invitations to Bid and Adver-
tisements to Bid. The document should be brief and simple, containing
only the information essential to permit a prospective bidder to determine
whether the work is in his line, whether he has the capacity to perform,
whether he satisfies the prequalification requirements, whether he will
have time to prepare a bid, and how to obtain bid documents.
Soliciting a proposal requires a different type of process. This process is
utilized to seek out unique solutions using delivery methods other than
the traditional bidding process. In soliciting a proposal, a Request for Pro-
posal (RFP) is usually prepared by the owner or engineer. The RFP
describes what is desired by the owner.
10.3.5.2. Instructions for Procurement
The Instructions to Bidders furnish prospective bidders with detailed
information and requirements for properly preparing and submitting
bids. Included here are bidder’s responsibilities and obligations; the
method of preparation and submission of proposals; the manner in
which bids will be canvassed, the successful bidder selected, and the con-
tract executed; and other general information regarding the bid award
procedure.
Unlike the bidding process, the proposal and negotiation process has
not generated standard printed documents. The purpose of these instruc-
tions should be to establish proper methods of obtaining clarifications or
interpretations and to define documents such as addenda.
10.3.5.3. Available Information
Information available to the bidder or proposer is listed in this section.
The section for the bidding process could include such information as
geotechnical reports, soil boring data, hazardous materials reports,
descriptions of the site, resource drawings of existing buildings, and
property survey information. The EJCDC’s recommended practice is to
include a reference to the information and describe the availability and
location where the information may be reviewed. A disclaimer, however,
may be advised to prevent the owner and the engineer from being held
responsible for conclusions drawn from this information. This informa-
tion, when made available, is for the bidders’ use in preparing the bids
but is not part of the contract documents.
The information made available for developing a proposal could
include subsurface information and other existing conditions similar to a
bid situation. It may also include documents the owner wishes to make
available and drawings such as diagrams and schematics.
356 GRAVITY SANITARY SEWER DESIGN AND CONSTRUCTION

10.3.5.4. Procurement Forms and Supplements
The bid process requires a Bid Form be prepared and submitted to the
owner. The purpose of a Bid Form is to ensure systematic submittal of
pertinent data by all bidders in a form convenient for comparison. The
Bid Form should not contain basic contractual provisions since it is only
an offer to perform the work as required by and in accordance with the
contract documents. It must be so worded and prepared that all bidders
will be submitting prices on a uniform basis, allowing for equal consider-
ation in awarding a contract.
The Bid Form is addressed to the owner of the proposed work and is to
be signed by the bidder. The project for which the bid is submitted must
be identified. The Bid Form contains spaces for insertion of unit or lump
sum prices and may also contain spaces for each bidder’s extensions for
each item and a total bid price; however, it must be stated that bidder’s
extensions and total bid price are unofficial and subject to verification by
the owner. Bid prices are commonly stated in both words and figures,
with the word description governing in case of a discrepancy.
The Bid Form may provide for taking bids on alternative materials or
methods of executing portions of the work. It may provide for combina-
tion bids on several contracts in the project. The basis for considering
alternatives and combinations must be described in the Instructions to
Bidders and set forth in the Bid Form. An informal comparison of bids
first may be made, based on the totals given in the submitted Bid Forms.
The formal bid comparison must be made after the extensions of unit
prices and totals of contract items have been checked and determined by
the owner to be correct.
The completion date or time is generally set by the owner so that all
bidders are submitting prices on the same time basis and the only variable
is price. However, on some projects, the time allowed for construction or
completion may be set by the bidder as part of his bid. The latter practice
is less common due to the complexities created in evaluating and compar-
ing bids. This may be selected if time is more important than cost. If this
course is chosen, criteria for evaluating the time for completion must be
established in the Instructions to Bidders.
The Bid Form contains spaces for the bidders to acknowledge the
receipt of addenda issued during the bidding period. Statements must
also be included to the effect that the bidder has received or examined all
documents pertaining to the project, that the requirements of addenda
were taken into consideration in rendering the bid, and that all docu-
ments and the site have been examined.
Whether the process is formal or informal, the proposal process may
utilize a similar form to the bid process. The Proposal Form provides
assurances that all information requested by the owner is provided. The
CONSTRUCTION CONTRACT DOCUMENTS 357

form can include acknowledgments similar to the Bid Form. Supplements
to the Proposal Form can also be required to allow the owner to evaluate
priorities other than price, such as schedule, value analysis, alternative
products, or suggested modifications.
10.3.6. Contracting Requirements
The Contracting Requirements are the legal documents that describe the
contractual requirements. Their purpose is to define the processes, rights,
responsibilities, and relationships of the parties to the contract. They are
comprised of the contracting forms, project forms, conditions of the con-
tract, and special forms such as revisions, clarifications, and modifications.
10.3.6.1. Contracting Forms
The contracting forms section typically includes the Notice of Award,
Construction Agreement, and attachments to the Agreement. The Con-
struction Agreement, typically referred to as the Contract, is the docu-
ment that legally obligates each party signing the Contract. The form of
the Contract is regulated by the laws of the local jurisdiction and state in
which it is executed. The Contract must, however, cover all items of work
included in the bid except those that have been eliminated as alternative
items. It also must bind the contracting parties to conformity with the pro-
visions of all the contract documents.
10.3.6.2. Project Forms
The Project Forms section typically includes bond forms, certificates
and other forms, clarification and modification forms, and closeout forms.
Signing of the Agreement is contingent on prior receipt of the executed
bonds. Bonds must be executed by a financially responsible and accept-
able surety company (U.S. Treasury Department, updated annually).
General practice is to require performance and payment bonds and that
each be in the amount of the contract bid price. Maintenance or guarantee
bonds may also be required.
10.3.6.3. Conditions of the Contract
This portion of the contract documents is concerned with the adminis-
trative and legal relationships, rights and responsibilities between the
owner, the owner’s representatives, the contractor, subcontractors, the
public, and other contractors. Conditions of the Contract should contain
instructions on how to implement the provisions of the Contract. They
should not include detailed specifications for materials, workmanship, or
work-related administrative or nonlegal matters.
358 GRAVITY SANITARY SEWER DESIGN AND CONSTRUCTION

The conditions of the Contract consist of two parts: the General Condi-
tions and the Supplementary Conditions.
Standard General Conditions have been developed by professional
societies, as well as by government agencies and private owners. Consul-
tants frequently use in-house standards for projects of their design.
Standard General Conditions usually require revisions, deletions, or
additions to suit the needs of a particular project. These changes are incor-
porated into the Supplementary Conditions.
The carefully chosen language contained in the Standard General Con-
ditions should be modified only when necessary for a specific project as
may be required by the locale of the project, the requirements of the
owner, or the complexity of the project. All modifications must be coordi-
nated with the other documents to avoid the creation of contradictory
requirements within the contract documents. The EJCDC Guide to the
Preparation of Supplementary Conditions (EJCDC 2002d) gives examples
of wording for modifications which occur frequently. However, modifica-
tions to the Standard General Conditions via the Supplementary Condi-
tions should not occur without explicit approval and guidance from the
owner, the owner’s legal counsel, and the owner’s insurance adviser.
Many currently published Standard General Conditions contain arti-
cles of a nonlegal nature, such as submittals. With the general acceptance
of the MasterFormat
TM
2004 Edition and its proper utilization, nonlegal
matters more appropriately should be dealt with in “Division 01, General
Requirements” of the specifications.
10.3.6.4. Revisions, Clarifications, and Modifications
Revisions consist of precontract revisions made prior to signing the
Agreement. These are the written addenda or graphical documents
issued to clarify, revise, add to, or delete information in the original bid
documents or in previous addenda. An addendum is issued prior to the
receipt of bids or proposals.
Clarifications consist of documents initiating changes or clarifications
that have not been incorporated into the Contract by a formal contract
modification.
Modifications include written amendments to the contract documents
after the Construction Agreement has been signed. These modifications
are typically accomplished by change orders, work change directives, and
field orders.
Modifications serve to clarify, revise, delete from, or add to the existing
contract documents. They serve to rectify errors, omissions, and discrep-
ancies, and to institute design changes requested by the owner or made
necessary by unanticipated conditions encountered in carrying out the
work. The procedures for effecting modifications must be clearly spelled
out in the contract documents.
CONSTRUCTION CONTRACT DOCUMENTS 359

10.3.7. Specifications
Specifications cover qualitative requirements for materials, equipment,
and workmanship as well as administrative, work-related requirements.
The two types of provisions should be kept separate.
The MasterFormat™ 2004 Edition provides a 50-division framework
for the development of project specifications. Each division consists of a
number of related sections. Division titles are fixed; sections under each
division use a six-digit numbering system consisting of three pairs of two
digits. Many divisions are not applicable to sewer work and would be
deleted, with the remaining divisions utilized to define project require-
ments (see included checklist, Section 10.3.10).
10.3.7.1. General Requirements (CSI Division 01)
Individual characteristics regarding conditions of the work, proce-
dures, access to the site, coordination with other contractors, scheduling,
facilities available, and other nonlegal, work-related, and administrative
details which are unique to the particular contract are placed properly in
the General Requirements.
Division 01 sections expand on the administrative and procedural con-
ditions of the Contract. These sections in Division 01 apply broadly to the
execution of the work of all the other sections of the specifications. CSI
practice is to state information only once and in the right place. Hence,
Division 01 sections should be written in language broad enough to apply
to the sections in all other divisions.
10.3.7.2. Material and Workmanship Specifications
(CSI Divisions 02 through 49)
Specific details regarding materials or workmanship applicable to the
project may be written especially for the Contract, or general specifica-
tions called Standard Specifications may be prepared which are intended
to apply to many contracts. In addition, government and private organi-
zations in many areas have developed standard specifications for sewer
construction, which reflect local practices. These standards should be
reviewed to obtain an understanding of common practices in a particular
locale.
Commonly, materials are specified by reference to specifications of
ASTM International, the American National Standards Institute (ANSI),
the American Concrete Institute (ACI), the American Water Works Asso-
ciation (AWWA), and other similar organizations.
Standards of workmanship should be described in specific terms when
feasible, but specification of construction means and methods and safety
should always be avoided. Nonetheless, parameters and limits often must
360 GRAVITY SANITARY SEWER DESIGN AND CONSTRUCTION

be specified to ensure that construction procedures will be consistent with
design intent.
The MasterFormat™ 2004 Edition divides the specifications into sub-
groupings of divisions which contain work result sections applicable only
to specific types of projects, such as building construction, heavy civil
work, and process plant construction. The exception to this is for civil
work, which is contained in the Site and Infrastructure subgroup located
in the 30-series of the divisions.
For a major sewer project, the checklist (Section 10.3.10) covers the major-
ity of material and workmanship specifications which may be required.
10.3.8. Supplementary Information
Frequently, special studies such as soil analyses and soil borings are
made during the design phase of a project. The results of such soil inves-
tigations and samplings with soil classifications should be made available
to the prospective bidders during the bidding period.
All available information pertinent to the work, especially with refer-
ence to subsurface conditions, should be made available to the bidders for
examination. Bidders should be obliged to make their own interpretations
of the subsoil information.
Arrangements should be made with the owner to permit bidders to
inspect the soil samples and to make such additional soil borings as they
may deem necessary prior to the bid date. Competent legal advice should
be obtained in deciding whether or not such information should be made
a part of the contract documents.
10.3.9. Standard Specifications
General specifications for workmanship and materials are intended to
provide detailed descriptions of acceptable materials and performance
standards which can be applied to all sewer contracts in a given jurisdic-
tion. The description of acceptable construction procedures should be
avoided in Standard Specifications. Any time that construction proce-
dures are specified, care should be exercised to prevent the substitution of
fixed concepts for the contractor’s initiative. In every case, procedures
must achieve, safely, the specified final results.
General specifications are usually aimed at more than any one specific
contract. They may be used on a group of similar contracts or even for
larger groups of dissimilar contracts.
A supplement to the Standard Specifications may be written to include
special requirements modifying the Standard Specifications for a particu-
lar contract. In this regard, care must be taken in using Standard Specifica-
tions so that the work involved in writing supplements is not greater than
the work that would be required to write completely new specifications
CONSTRUCTION CONTRACT DOCUMENTS 361

for the contract. The use of computer-produced specifications facilitates
converting Standard Specifications into project-specific ones.
It may be necessary to write a long supplementary specification due to
the fact that the Standard Specifications are promulgated into law by a
governing body. The engineer or owner cannot supersede this document
except by supplementing the unwanted provisions in the governing
body’s standard specifications.
10.3.10. Project Manual Checklist
The Project Manual must cover all the legal, contractual, and specifica-
tions requirements for the contract. The MasterFormat
TM
2004 Edition
provides an excellent basis for a Project Manual checklist. The checklist
delineates but does not classify these items in detail. Titles given in the
listing refer to CSI Level 1 titles; reference to the MasterFormat™ 2004
Edition will assist in a more complete title breakdown.
As a guide for determining completeness of construction documents,
the following checklist of subjects is offered:
10.3.10.1. Procurement Requirements
10.3.10.1.1. Solicitation
• Identification of owner or contracting agency.
• Name of project, contract number, or other positive means of
identification.
• Time and place for receipt and opening of bids.
• Brief description of work to be performed.
• When and where contract documents may be examined.
• When and where contract documents may be obtained; deposits and
refunds therefor.
• Amount and character of any required bid security.
• Reference to further instructions and legal requirements contained
in the related documents.
• Statement of owner’s right to reject any or all bids.
• Contractor’s registration requirements.
• Bidder’s prequalification, if required.
• Reference to special federal or state aid financing requirements.
10.3.10.1.2. Instructions for Procurement
• Instructions in regard to Bid Form, including method of preparing,
signing, and submitting same; instructions on alternatives or options;
data and formal documents to accompany bids; etc.
362 GRAVITY SANITARY SEWER DESIGN AND CONSTRUCTION

• Bid security requirements and conditions regarding return, reten-
tion, and forfeiture.
• Requirements for bidders to examine the documents and the site of
the work.
• Use of stated quantities in unit price contracts.
• Withdrawals or modification of bid after submittal.
• Rejection of bids and disqualification of bidders.
• Evaluation of bids.
• Award and execution of contract.
• Failure of bidder to execute contract.
• Instructions pertaining to subcontractors.
• Instructions relative to resolution of ambiguities and discrepancies
during the bid period.
• Contract bonding requirements.
• Governing laws and regulations.
10.3.10.1.3. Available Information
• Survey information
• Geotechnical data
10.3.10.1.4. Procurement Forms and Supplements
• Identification of contract
• Acknowledgment of receipt of addenda
• Bid prices (lump sum or unit prices)
• Construction time or completion date
• Amount of liquidated damages
• Financial statement
• Experience and equipment statements
• Subcontractor listing
• Contractor’s statement of ownership
• Contractor’s signature (and seal, if required)
• Bidder’s qualifications
• Noncollusion affidavit
• Consent of surety
10.3.10.2. Contracting Requirements
10.3.10.2.1. Notice of Award
10.3.10.2.2. Agreement Form
• Identification of principal parties
• Date of execution
CONSTRUCTION CONTRACT DOCUMENTS 363

• Project description and identification
• Contract amount (sometimes with reference to and attachment of
the contractor’s bid)
• Contract time
• Liquidated damage clause, if any
• Progress payment provisions (may be covered in Conditions of the
Contract or Division 01)
• List of documents comprising the contract (may be covered in Con-
ditions of the Contract or Division 01)
• Authentication with signatures and seals
10.3.10.2.3. Special Forms
10.3.10.2.4. Bonds Forms
• Performance Bond
• Labor and Material Payment Bonds
• Maintenance and Guarantee Bonds (if required)
10.3.10.2.5. Notice to Proceed
10.3.10.3. Conditions of the Contract
• General Conditions
• Supplementary Conditions
10.3.10.4. Revisions, Clarifications, and Modifications
• Precontract Revisions
• Record Clarifications and Proposals
• Record Modifications
10.3.10.5. Specifications
10.3.10.5.1. General Requirements (CSI Division 01)
• Summary of work
• Price and payment procedures (many offices include this in the par-
ticular work item)
• Project management and coordination
• Submittal procedures
• Quality requirements
• Temporary facilities and controls (protection)
• Product requirements
• Execution and close-out requirements
364 GRAVITY SANITARY SEWER DESIGN AND CONSTRUCTION

10.3.10.5.2. Concrete (CSI Division 03)
• Concrete
a. Concrete forming
b. Concrete reinforcing
c. Cast-in-place concrete
d. Precast concrete
e. Grouting
10.3.10.5.3. Finishes (CSI Division 09)
• Painting and coating
• Waterproofing
10.3.10.5.4. Earthwork (CSI Division 31)
• Site clearing (tree/shrub and pavement removal, soil stripping and
stockpiling).
• Earth moving (grading, excavating, backfill and compaction, trench-
ing, dewatering, erosion and sedimentation controls)
• Tunneling (excavating, drilling and blasting, construction)
10.3.10.5.5. Exterior Improvements (CSI Division 32)
• Paving and surfacing (streets, roadways, and sidewalks)
• Highways and railroad crossings
10.3.10.5.6. Utilities (CSI Division 33)
• Trenchless utility installation (directional drilling, pipe jacking,
microtunneling, pipe ramming)
• Piping materials and jointing
• Manholes and appurtenances
• Pipe laying (control of alignment and control of grade)
• Service connections
• Connections to existing sewers
• Connections between different pipe materials
• Concrete encasement or cradle
• Sewer paralleling water main
• Sewer crossing water main
• Repair of damaged utility services
• Acceptance tests (infiltration, exfiltration, smoke, and air)
CONSTRUCTION CONTRACT DOCUMENTS 365

REFERENCES
Clark, J. R. (1993). “Commentary on agreements for engineering services and con-
struction related documents,” EJCDC Document No. 1910-9. Engineers’ Joint
Contract Documents Committee, available at <www.ejcdc.org>.
Construction Specifications Institute (CSI). (2005). “The project resource manual—
CSI manual of practice,” fifth ed., McGraw-Hill, New York.
CSI. (2004). “MasterFormat
TM
2004 edition, master list of numbers and titles for
the construction industry,” CSI, Alexandria, Va.
Engineers’ Joint Contract Documents Committee, (including as member organiza-
tions: American Society of Civil Engineers, National Society of Professional
Engineers, and American Council of Engineering Companies (EJCDC) and The
Construction Specifications Institute (CSI). (2002a). “Standard general condi-
tions of the construction contract,” Document No. C-700, available at <www
.ejcdc.org>.
EJCDC/CSI. (2002b). “Standard form of agreement between owner and contractor.”
For construction contract (stipulated price), Document No. C-520; for construc-
tion contract (cost-plus), Document No. C-525, available at <www.ejcdc.org>.
EJCDC/CSI. (2002c). “Suggested instructions to bidders for construction con-
tracts,” Document No. C-200, available at <www.ejcdc.org>.
EJCDC/CSI. (2002d). “Guide to the preparation of supplementary conditions,”
Document No. C-800, available at <www.ejcdc.org>.
EJCDC/CSI (2002e). “Suggested bid form for construction contracts,” Document
No. C-410, available at <www.ejcdc.org>.
EJCDC/CSI. (1995). “Uniform location of subject matter,” Document No. 1910-16,
available at <www.ejcdc.org>.
U.S. Treasury Department. (Updated annually). “Companies holding certificates
of authority as acceptable sureties on federal bonds and as acceptable reinsur-
ing companies.” Audit Staff Bureau of Accounts Circular 570, U.S. Treasury
Department, Washington, D.C.
366 GRAVITY SANITARY SEWER DESIGN AND CONSTRUCTION

11.1. INTRODUCTION
This chapter discusses construction methods in common use. Local con-
ditions, of course, will dictate variations, and the ingenuities of the owner,
engineer, and contractor must be applied continually if construction costs
are to be minimized and acceptable standards are to be achieved.
Commencement of the construction phase normally introduces the
third party—the contractor—to the sanitary sewer project, and the division
of responsibility and liability must be understood by all. The role of the
engineer changes from active direction and performance during design
(a relationship to the owner) to that of professional and technical observa-
tion during construction. The engineer’s duty during construction (during
the contractual relationship between owner and contractor) is to determine
for the owner that the work is substantially in accordance with the contract
documents—in other words, acceptable. It is important to note, however,
that the engineer’s representative on the construction site is not expected
to duplicate the detailed inspection of material and workmanship properly
delegated to the manufacturer, supplier, and contractor.
Preconstruction conferences are helpful in deciding whether the con-
tractor’s proposed operations are compatible with contract requirements
and whether they will result in finished construction acceptable to the
owner and the engineer. These joint meetings of the owner, engineer, and
contractor should culminate in definite construction protocol and admin-
istrative procedures to be followed throughout the life of the construction
contract in accordance with that contract, and should include items such
as progress schedules, payment details, method of making submittals for
approval, and channels of communications. All of these aspects of con-
struction should be mutually understood before construction begins.
CHAPTER 11
CONSTRUCTION METHODS
367

11.2. PROJECT COSTS
Part of the evaluation of the feasibility of a sanitary sewer system is the
total project cost. This consists of design costs, both direct and indirect
construction costs, and administrative costs such as financial and legal
expertise. Although the total project cost may not be the dominant factor
in how a project is completed, it is important enough to review here.
11.2.1. Design Costs
The items included in design costs include planning and evaluating
alternatives, surveying, engineering design, environmental assessments,
permitting and review fees, land acquisition (if required), and geotechni-
cal investigations. In most instances, design costs are a small percentage
of the total project costs. Typical design fees are less than 10% of construc-
tion costs for new construction and less than 20% of construction costs for
reconstruction projects.
11.2.2. Construction Costs
Construction costs include all items necessary to install the sanitary
sewer system. In addition to the actual installation of the sanitary sewer
(direct construction costs), there are indirect construction costs. These are
the effects or consequences of the sanitary sewer installation. A brief
description of direct and indirect costs follows.
11.2.3. Direct Construction Costs
By far the largest percentage of total project costs is the direct construc-
tion costs. This includes the materials, equipment, and labor required to
construct the sanitary sewer system.
11.2.4. Indirect Construction Costs
11.2.4.1. Vehicular Traffic Disruption
Traffic disruptions may take two forms during construction projects:
detours and delays. Detours force motorists to take longer routes than
they would normally use. When constructing a sanitary sewer on an exist-
ing street and keeping the area open to traffic, delays will likely occur
during delivery of materials or equipment, installing laterals, or connect-
ing into existing systems. The additional time spent in negotiating these
detours or construction zones results in additional fuel use by the affected
motorists.
368 GRAVITY SANITARY SEWER DESIGN AND CONSTRUCTION

11.2.4.2. Road and Pavement Damage
The road and pavement damage referred to here is the portion in the con-
struction zone. Depending upon soil conditions, either a portion of the road-
way or the entire roadway may be removed during the trenching operation.
In some cases where only a portion of the roadway is removed for sanitary
sewer installation, the remainder of the roadway is effectively destroyed
due to the heavy construction traffic that must use it to complete the project.
11.2.4.3. Damage to Adjacent Utilities
The construction portion of the project is when adjacent utilities, such
as electrical, gas, and telephone facilities, are actually discovered. Even
though records of these installations have been more accurate in recent
years and the equipment used to locate them is more accurate, there still
seem to be many surprises, such as unmarked utilities, on construction
projects. The costs involved in repairing inadvertently damaged facilities
consist of both the repair and the loss of production (down time) while
making these repairs.
11.2.4.4. Damage to Adjacent Structures
The indirect cost attributable to damage to adjacent structures takes
two forms. The first is the slower rate of progress in confined areas; the
other is the time and expense required to repair the damaged structures.
As with damaged utilities, the costs involved include both the cost of the
repair and the lost production time while the repair is being completed.
11.2.4.5. Heavy Construction and Air Pollution
The construction process is, by nature, noisy and dirty. Although the
contractor is used to this process and takes precautions to minimize
impacts to the contractor’s work force, the general public views this as an
inconvenience. The noise, vibration, and exhaust fumes from the con-
struction equipment can have an adverse effect on everyday life in the
neighborhood where the work is occurring. This can range from noise
inconvenience to possible health hazards from concentrated exhaust
fumes. It is difficult to quantify these effects of the construction on the
neighborhood, but steps can be taken to minimize these effects.
11.2.4.6. Pedestrian Safety
Providing pedestrian access through the construction site can be a very
expensive proposition. In large projects in confined city streets, tempo-
rary pedestrian walkways may need to be established. In addition, walk-
ways may need to be moved during construction as the sanitary sewer
installation process moves along the street.
CONSTRUCTION METHODS 369

11.2.4.7. Business and Trade Loss
It is common for businesses along construction projects to experience a
loss in business during construction projects in front of the business. Even
if access is provided at all times, some customers will opt to not go to the
business if there is any inconvenience at all.
11.2.4.8. Damage to Detour Roads
If a detour route is established for a project, the increased traffic on the
detour route may cause damage to the existing pavement. Repairs to this
pavement would be attributable to the construction project.
11.2.4.9. Site Safety
The site safety referred to here is public safety. This includes motorists,
pedestrians, and emergency vehicles. Sufficient precautions must be
established to permit crossing the work site, and access for emergency
vehicles to reach homes and businesses along the line of work must be
preserved at all times. Site safety for the contractor and subcontractors is
considered a direct construction cost.
11.2.4.10. Citizen Complaints
When they occur, citizen complaints should be addressed immediately.
Public relations are always a part of the construction process. The com-
plaint should be heard and a response defining the corrective action, if any,
should be given to the complaining party. Even a response indicating that
nothing additional will be done for a complaint is better than no response.
11.2.4.11. Environmental Impact
In some instances, sanitary sewers are constructed in environmentally
sensitive areas. Examples of this are construction through or under rivers
and streams and through or near wetlands. During this type of installa-
tion, additional care should be taken to minimize disruption and envi-
ronmental damage to these areas. Additional costs are incurred in the
installation and maintenance of the best management practices used to
keep these areas in their natural state.
11.3. CONSTRUCTION SURVEYS
11.3.1. General
The engineer should arrange through a licensed surveyor to establish
baselines and benchmarks for sanitary sewer line and grade control along
the route of the proposed construction. All control points should be refer-
370 GRAVITY SANITARY SEWER DESIGN AND CONSTRUCTION

enced adequately to permanent objects located outside normal construc-
tion limits.
11.3.2. Preliminary Layouts
Prior to the start of any work, rights-of-way, work areas, clearing lim-
its, and pavement cuts should be laid out to give proper recognition to,
and protection for, adjacent properties. Access roads, detours, bypasses,
and protective fences or barricades also should be laid out and con-
structed as required in advance of sanitary sewer construction. All layout
work, if done by the contractor, should be reviewed by the engineer
before any demolition or construction begins.
11.3.3. Setting Line and Grade
The transfer of line and grade from control points established by
the engineer to the construction work should be the responsibility of the
contractor, with spot checks by the engineer as work progresses. The
preservation of stakes or other line and grade references provided by
the engineer is similarly the responsibility of the contractor. (Generally, a
charge is made for re-establishing stakes carelessly destroyed, and the
charge is stated as part of the contract agreement.)
In general, the line and grade for the sanitary sewer may be set by one
or a combination of the following methods:
1. Stakes, spikes, or crosses set on the surface on an offset from the sani-
tary sewer centerline.
2. Stakes set in the trench bottom on the sanitary sewer line as the rough
grade for the sanitary sewer is completed.
3. Elevations given for the finished trench grade and sanitary sewer
invert while sanitary sewer construction progresses.
4. A laser beam of light set in the manhole or a specified height above the
sanitary sewer flowline.
Method 1 generally is used for small-diameter sanitary sewers. Meth-
ods 2 and 3 are used for large sanitary sewers or where sloped trench
walls result in top-of-trench widths too great for practical use of short off-
sets. Method 4 is independent of the size of sanitary sewer.
In Method 1, stakes, spikes, or crosses are set at a uniform offset (inso-
far as practicable) from the sanitary sewer centerline on the opposite side
of the trench from where excavated materials are to be cast. A cut sheet, as
shown in Table 11-1, is prepared; this is a tabulation of the reference
points giving sanitary sewer station, offset, and the vertical distance from
each reference point to the proposed sanitary sewer invert.
CONSTRUCTION METHODS 371

The line and grade may be transferred to the bottom of the sanitary
sewer trench by the use of tape and level, or a patented bar tape and
plumb bob unit.
Another method of setting grade is from offset crosses or stakes and
the use of a grade rod with a target near the top. When the sanitary sewer
invert is on grade, a sighting between grade rod and two or more consec-
utive offset bars or the double string line will show correct alignment.
Method 2, involving transfer of surface references to stakes along the
trench bottom, is in some instances permitted. If stakes are established
along the trench bottom, a string line should be drawn between no fewer
than three points and checked in the manner used for batter boards.
When trench walls are not sheeted but are sloped to prevent caving,
line-and-grade stakes are set in the trench bottom as the excavation pro-
ceeds. This procedure requires a field party to be at the work site almost
constantly.
Method 3, which is applicable to large-diameter sanitary sewers or
monolithic sections of sanitary sewers on flat grades, requires the line and
grade for each pipe length or form section to be set by means of a transit
and level from either on top or inside of the completed conduit.
In the construction of large sanitary sewer sections in an open trench,
both line and grade may be set at or near the trench bottom. Line points
and benchmarks may be established on cross-bracing where such bracing
is in place and rigidly set. Later, alignment and grade must be determined
by checking the setting of the forms.
Method 4, which is quite widely used, is the laser beam control. A laser
is a device that projects a narrow beam of light down the centerline of the
sewer pipe. It is usually set up in the invert of a manhole and then aligned
372 GRAVITY SANITARY SEWER DESIGN AND CONSTRUCTION
TABLE 11-1. Typical Cut Sheet
“A” street _____________ sewer Sheet 1 of 1 Sheet
4th Street to 5th Street Notes book ____________ Page ___________
Stakes 5 ft left Prepared by ___________ Date ___________
Elevation Cut
Size,
Station inches Grade Invert Stake Feet Hundredths Remarks
000 12 0.0025 105.50 110.75 5 25 Existing manhole
025 — 0.0025 105.56 112.30 6 74 —
050 — 0.0025 105.63 109.70 4 07 Y-branch right
075 — 0.0025 105.69 110.35 4 66 —
100 12 0.0025 105.75 111.99 6 24 Etc.
Ft 0.3 m; inch 2.54 cm.

horizontally. The proper slope is established by adjusting a dial on the
machine and aiming the laser. A check elevation should be set about 100 ft
(30 m) from the manhole to ensure that the proper slope is being main-
tained by the beam of light. A target set in the pipe centerline is then used
to align the end of each pipe section. Care should be exercised in the use
of the laser since temperature affects the aiming of the unit.
11.4. SITE PREPARATION
The amount of site preparation required varies from none to the
extreme where the major portion of project costs is expended on items
other than excavating for and construction of the sanitary sewer.
Operations that may properly be classified as site preparation are clear-
ing and grubbing; removal of unsuitable soils; construction of access
roads, detours, and bypasses; improvements to and modification of exist-
ing drainage; location, protection, or relocation of existing utilities; and
pavement cutting. The extent and diversity of these operations make fur-
ther discussion thereof impractical here. Note, however, that the contrac-
tor’s success in keeping the project on schedule depends to a great degree
on the thoroughness of the planning and execution of the site preparation
work. Several engineers and contractors have adopted a practice of assem-
bling extensive photographic or videotape evidence of the preconstruction
condition of sidewalks, driveways, street surfaces, etc., to minimize post-
construction claims by residents for construction-related damages.
11.5. OPEN-TRENCH CONSTRUCTION
11.5.1. Trench Dimensions
With plans and specifications competently prepared, it can be assumed
that the location of the proposed sanitary sewers have been determined
with proper regard for the known locations of existing underground util-
ities, surface improvements, and adjacent buildings. Barring unforeseen
conditions, it becomes the contractor’s objective to complete the work as
shown on the plans at minimum cost and with minimum disturbance of
adjacent facilities.
Because of load considerations, the width of trench at and below the
top of the sanitary sewer should be only as wide as necessary for proper
installation and backfilling, and consistent with safety. The Contract must
provide for alternative methods or require corrective measures to be
employed by the contractor if allowable trench widths are exceeded
through overshooting of rock, caving of earth trenches, or overexcavation.
The width of trench from a plane 1 ft (30 cm) above the top of the sanitary
CONSTRUCTION METHODS 373

sewer to the ground surface is related primarily to its effect on the safety
of the workers who must enter the trench, and on adjoining facilities such
as other utilities, surface improvements, and nearby structures.
In undeveloped subdivisions and in open country, economic consider-
ations often justify sloping the sides of the trench for earth stability from
a plane 1 ft (30 cm) above the top of the finished sanitary sewer to the
ground surface. This eliminates placing, maintaining, and removing sub-
stantial amounts of temporary sheeting and bracing unless safety regula-
tions make some type of sheeting or bracing mandatory. Steel trench
shields, or trench boxes, are often used to protect the workers where
sheeting is deemed unnecessary.
In improved streets, on the other hand, it may be desirable to restrict
the trench width so as to protect existing facilities and reduce the cost of
surface restoration. Available working space, traffic conditions, and eco-
nomics will all influence this decision.
11.5.2. Excavation
With favorable ground conditions, excavation can be accomplished in
one simple operation. Under more adverse conditions it may require sev-
eral steps. In general, stripping, drilling, blasting, and trenching will
cover all phases of the excavation operation.
In all excavations, extreme care should be taken to properly locate, sup-
port, and protect existing utilities. The owners of the utilities should be
contacted before the start of excavations.
11.5.2.1. Stripping
Stripping may be advantageous or required as a first step in trench
excavation for a variety of reasons, the most common of which are:
• Removal of topsoil or other materials to be saved and used for site
restoration.
• Removal of material unsatisfactory for backfill to ensure its separa-
tion from usable excavated soils.
• Removal of material having a low bearing value to a depth where
there is material capable of supporting heavy construction equipment.
• To reduce cuts to depths down to which a backhoe can dig.
• To make it easier to charge drill holes.
11.5.2.2. Rock Removal
11.5.2.2.1. Drilling and Blasting
In some areas, sanitary sewer and house connections must be installed
in hard rock. In addition, some shales and softer rocks that may be ripped
374 GRAVITY SANITARY SEWER DESIGN AND CONSTRUCTION

in open excavation will require blasting before they can be removed in
confined areas as required in trenching or excavating for structures.
Normally, the most economic method will involve preshooting (i.e.,
drilling and shooting rock before removal of overburden). In some
instances the occurrence of wet, granular materials above the rock ledge
will necessitate stripping before drilling, since holes cannot be main-
tained open through the overburden to permit placing of explosive
charges.
For narrow trenches in soft rock, a single row of drill holes may be suf-
ficient. One or more additional rows will be required in harder rock and
for wider trenches. To reduce overbreak and improve bottom fragmenta-
tion, time delays should be used in blasting for trenches. In tight quarters,
trench walls can be presplit and the center shot in successive short rounds
to an open face to produce minimum vibration.
It must be recognized that there will be a minimum feasible trench
width varying with the rock formation, and in the case of small sanitary
sewers it may be necessary to design the conduit for the positive-project-
ing condition or extreme loads.
All ground and air pressures that result from blasting should be
recorded on a sealed cassette seismograph. Surveys of adjacent structures
for the instance of cracks before the blasting are advisable. Blasting
should be done only by persons experienced in such operations.
11.5.2.2.2. Rock Trenching
In some instances, it may be advantageous to perform rock removal
operations using a rock trencher. Rock trenchers remove the rock in the
same way an earth trenching machine does. The rock removed from
the trench is typically placed in a windrow set back from the trench.
This material can then be used as backfill, if suitable, or removed from
the site.
The advantages of rock trenching are:
• It leaves a vertical trench wall, minimizing the rock removal and
restoration to be completed.
• It breaks down the rock into smaller sizes normally suitable to be
utilized as backfill.
Since no blasting is done, there is no chance for rock or overburden to
become airborne and possibly damage property or injure someone.
The disadvantages of rock trenching are:
• It can be very expensive in comparison to drilling and blasting.
• The size of the rock trenching machine makes it impractical to use
in tight construction conditions.
CONSTRUCTION METHODS 375

11.5.2.3. Trenching
The method and equipment used for excavating the trench will depend
on the type of material to be removed, the depth, the amount of space
available for operation of equipment and storage of excavated material,
and prevailing practice in the area.
Ordinarily the choice of method and equipment rests with the contrac-
tor. However, various types of equipment have practical and real limita-
tions regarding minimum trench widths and depths. The contractor is
therefore obligated to utilize only that equipment capable of meeting
trench width limitations imposed by sewer pipe strength requirements or
for other reasons as set forth in the technical specifications.
Spoil should be placed sufficiently back from the edge of the excava-
tion to prevent caving of the trench wall and to permit safe access along
the trench. With sheeted trenches, a minimum distance of 3 ft (1 m) from
the edge of sheeting to the toe of spoil bank will normally provide safe
and adequate access. Under such conditions the supports must be designed
for the added surcharge. In unsupported trenches the minimum distance
from the vertical projection of the trench wall to the toe of the spoil bank
normally should be less than one-half the total depth of excavation. In
most soils, this distance will be greater in order to provide safe access
beyond the sloped trench walls.
11.5.2.3.1. Trenching Machines
This type of machine is generally used for shallow trenches less than
5 ft (1.5 m) deep. For installation of small sanitary sewers and for sew-
ers in cohesive soils, the trenching machine can make rapid progress at
low cost.
11.5.2.3.2. Backhoes
Backhoes like that shown on Fig. 11-1 are available with bucket capaci-
ties varying from
3
⁄
8
to 3 cu yd (0.3 to 2.3 m
3
) and more. They are conven-
ient for the excavation of trenches with widths exceeding 2 ft (0.7 m) and
to depths down to 25 ft (8 m). They are the most satisfactory equipment
for excavation in loosened rock. Minimum trench widths are compared
with some common backhoe sizes in Table 11-2.
The backhoe is also used with a cable sling for lowering sewer pipe
into the trench. By this means, a single piece of equipment can maintain
the sewer pipe-laying close to the point of excavation. Where the soil does
not require sheeting and bracing, this method becomes a very economical
one. When sheeting and bracing must follow the excavation closely, the
combination of a backhoe for excavation and a crane for placement of
sewer pipe is a common practice.
376 GRAVITY SANITARY SEWER DESIGN AND CONSTRUCTION

11.5.2.3.3. Clamshells
When the protection of underground structures or soil conditions
requires close sheeting and the use of vertical lift equipment, the clamshell
bucket is used. In very deep trenches where two-stage excavation is
required, the backhoe is sometimes used in combination with the
clamshell, with the backhoe advancing the upper part of the excavation
CONSTRUCTION METHODS 377
FIGURE 11-1. Typical backhoe.
Courtesy of Chastain-Skillman, Inc.
TABLE 11-2. Trench Widths Associated with Various
Backhoe Bucket Capacities
Minimum Trench Width, inches
Bucket Capacity, cu yd Without Side Cutters With Side Cutters
3
⁄
8
22 24–28
1
⁄
2
27 28–32
3
⁄
4
28 28–38
1 34 34–44
1
1
⁄
4
37 37–46
1
1
⁄
2
38 38–46
2 50 50–58
Inch 2.54 cm; cu yd 0.76 m
3
.

and the clamshell following for the lower. Sheeting and bracing of the
upper part are installed and driven as required prior to the clamming of
the lower part and the installation of the lower stage of sheeting.
11.5.2.3.4. Draglines
In open country, for stream crossings, or in a wide right-of-way, it may
be feasible to do a large part of the excavation by means of a dragline,
allowing the sides of the trenches to acquire their natural slope. In cases of
very deep trench excavation, say 30 to 50 ft (9 to 15 m), the dragline has
been used for the upper part of the excavation, with a backhoe operating
at an intermediate level. By rotating the backhoe, the material thus exca-
vated can be relayed to the dragline, which then lifts it to the spoil bank or
to trucks at the surface.
11.5.2.3.5. Front-End Loaders
The principal use of loaders is in bringing sewer pipe, manholes, and
granular bedding material to the trenches. In wide, deep trenches, the
front-end loader has sometimes been used as an auxiliary to a backhoe or
clamshell. In this arrangement the backhoe excavates the upper part of
the trench and, perhaps, the center section of the lower part, leaving the
bottom bench or benches for the front-end loader or dozer which com-
pletes the excavation, placing the spoil within the reach of the backhoe or
clamshell.
11.5.3. Sheeting and Bracing
Trench sheeting and bracing should be adequate to prevent cave-in of
the trench walls, subsidence of areas adjacent to the trench, and sloughing
of the base of the excavation from water seepage. Responsibility for the
adequacy of any required sheeting and bracing usually is stipulated to be
with the contractor. The strength design of the system of supports should
be based on the principles of soil mechanics and structural engineering as
they apply to the materials encountered. Sheeting and bracing always
must comply with applicable safety requirements.
For wider and deeper trenches, a system of wales and cross-struts of
heavy timber (or steel sections), as shown in Fig. 11-2, is often used. Sheet-
ing is installed outside the horizontal wales as required to maintain the
stability of the trench walls. Jacks mounted on one end of the cross-struts
maintain pressure against the wales and sheeting.
In some soil conditions, it has been found economical and practical to
use steel trench shields, or trench boxes, which are pulled forward as
sewer pipe-laying progresses. Care must be exercised in pulling shields
forward so as not to drag or otherwise disturb the previously laid pipe and
bedding or to create conditions not assumed in calculating trench loads.
378 GRAVITY SANITARY SEWER DESIGN AND CONSTRUCTION

In noncohesive soils containing considerable groundwater, it may be
necessary to use continuous steel sheet piling to prevent excessive soil
movements. Such steel piling usually extends several feet (meters) below
the bottom of the trench unless the lower part of the trench is in firm mate-
rial. In the latter case, the width of the trench in the upper granular material
may be widened so that the steel sheet piling can toe-in to the lower strata.
In some soils, steel sheet piling, such as shown in Fig. 11-3, can be used
with a backhoe operation for the upper part of excavation, but the piling
usually needs to be braced before the excavation has reached its full
depth. The remaining excavation then is performed by vertical lift equip-
ment, such as a clamshell.
Another means of trench sheeting occasionally adopted involves the
use of vertical H-beams as “soldier beams” with horizontal wood lagging.
CONSTRUCTION METHODS 379
FIGURE 11-2. Sheeting and bracing system.
Courtesy of Bruce Corwin, CDM.

This is sometimes advantageous for trenches under existing overhead
viaducts where overhead clearances are low and spread footings lie
alongside the trench walls. The holes for the vertical beams can be partially
excavated and then the beams can be tilted into these holes and driven. As
excavation progresses downward, the lagging is installed between adja-
cent pairs of soldier beams. For deep trenches with limited overhead
clearances, the soldier beams can be delivered to the site in shorter lengths
and their ends field-welded as driving progresses.
The removal of sheeting following pipe laying may affect the earth
load on the sanitary sewer or adjacent structures. This possibility must be
considered during the design phase. If removal is to be permitted, appro-
priate requirements must be placed in the technical specifications. When-
ever sheeting is removed, it must be done properly, taking care to backfill
thoroughly the voids thus created.
11.5.4. Dewatering
Trenches should be dewatered for concrete placement and sewer pipe
laying, and they should be kept continuously dewatered for as long as nec-
essary. Unfortunately, the disposal of large quantities of water from this
operation, in the absence of storm drains or adjacent water courses, may
380 GRAVITY SANITARY SEWER DESIGN AND CONSTRUCTION
FIGURE 11-3. Steel sheeting.
Courtesy of David Howell, Midwest Mole.

present problems. Other means of disposal being unavailable, the possibility
of draining the water through the complete sanitary sewer to a permissible
point of discharge should be considered, provided sufficient precautions are
taken to prevent scour of freshly placed concrete or mortar and to prevent
the transport of sediment. In all cases, care must be exercised to ensure
that property damage, including silt deposits in sanitary sewer and on
streets, does not result from the disposal of trench drainage.
Crushed stone or gravel may be used as a subdrain to facilitate drainage
to trench or sump pumps. It is good practice to provide clay dams in the
subdrain to minimize the possibility of undercutting the sewer founda-
tion from excessive groundwater flows.
An excessive quantity of water, particularly when it creates an unstable
soil condition, may require the use of a well-point system. A system of
this type consists of a series of perforated pipes driven or jetted into the
water-bearing strata on either side of the sanitary sewer trench and con-
nected with a header pipe leading to a pump. The equipment for a well-
point system is expensive and specialized. General contractors often seek
the help of special dewatering contractors for such work. Well-point sys-
tems must be run continuously to avoid disturbing the excavated trench
bottom by uplift pressure.
Where excavation is in coarse water-bearing material, turbine well
pumps may be used to lower the water table during construction. Chemi-
cal or cement grouting and freezing of the soil adjacent to the excavation
have been used in extremely unstable water-bearing strata. Water from all
types of dewatering systems should be checked to ensure that fine-grained
material is not being removed from beneath the pipe, which might cause
future settlement.
11.5.5. Foundations
Firm, cohesive soils provide adequate sewer pipe foundations when
properly prepared. Occasionally, the trench bottom may be shaped to fit
the sewer pipe barrel and holes may be dug to receive projecting joint ele-
ments. A frequent practice is to overexcavate and backfill with granular
material, such as crushed stone, crushed slag, or gravel to provide uniform
bedding of the sewer pipe. Such granular bedding is used because it is
both practical and economical.
In very soft bottoms, it is necessary first, as a minimum, to overexca-
vate to greater depths and stabilize the trench bottom by the addition of
gravel or crushed slag or rock compacted to receive the load. The stabi-
lizing material must be graded to prevent movement of subgrade up into
the stabilized base and the base into the bedding material. Increasingly,
specialized filter fabrics are used to prevent this movement. The required
depth of stabilization should be determined by tests and observations on
the job.
CONSTRUCTION METHODS 381

In those instances where the trench bottom cannot be stabilized satisfac-
torily with a crushed rock or gravel bed, and where limited and intermit-
tent areas of unequal settlement are anticipated, a timber cribbing, piling,
or reinforced concrete cradle may be necessary.
Where the bottom of the trench is rock, it must be overexcavated to
make room for an adequate bedding of granular material which will uni-
formly support the conduit. The trench bottom must be cleaned of shat-
tered and decomposed rock or shale prior to placement of bedding.
In some instances, sanitary sewer pipe (i.e., not cast-in-place) must be
constructed for considerable distances in areas generally subject to subsi-
dence, and consideration should be given to constructing them on a tim-
ber platform or reinforced concrete cradle supported by piling. The sewer’s
support should be adequate to sustain the weight of the full sewer and
backfill. In this case, piling is sometimes driven to grade with a follower
prior to making the excavation. This practice avoids subsidence of trench
walls resulting from pipe-driving vibrations. Extreme care must be taken
to locate all underground structures.
11.5.6. Pipe Sanitary Sewers
Proper sanitary sewer construction requires that quality materials and
acceptable laying methods are to be used. Diligence in ensuring both is
required of all project personnel.
11.5.6.1. Sewer Pipe Quality
Sewer pipe inspection should be properly conducted by the manufac-
turer and by independent testing and inspection laboratories. Moreover,
inspection of sanitary sewer pipe at the pipe plant is usually desirable due
to the transportation charges, which may constitute a substantial portion
of material costs. Inspection may consist of visual inspection of workman-
ship, surface finish, and markings; physical check of length, thickness,
diameter, and joint tolerances; proof of crushing strength (rigid pipe) or
pipe stiffness (flexible pipe) design materials tests; and tests of represen-
tative specimens. If three-edge-bearing (T.E.B.) tests are not used on pre-
cast concrete pipe, core or cylinder tests should be required. However,
because standard cylinder tests are not practical with the mixes used in
some manufacturing methods, core tests are generally used. Cores also
permit checking tolerances on placement of reinforcing cages.
Sewer pipe suppliers should furnish certificates of compliance with
specifications that can be easily checked as the loads of sewer pipe arrive
at the site. Sewer pipe also should be checked visually at time of delivery
for possible damage in transit, and again as it is laid for damage in storage
or handling.
382 GRAVITY SANITARY SEWER DESIGN AND CONSTRUCTION

11.5.6.2. Sewer Pipe Handling
Care must be exercised in handling and bedding all precast sewer pipe,
regardless of cross-sectional shape. All phases of construction should be
undertaken to ensure that, insofar as practical, pipe is installed as
designed. Sewer pipe should be handled during delivery in a manner that
eliminates any possibility of high-impact or point loading, with care taken
to always protect joint elements.
11.5.6.3. Sewer Pipe Placement
Sewer pipe should be laid on a firm but slightly yielding bedding true to
line and grade, with uniform bearing under the full length of the barrel of
the sewer pipe, without break from structure to structure, and with the
socket ends of bell-and-spigot or tongue-and-groove sewer pipe joints fac-
ing upgrade. Sewer pipe should be supported free of the bedding during the
jointing process to avoid disturbance of the subgrade. A suitable excavation
should be made to receive sewer pipe bells and joint collars, where applica-
ble, so the bottom reaction and support are confined only to the sewer pipe
barrel. Adjustment to line and grade should be made by scraping away or
adding adequately compacted foundation material under the sewer pipe,
and not by using wedges and blocks or by beating on the sewer pipe.
Extreme care should be taken in jointing to ensure that the bell and
spigot are clean and free of any foreign materials. Joint materials vary
with the type of sewer pipe used. All pipe joints should be made properly,
using the jointing materials and methods specified. All pipe joints should
be sufficiently tight to meet infiltration or exfiltration tests.
In large-diameter sewers with compression-type joints, considerable
force will be required to insert the spigot fully into the bell. Come-alongs
and winches (or the crane itself) may be rigged to provide the necessary
force. Inserts should be used to prevent the sewer pipe from being thrust
completely home prior to checking gasket location. After the gasket is
checked, the inserts can be removed and the joint completed.
The operation of equipment over small-diameter sewer pipe, or other
actions that would otherwise disturb any conduit after pipe jointing, must
not be permitted.
At the close of each day’s work or when sewer pipe is not being laid,
the end of the sewer pipe should be protected by a close-fitting stopper to
keep the pipe clean, with adequate precautions taken to overcome possi-
ble uplift. The elevation of the last sewer pipe placed should be checked
the next morning before work resumes.
If the sewer pipe load factor is increased with either arch or total
encasement, contraction joints should be provided at regular intervals in
the encasement coincident with the pipe joints to increase flexibility of the
encased conduit.
CONSTRUCTION METHODS 383

11.5.7. Backfilling
11.5.7.1. General Considerations
Backfilling of the sanitary sewer trench is a very important considera-
tion which seldom receives the attention and inspection it deserves. The
methods and equipment used in placing fill must be selected to prevent
dislocation or damage to the sewer pipe. The method of backfilling varies
with the width of the trench, the character of the materials excavated, the
method of excavation, and the degree of compaction required.
11.5.7.2. Degree of Compaction
In improved streets or streets programmed for immediate paving, a
high degree of compaction should be required. In less important streets or
in sparsely inhabited subdivisions where flexible pavement (asphaltic
concrete) roadways are used, a more moderate specification for backfill-
ing may be justified. Along outfall sewers in open country, it may be suf-
ficient to mound the trench and, after natural settlement, return to
regrade the area. Compaction results should be determined in accordance
with current American Association of State Highway and Transportation
Officials (AASHTO) or ASTM test procedures. Laboratory tests to estab-
lish optimum moisture content are commonly done according to the mod-
ified Proctor Method, AASHTO T-180, or ASTM D1557. Field tests to
determine actual compaction may be done by any of several mechanical
methods or by the use of nuclear density meters.
11.5.7.3. Methods of Compaction
11.5.7.3.1. Cohesive Materials
Cohesive materials with high clay content are characterized by small
particle size and low internal friction. They have small ranges of moisture
content over which they may be compacted satisfactorily, and are very
impervious in a dense state. Because of the strong adhesive forces of the
soil particles, strong pressures must be exerted in order to shear the adhe-
sive forces and remold the particles in a dense soil mass. These character-
istics dictate the use of impact-type equipment for most satisfactory
results in compaction. In confined areas, pneumatic tampers and engine-
driven rammers may give good results. The upper portion of the trench
can be consolidated by self-propelled rammers where trench widths are
relatively narrow. In wide trenches, sheepsfoot rollers may be used. If the
degree of compaction required is not high, dozers and loaders may be
used to compact the fill.
Regardless of equipment used, the soil must be near optimum mois-
ture content and compacted in multiple lifts if satisfactory results are to be
obtained. The trench bottom must be free of excessive water before the
first lift of backfill is placed.
384 GRAVITY SANITARY SEWER DESIGN AND CONSTRUCTION

If the material had a high moisture content at the time of excavation,
some preparation of the material probably will be required before spread-
ing in the trench. This may include pulverizing, drying, or blending with
dry or granular materials to improve placement and consolidation.
11.5.7.3.2. Noncohesive Materials
Noncohesive materials are granular with little adhesion but with high
internal friction. Moisture content at the time of compaction is not so crit-
ical; consolidation is effected by reducing the surface friction between
particles, thus allowing them to rearrange in a more compact mass. Con-
sidering the characteristics of noncohesive material, the most satisfactory
compaction is achieved through the use of vibratory equipment.
In confined areas, vibratory plates give the best results. For wider
trenches, vibratory rollers are most satisfactory. Again, if the degree of
compaction required is not high and if the layers are thin, the vibration
impacted by dozer or loader tracks may result in satisfactory consolidation.
In some areas, water is used to consolidate granular materials. How-
ever, unless the fill is saturated and immersion vibrations are used, the
degree and uniformity of compaction cannot be controlled closely. With
some materials, adequate compaction may be obtained by draining off,
through drains constructed in manhole walls, water used to saturate or
puddle fill. These drains are capped after the backfill has drained.
11.5.7.3.3. Borrow Materials
Sometimes the material removed from the trench may be entirely
unsatisfactory for backfill. In this case, selected materials must be hauled
in from other sources.
Both cohesive and noncohesive materials are used, but an assessment
must be made of the possible change in groundwater movement that the
use of outside materials may cause. For example, the use of cohesive
materials to backfill a trench in rock could result in a dam impervious to
groundwater traveling in rock faults, seams, and crevices. On the other
hand, granular materials placed in a clay trench could result in a very
effective subdrain.
11.5.7.4. Backfilling Sequence
Backfilling should proceed immediately upon curing of trench-made
joints and after the concrete cradle, arch, or other structures gain sufficient
strength to withstand loads without damage. Backfill is generally specified
as consisting of three zones, with different criteria for each. The first zone
(embedment) extends from the foundation material to 12 inches (30 cm)
above top of sewer pipe or structure; an intermediate zone generally con-
tains the major volume of the fill; and the upper zone consists of pave-
ment subgrade or finish grading materials.
CONSTRUCTION METHODS 385

The first zone should consist of selected materials placed by hand or by
suitable equipment in such manner as not to disturb the sewer pipe, and
compacted to a density consistent with design assumptions. In some
instances, the material used for granular bedding is brought above the
sewer pipe to ensure high-density backfill with minimum compactive
effort. When installing flexible pipes, attention must be given to proper
placement and compaction of the haunching material from the base of the
pipe to the springline. When high water tables are anticipated, embedment
materials without substantial voids are required to prevent soil migration.
Compaction of the intermediate zone is usually controlled by the loca-
tion. Under traffic areas or other improved existing surfaces, 95% of mod-
ified Proctor density should be required. In other general urban areas,
90% may be adequate. In undeveloped areas, little compaction may be
required. In general, the degree of compaction required will often affect
the choice of material. The use of excavated material, if suitable, is usually
best in areas that are subject to frost heave so that excavated areas will not
move more or move less than undisturbed areas.
Depth and compaction of the upper zone are dependent on the type of
finish grade to be provided. If the construction area is to be seeded or sod-
ded, the upper 18 inches (450 mm) may consist of 14 inches (350 mm) of
select material slightly mounded over the trench and lightly rolled, cov-
ered by 4 inches (100 mm) of topsoil. If the area is to be paved, the upper
zone must be constructed to the proper elevation for receiving base and
paving courses under conditions matching design assumptions for the
subgrade. If the trench backfill is completed in advance of paving, the top
16 inches (150 mm) of the upper zone should be scarified and recompacted
prior to paving. In such instances, it may be necessary to install a tempo-
rary surface to be replaced at a later date with permanent pavement.
Before and during the backfilling of a trench, precautions should be
taken against the flotation of pipe lines due to the entry of large quantities
of water into the trench, which would cause uplift on the empty or partly
filled pipe line.
11.5.8. Surface Restoration
On completion of backfill, the surface should be restored fully to a con-
dition at least equal to that which existed prior to the sanitary sewer con-
struction. Portland cement or asphaltic concrete pavements should be
saw-cut and removed to a point beyond any caving or disturbance of the
base materials prior to patching. If this results in narrow, unstable panels,
pavement should be removed to the next existing contraction or construc-
tion joint. Before replacing permanent pavement, the subgrade must be
restored and compacted until smooth and unyielding.
The final grade in unpaved areas should match existing grades at con-
struction limits without producing drainage problems. Restoration of
386 GRAVITY SANITARY SEWER DESIGN AND CONSTRUCTION

grass, shrubs, and other plantings should be done in conformance with
construction contract documents. Tree damage should be repaired in
accordance with good arboricultural practice.
11.6. SPECIAL CONSTRUCTION
11.6.1. Railroad Crossings
Sanitary sewers at times must be constructed under railroad tracks,
which may be at street level, on a raised embankment above street grade,
or on an existing railroad viaduct. Crossing of tracks at grade or on an
embankment usually can be accomplished most economically by jacking,
boring, tunneling, or a combination thereof. Usually a casing pipe is
inserted and the sewer pipe is placed inside.
When the distance from the base of the rail to the top of the sanitary
sewer is insufficient to allow jacking or tunneling (less than one diameter
clearance), it is necessary either to remove the tracks and interrupt service
during an open-cut operation, or to build a temporary structure for sup-
port of the railroad tracks, after which the sanitary sewer may be con-
structed in an open trench below the structure.
Construction of sanitary sewers under existing railroad viaducts
involves a wide variation in methods, depending on the size of the sani-
tary sewer, its location in plan and elevation with respect to viaduct foot-
ing, type of footings, and the nature of the soil. Where the soil is stable
and the sanitary sewer is of sufficient size to allow the use of tunnel meth-
ods and is located satisfactorily with respect to viaduct footings, tunnel-
ing may be both safe and economical.
When the proposed sanitary sewer does not meet these criteria, special
methods of sheeting and bracing must be devised. To prevent subsequent
movement of soil beneath the footings, all sheeting and bracing should be
left in place.
Early planning with the railroad authorities is essential, since most
companies have extensive design, inspection, and permit requirements.
11.6.2. Crossing of Principal Traffic Arteries
Residential and secondary traffic arteries usually can be closed to traffic
during the construction of sanitary sewer crossings. However, on heavily
traveled streets and highways where public convenience is a major factor,
it may be desirable to use tunneling or jacking methods for the crossing.
When required, limited traffic movements across open trenches can be
accommodated by temporary decking. Trenches of narrow or medium
width can be spanned with prefabricated decks placed on timber mudsills
at the edges of the trench. Where the top of the trench is wider than 16 to
CONSTRUCTION METHODS 387

20 ft (5.3 to 6.7 m), temporary piling for end support (and in some cases,
center support) may be required. Where center supports pass through the
sanitary sewer section, provisions must be made for such piling to remain
until the sanitary sewer is completed. On a project in Chicago (described
in the 1982 edition of this Manual), a center piling of steel was set on the
centerline of a proposed twin-barrel sanitary sewer and later encased in
the sanitary sewer section.
11.6.3. Stream and River Crossings
11.6.3.1. Sanitary Sewer Crossing under Waterway
Stream and river crossings may be constructed either in the dry through
use of cofferdams and diversion channels, or subaqueously. Open trenches
may be excavated from barges with sewer pipe laying and pipe jointing
done by divers. Ball-joint sewer pipe may be effectively used, especially
for force mains. For shallow stream crossings, it may be possible to install
an earth embankment and construct half of the crossings at a time. If con-
structed in the dry, planning and scheduling of construction should be
such that completed portions of the line are not subject to damage in the
event of cofferdam overtopping.
Concrete encasement, if required, should be placed with construction
joints at 30- to 40-ft (9- to 12-m) intervals coincident with pipe joints. Sewer
pipe may be set conveniently to line and grade by supporting it on burlap
bags filled with a dry-batched concrete mix. These bags also may be
placed for construction of bulkheads in subaqueous concrete placements.
After placing the crossings beneath the bottom of the stream, it is usu-
ally advisable to place a layer of large rip-rap to form an armor course to
protect the sewer pipe from erosion or hanging boat anchors.
11.6.3.2. Sanitary Sewer Crossing Spanning Waterway
In Chapter 7, various methods of spanning obstacles are described,
including hanging and fastening sanitary sewers to structural supports
and the construction of sanitary sewer pipe beams. The latter type of
construction consists of a manhole or other supporting structure on either
side of the waterway and the spanning member itself. Where the crossing
is of considerable width, intermediate piers or supports may be necessary.
Figure 11-4 shows a typical aerial span crossing with concrete pipe.
11.6.4. Outfall Structures
11.6.4.1. Riverbank Structures
Sanitary outfall sewers and head walls may be located above or below
surface water levels. When they are partly submerged, it is necessary to
provide some form of cofferdam during construction.
388 GRAVITY SANITARY SEWER DESIGN AND CONSTRUCTION

In shallow water, an earth dike or timber piling may be sufficient to
maintain a dry pit. In deep water, steel sheet piling cofferdams are desir-
able. Usually a single-wall cofferdam with adequate bracing is sufficient,
but in excessive depths at the banks of main navigation channels a double
wall may be required. Standard practice of cofferdam design and con-
struction should govern.
11.6.4.2. Ocean Outfalls
For long ocean outfalls there are two distinct phases of construction:
the inshore section through the surf zone, and the offshore section. The
surf zone usually extends to a depth of 50 ft (15 m) but may be shallower
or deeper depending on local ocean conditions. The inshore or surf zone
section requires positive support and lateral restraint for the outfall sewer
pipe. The inshore section usually requires a temporary pier for driving
sheet piling to maintain the trench through the breakers and for pipe
installation. If the shore is all sand, suitable piles must be driven for sup-
port and anchorage of the outfall pipe.
The offshore section of outfall sewer pipe is usually laid from floating
equipment, such as shown in Fig. 11-5, and is often placed directly on the
ocean floor, provided the grade is satisfactory. Gravel or rock side fill to
CONSTRUCTION METHODS 389
FIGURE 11-4. Installing concrete pipe aerial crossing.
Courtesy of American Concrete Pressure Pipe Association, Reston, Va.

390 GRAVITY SANITARY SEWER DESIGN AND CONSTRUCTION
FIGURE 11-5. Construction of ocean outfall risers—3.5 m diameter, Mumbai,
India.
Courtesy of John Trypus, Black & Veatch.
the springline of the pipe is frequently added to prevent lateral currents
from scouring local potholes, which might cause pipe movement.
Ocean outfall pipes have been made of cast iron, reinforced concrete,
protected steel pipe, plastic pipe, and a combination of these materials.
Small pipelines may be assembled on shore and then pulled or floated into
position. Large lines must be laid in sections, although it is obviously
advantageous to make the lengths as long as possible to minimize the num-
ber of underwater pipe joints which must be assembled by divers. It is also
desirable to select a pipe joint type and construction procedure that will
facilitate underwater connections. This is especially important if the outfall
sewer is in water more than 150 ft (50 m) deep because of the limited time
divers can work at this depth. Flexible pipe joints or ball-and-socket cast
iron pipe (laid with a cradle) permit the jointing of sewer pipe above water,
thus eliminating the use of divers and underwater operations.
11.7. SEWER APPURTENANCES
Recent improvements in both sewer pipe and pipe joints have made it
possible to construct a very watertight sanitary sewer system. It is impor-

tant to be sure that large quantities of extraneous flows are not admitted
at poorly constructed sanitary sewer appurtenances and service connec-
tions. Increased attention to this phase of sanitary sewer construction is
essential if flow of surface and groundwaters in sanitary sewers is to be
reduced.
The sound principles of construction that apply to reinforced concrete
and masonry structures must be applied also to sanitary sewer manholes.
The use of watertight covers, pipe-to-manhole connection seals, and
proper waterproofing at joints between the frame and the top of the struc-
ture are also very important.
Sanitary sewer connections should be permitted only at wye or tee
branches or at machine-cut, watertight-jointed taps. The fitting should be
supported adequately during and after the pipe joint is made. Bell-and-
spigot, compression-type flexible pipe joints should be used at the junc-
tion of the house sewer and service tap. Caps and plugs for any dead-end
branches or house service connections should be made as watertight as
any other pipe joint and be anchored to hold against internal pressure or
external force.
11.8. PROJECT ACCEPTANCE
Upon completion of the sanitary sewer installation, the system should
be tested to verify that there will not be groundwater infiltration into the
system. The following test methods are common ways to verify system
integrity:
• Infiltration/exfiltration testing
• Low-pressure air testing
• Mandrel testing
• Televising
Leakage limits may be stated in terms of water leakage quantities and
should include both a maximum allowable test section rate and a maxi-
mum allowable system average rate. Current information indicates that a
maximum allowable infiltration rate of 50 to 100 gal/inch-diameter/mi
(5 to 10 L/m-diameter/km) of sewer pipe per day can be achieved with-
out additional construction costs.
Manholes need to be tested separately from the sanitary sewer. A leak-
age allowance of 0.1 gal/hr/ft-diameter/ft head (4 L/hr/m-diameter/m
head) is deemed appropriate.
Further discussion on system testing is presented in Chapter 6, Design
of Sanitary Sewer Systems.
CONSTRUCTION METHODS 391

11.8.1. Infiltration/Exfiltration Testing
When groundwater is observed to be at least 4 ft (1.2 m) above the top
of the sewer pipe, the infiltration test can be used to determine the
integrity of the sewer line. Any leakage can be measured with a V-notch
weir or similar flow measuring device. If no leakage is observed, it can be
assumed that the line passes the test.
If the groundwater level is not at least 4 ft (1.2 m) above the top of the
sewer pipe, then an exfiltration test is required. This is performed by
plugging the manhole at the lower end of the test section and filling the
line with water to at least 4 ft (1.2 m) above either the top of the sewer pipe
or the measured groundwater level, whichever is greater. If leakage does
not exceed the limits specified, then the section tested is accepted. If leak-
age exceeds the limits specified, the leak must be located and repaired.
11.8.2. Low-Pressure Air Testing
A low-pressure air test may be used to detect leaks in sewer pipe in
lieu of using an exfiltration or infiltration test. Two air test methods used
are the constant pressure method and the time pressure method, with the
latter the most commonly used. The constant pressure method utilizes an
air flow measuring device operated at 3 psi (20 kPa) greater pressure
than the average back-pressure of any groundwater. In the time pressure
drop method, the air supply is disconnected and the time required for
the pressure to drop from 3.5 psi (24 kPa) to 2.5 psi (17 kPa) gauge is
determined. Test procedures and calculations are available from ASTM
International.
In applying the low-pressure air test, the following factors should be
understood and precautions followed during the test. The air test is
intended to detect defects in the sewer line and establish the integrity of
the line under sewer conditions. Since the pipe will be in a moist environ-
ment when in service, testing the pipe in wet conditions is appropriate.
Plugs should be securely braced and should not be removed until all air
pressure in the test section has been reduced to ambient pressure.
For safety reasons, no one should be allowed in the trench or manhole
while the test is being conducted. The testing apparatus should be
equipped with a pressure relief device to prevent the possibility of load-
ing the test section with full compressor capacity.
11.8.3. Mandrel Testing
Sanitary sewer constructed with flexible pipe should also be required
to pass a mandrel test. The mandrel must pass through the entire section
being tested when pulled by hand without the use of excessive force. The
mandrel should be a rigidly constructed cylinder or other approved
392 GRAVITY SANITARY SEWER DESIGN AND CONSTRUCTION

shape which will not change shape or size when subjected to forces
exerted on it by the pipe wall.
The dimensions of the testing device should be based on the specified
maximum allowable deflection. Mandrel testing should not be permitted
until a minimum of 30 days after placement of the backfill. Dimensions
should be stated as a mandrel diameter equal to the nominal pipe diame-
ter minus the allowable deflection percentage and a minimum mandrel
length of not less than the nominal diameter of the pipe. This test is also
commonly referred to as a go/no-go test.
11.8.4. Televising
Sanitary sewer may also be televised as part of the acceptance proce-
dure. If televising is to be used, it is recommended a pan and tilt camera
be used. This type of camera can be stopped at the lateral connections and
turned to provide a view for a distance up the lateral.
The records should include starting manhole, ending manhole, dis-
tance along the line from the starting manhole, location of all laterals, and
notation of any areas showing leaks or standing water.
11.9. CONSTRUCTION RECORDS
In addition to the acceptance testing previously discussed, it may be
the responsibility of the engineer to record details of construction as
accomplished in the field. This data should be incorporated into a final
revision of the contract drawings to represent the most reliable record for
future use. The contractor should maintain a drawing set during con-
struction that is regularly (at least weekly) marked to record as-con-
structed changes from the design drawings, and is delivered to the engi-
neer at completion of the work.
Records should be sufficient to allow future recovery of the sewer
itself, underground structures, connections, and services. Invert eleva-
tions should be recorded for each manhole, structure connection, and
house service. In some instances, it may be advisable to set concrete refer-
ence markers flush with finished grade to facilitate future recovery. Loca-
tions and sizes of all sanitary laterals and crossings of other underground
utilities should also be included in the record drawings.
BIBLIOGRAPHY
American Concrete Pipe Association (ACPA). (2001). “Concrete pipe design man-
ual,” ACPA, Irving, Tex.
Associated General Contractors of America (AGCA). (2003). “Manual of accident
prevention for construction,” AGCA, Alexandria, Va.
CONSTRUCTION METHODS 393

American Society of Civil Engineers (ASCE). (2003). “How to work effectively
with consulting engineers: Getting the best project at the best price,” Manual
and Rep. No. 45, ASCE, Reston, Va.
American Water Works Association (AWWA). (2005). “Installation of ductile iron
water mains and their appurtenances,” Standard C-600, AWWA, Denver, Colo.
AWWA. (1995). “Concrete pressure pipe,” Manual M9, AWWA, Denver, Colo.
AWWA. (1979). “PVC Pipe—Design and installation,” Manual M23, AWWA,
Denver, Colo.
ASTM International (ASTM). (Active as of January, 2007). “Standard practice for
installing vitrified clay pipe lines,” Standard C12-03, ASTM, West Con-
shohocken, Penn.
International Society of Explosives Engineers (ISEE). (2003). “Blasters handbook,”
ISEE, Cleveland, Ohio.
National Clay Pipe Institute (NCPI). (1995). “Clay pipe engineering manual,”
NCPI, Lake Geneva, Wisc.
National Fire Protection Association (NFPA). (2001). “Explosive materials code,”
NFPA 495, NFPA, Quincy, Mass.
Uni-Bell PVC Pipe Association (Uni-Bell). (1993). “Handbook of PVC pipe—
Design and construction,” Uni-Bell, Dallas, Tex.
394 GRAVITY SANITARY SEWER DESIGN AND CONSTRUCTION

12.1. INTRODUCTION AND COMPARISON OF
TRENCHLESS TECHNOLOGY METHODS
12.1.1. Introduction
12.1.1.1. Summary of Trenchless Technology Benefits
The term trenchless technology (or No-Dig) is relatively new to the
utility industry in the United States. Although trenchless methods (albeit
not called trenchless) have been used in one form or another for a number
of years throughout the world, trenchless methods as a family of methods
have only been formally recognized in the United States since June, 1990,
when the first technical society dedicated to trenchless technology meth-
ods was formed [the North American Society for Trenchless Technology
(NASTT)].
1
Trenchless methods encompass a family of new installation
methods as well as rehabilitation methods. This chapter will focus prima-
rily on new installation methods. Other ASCE and Water Environment
Federation (WEF) manuals address trenchless rehabilitation (also known
as renewal) methods [specifically, ASCE Manual of Practice No. 62/WEF
MOP FD-6 (WEF/ASCE, 1994)].
Public and private utility agencies throughout the United States and
the world have realized the benefits of trenchless technology methods
due to their inherent advantages of minimizing project area construction
impacts to the public and the environment. Trenchless methods are less
intrusive construction methods for installing new pipes and conduits or
rehabilitating existing pipes and conduits while reducing:
• Indirect construction costs (known as social costs to third parties).
• Adverse environmental impacts and permitting concerns.
• Problems with handling and disposing of contaminated soils and
groundwater .
CHAPTER 12
TRENCHLESS DESIGN AND CONSTRUCTION
395

• Cost of utility conflicts and the resulting relocations.
• Costs for surface restoration, including pavement reconstruction.
12.1.1.2. Trenchless Technology Market Share
The primary uses of trenchless methods are for construction of new
water and wastewater pipes and rehabilitation of existing ones. These
methods are also used in other utility industries, such as the:
• Natural gas distribution market to rehabilitate existing gas pipes
and install new ones.
• Telecommunications market to install fiber-optic lines.
• Electrical distribution market to install high-voltage cables.
For new installations, the trenchless methods are used to cost-effec-
tively install new pipes:
• In urban environments.
• In environmentally sensitive areas, such as wetlands.
• In areas of contaminated soils and groundwater.
• Under existing high-traffic-volume roadways.
• Under waterways, such as rivers.
• When deep pipes are used to eliminate pump stations.
12.1.2. Two Main Divisions of Trenchless Technology Methods
There are two main divisions of trenchless methods: those for rehabili-
tation of existing underground infrastructure (including sewer pipes) and
those for new installations. ASCE Manual of Practice No. 62/WEF MOP
FD-6 identifies and reviews the various trenchless rehabilitation methods,
and is discussed herein only to distinguish the difference between trench-
less rehabilitation methods and new installation trenchless methods. The
second division of trenchless methods is for installing new pipes and con-
duits. Since ASCE Manual of Practice No. 60/WEF MOP FD-5 addresses
the design and construction of new sanitary sewers, these methods are
identified and reviewed herein.
12.1.2.1. Trenchless Installation Methods—New Pipes and Conduits
Trenchless installation methods to install new pipes and conduits are
listed and summarized in Table 12-1. A number of these methods have
manuals of practice or guidelines published by ASCE, the Gas Industry
Research Institute, the National Association of Sewer Service Companies
(NASSCO), and others. In 2005, WEF published a complete reference
guideline book (Najafi, 2005) for pipeline and utility design, construction,
396 GRAVITY SANITARY SEWER DESIGN AND CONSTRUCTION

and renewal using trenchless technology methods. Pipe bursting can be
considered trenchless construction or trenchless renewal, depending on
whether the existing pipe being burst is being upsized to increase capac-
ity, or being burst to install equivalent size pipe for rehabilitating the
existing pipe. This chapter focuses primarily on trenchless construction
methods relative to new water and wastewater piping.
12.1.2.2. Trenchless Rehabilitation Methods—Rehabilitation
of Existing Pipes and Conduits
Trenchless methods used to rehabilitate existing pipes and conduits are
listed in Table 12-2. Since this chapter is primarily about new trenchless
installation methods, Table 12-2 provides only a brief description of trench-
less rehabilitation methods. For detailed information on these methods,
see ASCE Manual of Practice No. 62/WEF MOP FD-6 (WEF/ASCE, 1994).
ASTM International has compiled standards relative to pipe materials,
rehabilitation materials, and rehabilitation methods relative to trenchless
technology methods. The compiled standards were published by ASTM
in 1999 and updated in 2006 (ASTM, 2006).
TRENCHLESS DESIGN AND CONSTRUCTION 397
TABLE 12-1. Trenchless Installation Methods—New Pipes and Conduits
Method Purpose
Microtunneling To install new pipes at precise line and grade
or below groundwater
Pipe Ramming To install new pipes under railroads and
highways where precise line and grade is
not an issue, and to install new pipes for
relatively short distances
Auger Boring To install new pipes under railroads and
highways where precise line and grade is
not an issue and for relatively short
distances when groundwater is not present
Pipe Jacking To install new large-diameter pipes
[36 inches (900 mm)] and when
groundwater is not present (control of line
and grade is difficult but not impossible)
Pipe Bursting To replace and possibly upsize an existing
pipe to increase carrying capacity
Horizontal Directional To install new pressure pipes, including
Drilling siphons (can be used to install new pipe
several thousand feet (meters), under ideal
conditions)

12.2. COSTS OF UTILITY CONSTRUCTION USING
TRENCHLESS INSTALLATION METHODS
Construction costs associated with installing utilities using trenchless
methods will vary depending on a number of factors. Generally, direct
construction costs are higher for trenchless methods than nontrenchless
methods (conventional open-trench methods) when the new utility is
installed at relatively shallow depths. However, the cost for installing
new utilities by trenchless methods at deeper depths remains relatively
constant, whereas the costs for installing new utilities by nontrenchless
398 GRAVITY SANITARY SEWER DESIGN AND CONSTRUCTION
TABLE 12-2. Trenchless Rehabilitation Methods—To Rehabilitate
Existing Pipes and Conduits
Method Purpose
Cured-in-Place To rehabilitate existing deteriorated pipe
Pipe Lining (including noncircular, asymmetrical pipes with
limitations and under specific conditions) for
improving structural integrity or increasing
capacity (flows generally need to be bypassed)
Plastic Pipe Deform To rehabilitate existing deteriorated circular pipe
and Reform [generally 18 inches (450 mm)] for improving
(Fold & Form) structural integrity (flows generally need to be
bypassed)
Sliplining—Segmental To rehabilitate existing large-diameter, circular pipe
Method [generally 24 inches (600 mm)] when flow
diversion is an issue (generally, loss of carrying
capacity occurs)
Sliplining—Continuous To rehabilitate existing circular pipe with
Method continuous pipe string, such as fused plastic
pipe when flow diversion is possible
(generally, loss of carrying capacity occurs)
Pipe Bursting To rehabilitate existing relatively small-diameter
[36 inches (900 mm)] pipe for improving
structural integrity, where increased capacity
is not an issue
Cementitous Lining To cement a line of existing water mains and
improve structural integrity of large-diameter
sewer pipes [48 inches (1,220 mm)] when
carrying capacity is not an issue (bypass
pumping of flows is generally required)
Manhole Rehabilitation To rehabilitate existing manholes to improve
structural integrity and to reduce infiltration
and inflow
Internal Spot Repairs To repair specific sections of an existing pipe from
within the pipe to repair localized structural
defects or reduce infiltration and inflow

methods (open-trench excavation) increase with depth. In addition, when
a number of other factors (e.g., environmentally sensitive areas, high traf-
fic volumes, contaminated soil and groundwater, and relocation of other
utilities is required), the construction costs associated with trenchless
methods may be more cost-effective than nontrenchless methods (con-
ventional open-trench methods) at shallower depths. See Chapter 1 of this
Manual for cost estimating and planning.
There are also a number indirect construction costs imposed on the
public in general; they are known as social costs and are discussed in
more detail in Section 12.2.2.2. Reduced social costs are a major benefit to
trenchless methods but also apply to conventional open-cut sanitary
sewer design and construction. Social costs or indirect construction costs
are associated with all construction activities on public lands and right-of-
ways. These costs are other than the costs for labor, material, and equip-
ment associated with conventional construction methods.
12.2.1. Preconstruction Design Costs
Preconstruction design costs are the costs for planning, field investiga-
tions, report preparation, final design cost, bidding costs, and administra-
tive costs associated with sewer design. In general, the preconstruction
design costs for conventional sewer installation are between 5% and 10%
of the total construction cost. However, for trenchless installation projects,
the preconstruction design costs may be as high as 10% to 15% of the total
cost. Although there may be higher preconstruction design costs, these
may be generally offset by savings in construction costs associated with
handling and disposal of contaminated soils, surface and pavement
restoration, and environmental mitigation measures. A detailed investi-
gation of site-specific conditions should be conducted prior to developing
cost estimates, to identify items that may affect the overall cost. Engineers
experienced in trenchless installation methods may prepare generalized
feasibility-level cost estimates prior to the detailed field investigation
work in order to determine the order of magnitude of the various alterna-
tives for the project funding authorities to consider.
12.2.2. Trenchless Installation Construction Costs
12.2.2.1. Direct Construction Costs
The direct construction costs for new trenchless construction methods
generally consist of the same components as other types of sewer pipe
construction methods, including costs of materials, general labor, and
equipment. However, due to the specialized nature of trenchless con-
struction methods, the costs for mobilization, specialized labor, and some
materials may be increased. There are also costs associated with pavement
TRENCHLESS DESIGN AND CONSTRUCTION 399

reconstruction, traffic control, and environmental controls, albeit not as
high as for traditional open-trench construction methods. In addition, due
to the cost of excavation and earth support requirements for conventional
open-trench excavation, the deeper a proposed pipeline is, the more cost-
effective it becomes to install it by trenchless methods.
12.2.2.2. Indirect Construction (Social) Costs
Indirect construction cost or social costs are costs borne by third parties
due to the impacts of conventional construction methods. With conven-
tional construction methods, social costs are generally not taken into con-
sideration. Trenchless construction methods generally reduce social costs
(sometimes significantly) as compared to conventional methods. These
social costs can also have political as well as economic considerations.
Social costs include:
• Vehicular traffic disruption.
• Road and pavement damage.
• Damage to adjacent utilities.
• Damage to adjacent structures.
• Noise, vibration, and air pollution.
• Pedestrian safety impacts.
• Business and trade loss.
• Damage to detour roads.
• Site safety.
• Citizen complaints.
• Environmental impacts.
12.3. DESIGN CONSIDERATIONS FOR TRENCHLESS
PIPELINE CONSTRUCTION METHODS
Chapter 2 of this Manual addresses surveys and investigations asso-
ciated with the installation of new sewers. The methods addressed in
Chapter 2 are generally for conventional methods but are also required
for trenchless methods. Trenchless methods require extensive subsurface
investigations to minimize risk associated with underground construc-
tion. This section addresses the additional investigation requirements for
installing new utilities by trenchless methods.
12.3.1. Surface Survey
Chapter 2 of this Manual identifies many of the required surface sur-
vey requirements that are also required in trenchless construction meth-
ods. See Chapter 2 for a list of the surface survey requirements.
400 GRAVITY SANITARY SEWER DESIGN AND CONSTRUCTION

12.3.2. Subsurface Investigations
12.3.2.1. Existing Utilities
Location of underground existing utilities is critical for trenchless
installation methods in order to avoid conflict between the equipment
used for the proposed trenchless installation and for installing working
excavations while minimizing required utility relocations. Appropriate
true scales showing actual widths of underground utilities should be con-
sidered. For example, at a 1 inch 40 ft scale, all pipes larger than 24 inches
(610 mm) should be shown with two lines representing the true width of
the utility.
12.3.2.2. Geotechnical Investigations
12.3.2.2.1. General Geotechnical Review
During the planning phase of a project proposing to use trenchless
methods, a review should be performed to determine the appropriate
trenchless method. Available information regarding geological subsur-
face conditions should be reviewed to determine whether the proposed
trenchless installation method is appropriate for the geological condi-
tions. In addition, areas of contaminated soils should be identified so that
appropriate handling and mitigation methods can be developed during
the final design phase. Useful existing information includes current and
historical aerial photographs, geology maps, previous project investiga-
tions in the vicinity, and land use records.
12.3.2.2.2. Geotechnical Survey
Once the review of the subsurface conditions is completed using avail-
able information and the appropriate trenchless installation method is
selected, subsurface borings should be taken at appropriate depths and
intervals, using judgment and experience to confirm or revise the prelim-
inary model developed from existing information. Laboratory and field
tests will also be needed to understand soil or rock properties and infer
their behavior. In addition, any contaminated soils and/or groundwater
should be tested to determine handling and disposal requirements, as
well as to identify which pipe material and other installation materials are
appropriate.
12.3.3. Alignment Considerations
The proposed horizontal and vertical alignments of sewers that will be
installed by trenchless methods must take into consideration the location
of and potential conflicts with existing utilities, changes in subsurface
conditions, potential obstructions (such as boulders, fill debris, structures,
TRENCHLESS DESIGN AND CONSTRUCTION 401

old piles or piers), areas of contaminated soils and groundwater, surface
traffic, entrances and exits to parking areas and loading docks, and envi-
ronmentally sensitive areas such as wetlands.
12.4. PIPE MATERIALS
This section should be reviewed in conjunction with Chapter 8, Materi-
als for Sewer Construction. Chapter 8 reviews various pipe materials such
as concrete, vitrified clay pipe (VCP), ductile iron pipe (DIP), steel pipe,
and plastic pipe. However, these pipe materials are intended for conven-
tional pipe associated with the conventional installation of new sewers.
Although some of the pipe materials identified in Chapter 8 can be used
in trenchless installation methods, Chapter 8 does not discuss details spe-
cific to pipe materials used in trenchless designs today. For example, pipe
materials such as centrifugally cast reinforced fiber-glass pipe and poly-
mer concrete pipe are much more common in trenchless construction
than in conventional construction. In addition, “conventional” materials,
such as DIP, are often modified for use in pipe jacking, pipe bursting, and
horizontal directional drilling (HDD). It should be noted that trenchless
installation methods require special pipe joints capable of handling instal-
lation stresses. These modifications may include additional reinforcing or
changes in the jointing techniques to improve their performance in
trenchless installations. See the Bibliography at the end of this chapter for
additional information on trenchless pipe materials. Engineers and own-
ers should consult special manuals, such as ASCE microtunneling con-
struction guidelines and HDD good practices guidelines, as described in
the Bibliography. Chapter 8 of this Manual should be consulted when
considering pipe material and pipe hydraulics with trenchless installa-
tion of sewers.
12.5. HORIZONTAL AUGER BORING
12.5.1. Introduction and Method Description
Horizontal auger boring (HAB), also known as jack and bore, is used to
install steel casing pipes under railroads and highways where precise line
and grade is not an issue. It is generally used to install small-diameter
[less than 60 inches (1,524 mm)] casing pipes for relatively short distances
[less than 600 ft (200 m)] when groundwater is not present. However,
HAB has been used to install casing pipes as large as 66 inches (1,676 mm)
in diameter, and bores as long as 800 ft (250 m) have been completed.
Chapter 11 of this Manual describes HAB and pipe jacking as a special
construction method which may be used for installing casing and
402 GRAVITY SANITARY SEWER DESIGN AND CONSTRUCTION

pipelines under railroads, busy highways, and environmentally sensitive
areas. These areas requiring special installation methods fall under the
umbrella of trenchless installation.
Refer to ASCE Manual and Report on Engineering Practice No. 106,
Horizontal Auger Boring Projects, for additional information on this
method. Figure 12-1 is a schematic of an HAB operation.
12.6. PIPE RAMMING
12.6.1. Introduction and Method Description
Pipe ramming is a nonsteerable, trenchless construction method for
installing steel casing, which uses pneumatic force to drive the casing
through the ground. Pipe ramming is a technique for installing casing
pipe under rail and road crossings where open excavation methods are not
feasible. It is generally limited to pipe diameters up to 60 inches (1,500 mm)
and lengths less than 200 linear ft (60 m), although a casing as large as
144 inches (3,600 mm) in diameter has been successfully installed using
pipe ramming. Although the process is not depth-limited, the majority of
work is performed in shallow ground conditions less than 20 ft (6 m)
deep. The process is generally not suitable for use in rock or soils with
large boulders or where groundwater is present. However, pipe ramming
can be successful in areas that have boulders and rock if a pneumatic
hammer is attached to leading edge of the pipe-ramming device to break
TRENCHLESS DESIGN AND CONSTRUCTION 403
FIGURE 12-1. Schematic of a horizontal auger boring operation.
Courtesy of National Utility Contractors Association, Arlington, Va.

up such obstacles. In this case, use of pipe jacks in a jacking pit should be
used to push the casing forward as the hammer excavates the rock.
This process requires entrance and receiving pits unless the pipe
grades are above the surrounding ground (e.g., a railroad embankment
crossing), and is advantageous where setup space is limited. The entrance
and receiving pits, when used, must be relatively long to accommodate
the pipe and hammer. Spoil material, captured as the pipe or casing is
advanced, is removed using screw augers, a bucket with chain, or manual
methods. Because the alignment is controlled by the drive equipment
guide rail system and that method is not steerable, installation accuracy
can vary widely. Steel casing is used for pipe ramming, and welded or
proprietary interlocking systems are used to join the steel pipe during the
installation process. Figure 12-2 illustrates a pipe ramming operation.
12.7. PIPE JACKING
12.7.1. Introduction and Method Description
Pipe jacking is a method for installing casing and/or carrier pipe by
means of jacking and advancing the pipe through the ground while earth
at the leading edge of the lead pipe (the face) is excavated by personnel or
404 GRAVITY SANITARY SEWER DESIGN AND CONSTRUCTION
FIGURE 12-2. Typical pipe ramming operation.
Courtesy of TT Technologies, Aurora, Ill., available at <www.tttechnologies.
com/products/gram/index.html>.

TRENCHLESS DESIGN AND CONSTRUCTION 405
FIGURE 12-3. A pipe jacking operation.
Courtesy of Akkerman, Brownsdale, Minn., available at <www.akkerman.
com/nav.php?linkproducts>.
personnel-controlled excavating tools at the face. Pipe jacking requires
man-entry-sized pipe to allow personnel access to the face, and sufficient
space for removal of the excavated material; this is typically accomplished
with track-mounted muck skips and winches. Figure 12-3 illustrates a
pipe jacking operation.

12.7.2. Main Features and Application Range
12.7.2.1. Pipe Diameter Range
The pipe diameters used in pipe jacking generally range from 48 inches
to 144 inches (1,200 mm to 3,600 mm). With pipe diameters larger than
144 inches (3,600 mm), the method is considered to be utility tunneling.
Pipe jacking is different from tunneling in that tunneling uses temporary
supports and jacks are not required in shaft. If a pipe is being pushed
through the soil formation from a common starting point (a jacking pit)
and excavation at the face and removal of the spoil is not remotely con-
trolled, it is pipe jacking, regardless of pipe diameter.
12.7.2.2. Drive Length
Maximum drive lengths are influenced by ground conditions, avail-
able jacking thrust, pipe type, and pipe joint configuration, as well as
available shaft locations and required manhole spacing. Intermediate
jacking stations (IJSs) and lubricants may be used to increase drive lengths.
Single-span drives of more than 3,000 ft (900 m) have been achieved using
these methods, but drives of less than 700 ft (210 m) are more typical.
12.7.2.3. Type of Casing
Casing pipes can consist of steel pipe, Portland cement concrete pipe,
polymer mortar concrete pipe, or centrifugally cast fiberglass reinforced
polymer mortar pipe; however, steel casing is typical. These pipe materi-
als can also be used as carrier pipes and can be directly jacked into place if
the medium being transported in the carrier pipe is compatible with the
pipe material.
12.7.2.4. Required Working Space
Jacking operations will generally occur from one confined location.
Jacking shaft sizes are dependent on the length and diameter of the indi-
vidual pipe segments and the size of the pipe jacking system. In addition,
support equipment on the surface occupies additional space within the
work zone. The surface support equipment generally consists of pipe lay-
down areas, hydraulic power packs for the pipe jacking system, a crane for
lowering pipe into the jacking shaft and removal of excavated earth, and a
spoils handling area.
12.7.2.5. Productivity
Productivity rates will depend on availability of skilled labor and the
ground conditions. With mechanized earth excavating equipment at the
face and efficient spoils removal and disposal, productivity rates of up to
406 GRAVITY SANITARY SEWER DESIGN AND CONSTRUCTION

150 linear ft (45 m) per work shift can be achieved. Even in more difficult
conditions, productivity rates of 45 to 75 linear ft per day (15 to 25 m per
day) are common. However, with diameters less than about 7 ft (2 m),
productivity can be significantly limited (especially on relatively long
drives) because of the small-capacity mucking carts that must be used.
Shift production rates as low as 20 linear ft (6 m) per day are not unusual
for pipe diameters less than 60 inches (1,500 mm) and drive lengths longer
than 700 linear ft (210 m).
12.7.2.6. Major Advantages
The major advantage of installing pipe by pipe jacking is the ability to
install sewer pipe under active railroad lines or very busy roadways with
limited impacts to the railroad lines or roadways.
12.7.2.7. Major Limitations
Because of the open-face nature of the earth excavating method,
groundwater control can be a significant issue. Therefore, pipe jacking
generally is appropriate only above groundwater levels. In addition,
achieving precise line and grade may be difficult but can be accomplished
with skilled contractors experienced in the site-specific ground conditions.
12.8. HORIZONTAL DIRECTIONAL DRILLING
12.8.1. Introduction and Background
Horizontal directional drilling (HDD) is a trenchless method originally
developed in the 1970s for the oil and gas industry. HDD was further
developed in the 1980s as a result of research and development by the nat-
ural gas and electric power industries. HDD is generally used for installing
cables and pressure pipe, such as water mains and force mains, under
roadways, railroads, waterways, and environmentally sensitive areas. In
recent years, HDD has been used on a limited basis for installing gravity
sewers if the grade is steep enough to overcome this method’s inherent
lack of precise line and grade control.
12.8.2. Method Description
The HDD process uses a hydraulic drilling machine and a series of
threaded drill pipes with a steerable head to establish a small pilot bore-
hole along the desired pipeline alignment. Aboveground tracking sys-
tems and monitoring transmitting devices in the steering head can be
used to control the alignment. The pilot borehole is then enlarged to
accommodate the host pipe by back-reaming with increasingly larger
reaming tools. Finally, the host pipe is pulled back through the finished
TRENCHLESS DESIGN AND CONSTRUCTION 407

borehole using the HDD machine. Because of its installation length capa-
bilities, HDD has become a common method for river crossings. Pipe
diameters up to 60 inches (1,500 mm) and installed lengths of more than a
mile (1.5 km) have been successfully completed. HDD can be used in a
wide variety of soil and rock conditions.
Small HDD equipment requires very little space for setup and the
process generally requires only small entry or exit pits, but layout space
for the total length of host pipe to be pulled back can be a constraint.
High-density polyethylene (HDPE) and steel pipe are the most common
pipe materials used. Fusible and segmented polyvinyl chloride (PVC)
pipe and restrained-joint DIP have also been used in some applications. In
addition, fiberglass pipe has also been used recently. Drilling fluid is
pumped into the borehole to stabilize the bore, cool the drilling tools and
transmitter, transport cuttings, and reduce friction forces during pull-
back. Grout may be injected after completion of the bore to attempt to
fill the annular space between the host pipe and borehole. The potential
for “frac-outs” (uncontrolled leakage of the drilling muds) should be
addressed as a part of a comprehensive surface spill and frac-out contin-
gency plan. Figure 12-4 presents an HDD rig.
408 GRAVITY SANITARY SEWER DESIGN AND CONSTRUCTION
FIGURE 12-4. A horizontal directional drilling rig.
Courtesy of Vermeer Manufacturing, Pella, Iowa, available at <www.
vermeer.com/vcom/trenchlessequipment/trenchless-equipment.htm>.
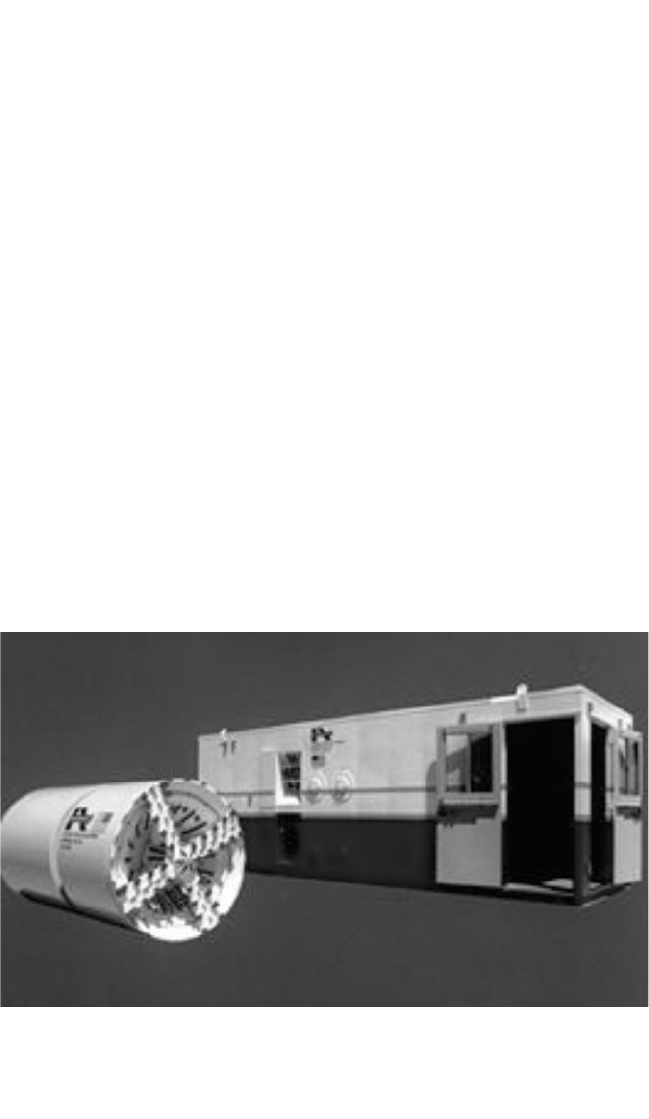
12.9. MICROTUNNELING
12.9.1. Introduction
ASCE published its Standard Construction Guidelines for Microtunnel-
ing (CI/ASCE 36-01) in 2001. This manual defines the method, pipe mate-
rials, and other pertinent information necessary for installing pipe by the
microtunneling method. This microtunneling guideline should be con-
sulted when planning, designing, and constructing sewer pipe by micro-
tunnelling. Figure 12-5 illustrates a microtunnel boring machine (MTBM).
12.9.2. Method Description
Microtunneling is defined as a trenchless method for installing pipe-
lines. It uses a remote-controlled, guided self-excavating boring machine
that provides continuous support at the face while the casing or carrier
pipe is jacked in behind the boring machine. Figure 12-6 presents a
schematic of a microtunneling operation. The difference between micro-
tunneling and the pipe jacking method is that microtunneling is remote-
controlled excavation at the face of the machine and remote-controlled
removal of the excavated material from the face to the surface, whereas
pipe jacking is controlled from the jacking pit, with no directional control
of the actual cutting head.
TRENCHLESS DESIGN AND CONSTRUCTION 409
FIGURE 12-5. A microtunnel boring machine.
Courtesy of Akkerman, Brownsdale, Minn., available at <www.akker-
man.com/nav.php?linkproducts>.

12.9.3. Main Features and Application Range
12.9.3.1. Diameter Range
Pipes installed by microtunneling range in size from 10 inches to 144
inches (300 mm to 3,600 mm) in diameter. It should be noted that the
European definition of microtunneling is generally 36 inches (914 mm) or
less in diameter, or non-man entry.
12.9.3.2. Drive Length
The drive lengths are dependent on the ground conditions, available
jacking thrust, pipe type, pipe joint configuration, and the excavated
material removal system. The use of IJSs and/or lubricants to reduce pipe
friction will increase pipe drive lengths.
12.9.3.3. Required Working Space
Microtunneling operations will generally occur from one confined
location. Jacking shaft sizes are dependent on the length of the individual
pipe segments and the size of the pipe jacking system. In addition, sup-
port equipment on the surface occupies additional space within the work
zone. The surface support equipment generally consists of pipe lay-down
areas, hydraulic power packs for the pipe jacking system, a crane for
410 GRAVITY SANITARY SEWER DESIGN AND CONSTRUCTION
FIGURE 12-6. Schematic of a microtunneling operation.
Courtesy of National Utility Contractors Association, Arlington, Va.

lowering pipe into the jacking shaft, a spoils handling area, and a micro-
tunneling machine control unit. An additional shaft at the opposite end of
the microtunnel drive is required for retrieval and removal of the boring
machine when microtunnel operations are completed. The work zone for
this area needs only to be of sufficient size for a crane and shaft to remove
the machine.
12.9.3.4. Major Advantage
Microtunneling can be accomplished to accurate line and grade, and
below groundwater.
12.9.3.5. Major Limitations
Microtunneling, because of its sophistication, is relatively expensive
compared to other trenchless installation methods. In addition, mixed
ground conditions can be problematic and can increase risk of failure dur-
ing the installation of the pipe.
12.10. PILOT-TUBE MICROTUNNELING
Pilot-tube microtunneling (PTMT) is an alternative to conventional
microtunneling. PTMT combines the accuracy of microtunneling, the
steering mechanism of a directional drill, and the spoil removal system of
an auger boring machine. PTMT employs an auger and a guidance system,
using a camera-mounted theodolite and target with electric light-emitting
diodes (LEDs) to secure high accuracy in line and grade. Typically, accu-
racy will be on the order of 1 inch (2.5 cm). When conditions are favor-
able, PTMT can be a cost-effective tool for the installation of small-diameter
pipes of sewer lines or water lines. This technique can also be used for
house connections, direct from the main-line sewers. Typically, pilot-tube
machines can be used in soft soils and at relatively shallow depths. PTMT
is typically used for 6- to 10-inch (150- to 250-mm) pipe, typical of small-
diameter gravity sewers. Jacking distances are typically limited to 300 ft
(90 m) or less, although this distance has been increasing. Pipe for sanitary
sewer microtunneling is typically fiberglass, vitrified clay, or ductile iron.
Figure 12-7 illustrates the three phases of PTMT.
12.11. PIPE BURSTING METHOD
Pipe bursting is a method whereby an existing pipe is replaced in-place
by means of inserting a tool of slightly larger diameter than the inside
diameter of the existing pipe and forcing the tool through the pipe, thus
fracturing the existing pipe and pushing the fractured pieces out into the
TRENCHLESS DESIGN AND CONSTRUCTION 411

surrounding soil. As the tool is advanced through the existing pipe, a
replacement pipe is pulled or pushed behind the tool, filling the void left
by the former existing pipe with a new pipe. As of this writing, ASCE has
a forthcoming Manual of Practice on pipe bursting. This new manual
should be referred to when planning, designing, and installing replace-
ment pipe by the pipe bursting method (ASCE 2007). Generally speaking,
when the existing pipe is upsized due to capacity requirements, pipe
bursting is considered to be a new installation. However, when pipe
bursting is used to replace an existing pipe due to rehabilitation require-
ments, it is considered rehabilitation. Figure 12-8 presents some pipe
bursting equipment.
412 GRAVITY SANITARY SEWER DESIGN AND CONSTRUCTION
FIGURE 12-7. The three phases of pilot-tube microtunneling.
Courtesy of Wirth Soltau, Mount Pleasant, S.C., available at
<www.microtunneling.com/soltau/rvs80.htm>.

NOTE
1. North American Society for Trenchless Technology (NASTT). Infor-
mation available at <www.nastt.org>, accessed March 20, 2007.
BIBLIOGRAPHY
American Society of Civil Engineers (ASCE). (2007). “Pipe bursting projects,”
ASCE Manuals and Reports on Engineering Practice No. 112, ASCE, Reston, Va.
ASCE. (2004). “Horizontal auger boring projects,” ASCE Manuals and Reports on
Engineering Practice No. 106, ASCE, Reston, Va.
ASCE. (2001). “Standard construction guidelines for microtunneling,” CI/ASCE
Standard 36-01, ASCE, Reston, Va.
ASTM, International. (2006). “ASTM Standards Related to Trenchless Technol-
ogy,” ASTM International, West Conshohocken, PA.
Kramer, S. R., W. J. McDonald, and J. C. Thomson. (1992). “An introduction to
trenchless technology,” Van Nostrand Reinhold, New York, N.Y.
Najafi, M. (2005). “Trenchless technology: Pipeline and utility design, construc-
tion and renewal,” McGraw-Hill, New York, N.Y.
TRENCHLESS DESIGN AND CONSTRUCTION 413
FIGURE 12-8. Pipe bursting equipment.
Courtesy of TT Technologies, Aurora, Ill., available at <www.tttechnolo-
gies.com/products/pipeburst/index.html>.

National Association of Sewer Service Companies (NASSCO). (1996). “Manual of
practices—Wastewater collection systems,” second ed., NAASCO, Maitland, Fla.
North American Society for Trenchless Technology (NASTT). (2005). “Pipe bursting
guidelines,” Tech. Rep. No. 2001.02, Trenchless Technology Center, Louisiana
Technological University, Ruston, La.
NASTT. (2004). “Guidelines for directional drilling projects: HDD good practices
guidelines,” North American Society for Trenchless Technology, Ruston, La.
Trenchless Technology Center. (2001). “Guidelines for pipe ramming,” Tech. Rep.
No. 2001.04, Trenchless Technology Center, Louisiana Technological Univer-
sity, Ruston, La. Available at www.ttc.latech.edu/publications/guidelines_
pb_im_pr/ramming.pdf, accessed March 20, 2007.
Joint Task Force of the Water Environment Federation and the American Society
of Civil Engineers (WEF/ASCE). (1994). “Existing sewer evaluation and reha-
bilitation,” second ed., ASCE Manuals and Reports on Engineering Practice
No. 62, ASCE, Reston, Va.
414 GRAVITY SANITARY SEWER DESIGN AND CONSTRUCTION

A
Above-ground sewers, 210–211
Acrylonitrile-butadiene-styrene (ABS), in
flexible pipe, 224, 228–230, 299
Ad valorem taxes, 14–15
Aircraft loads, 273–274f, 273–275
Air pollution, during sewer construction, 369
Alignment considerations, trenchless
construction, 401–402
Alternate depths, 118–121
American Association of State Highway
and Transportation Officials
(AASHTO), 270, 270f
Appalachian Regional Commission
(ARC), 12
Aqueous hydrogen sulfide, 85–86
Average flows, 45–47, 46–47t
B
Backfilling
initial and final, 336–337
methods, 384–386
sequence, 385–386
Base units, 23
Bedding and backfilling, 332–337, 333f
Bedding factor, 285–286, 285–287t
Bends, 199–200, 199f
Biochemical oxygen demand (BOD), 76–77
Bisulfide ion, 85
Bubble tube, 220
Building drain, 2
Building sewer, 2
Business and trade loss, during sewer
construction, 370
C
Capacity, management, operation, and
maintenance (CMOM), 2, 11, 19–20
Capacity design, 142
Capital improvement plan (CIP), 35
Cast-in-place liners, 104–106, 105f
Cementitious materials, corrosion, 94
Cement mortar pipe joint, 236
Channel and bench, 197
Check valves, 204–207
Chemical corrosion control, 98–99
Circular conduit geometry, 121f
CIRIA study, 159–161, 160f
Citizen complaints, during sewer
construction, 370
Clean Water Act (CSA), 1–2, 12
Coastal Plains Regional Commission
(CPRC), 12
Coated corrugated metal pipe (CMP), 300
Coatings, corrosion control, 99–100
Combination taxes and service charges, 15–16
Combined sewer, 2
overflows (CSOs), 166
Compaction, 384–385
Composite pipe, 299
Concentrated loads, 266–267, 266f
Concrete arch, 293
Concrete corrosion, 89–93, 90f
INDEX
415
Pages followed by f indicate figures.
Pages followed by t indicate tables.

Concrete cradle, 292–294, 292f
Concrete pipe, 224–226
direct design, 277–283, 278f, 279t, 280f,
281t, 282f, 283t
Conduit types, 177
Conjugate depths, 122
Connection charges, 15
Construction contract documents, 341–366
Construction loads, 275
Construction materials, 223–238
Construction phase
methods, 367–394
project development, 6
role of engineer and contractor, 10
safety factors, 17
special areas, 387–391
survey, 32
Construction records, 393–394
Construction surveys, 370–373, 372t
Continuity principle, 117
Contract drawings, 343–352, 348f, 350f
Contracting requirements, in project
manual, 358–359
Contractor, sanitary sewer projects, 8–9
Control point (CP), 155
Conventional tunnel design, 183
Corrosion, 63–111
electrochemical, 69–74
history, 63–64
inert materials, 110–111
microbiologically induced processes,
83–95
nonbiological processes, 66–83
prediction models, 95–98
processes, 88–95
sources of, 64–66, 65f
Corrugated steel pipe, 234
Costs
design, 368, 399
direct construction, 368, 399–400
indirect construction, 368–370, 400
trenchless installation methods, 398–400
Critical depth, 118–121
Critical stress, 156, 159, 159t
Critical velocity, 156, 159
Crown corrosion, 93–94, 93f
Curved sanitary sewers, 170–177
D
Darcy-Weisbach equation, 126–129
Manning n values from, 132–133, 132f
Deflected straight sewer pipe, 170–174,
171–172f
Department of Housing and Urban
Development (HUD), 12
Depth head, 117–118
Derived units, 23
Design computations, hydraulics, 142–152
Design maximum or minimum flow, 116
Design phase
direct and indirect design, 276
for various conditions, 183–185
land use and/or employee forecasts,
41–42, 43t
layout of system, 167–169
organization of computation, 185–188,
186–187
project development, 5–6
role of owner and engineer, 10
safety factors, 16–17
sanitary sewer systems, 165–189
survey, 31–32
trenchless pipeline construction,
400–402
wastewater quantity, 38–39
Detour road damage, during sewer
construction, 370
Developmental informations, 27, 29
Dewatering, 380–381
Directional drilling design, 183
Dissolved sulfide generation, 83–87
Distributed loads, 267–270, 268t, 269f
Drawings, contract, 343–352, 348f, 350f
Drop manholes, 201–202, 201f
Duckbill valves, 210
Ductile iron pipe (DIP), 227–228, 299,
325–329
allowance for casting tolerance, 328, 328t
deflection analysis, 327–328
design aids, 328–329
standard laying conditions, 325, 326f
stress design, 326–327
trenchless construction, 402
Dwelling unit (DU), 40–41
E
Earth loads, 240–241, 241f
Economic Development Administration
(EDA), 12
Effective absolute roughness, 127
Elastomeric sealing compound pipe
joints, 236
416 INDEX

Electrochemical corrosion, 69–74
controls, 73–74
Elevation head, 117–118
Employee forecasts, nonresidential
wastewater flow, 41–42
Energy concepts, design of sewer systems,
166
Energy line (total head), 117–118
Energy losses, 123
equations, 124–133
Energy principle, 117–118, 118f
Engineer, sanitary sewer projects, 8
Environmental impact, sewer
construction, 370
Environmental Impact Statement (EIS), 18
Environmental Protection Agency (EPA), 2
Erosion, 80–83
controls, 82–83, 82f
debris, 81–82
water, 80–81, 81f
Excavation, 374–378
Exposed sewers, 184
External surface oxidation, 64–66, 65f
Extra care values, 134, 134t
Extreme flows, 55–58f
F
Farmers Home Administration (FmHA), 12
Federal assistance, 12
Fiberglass-reinforced plastic pipe (FRP),
194, 299–300
Field procedures, installation, 329–330
Financial consultant, in sanitary sewer
projects, 9
Financial information, 28, 30
Finding of No Significant Impact
(FONSI), 18
Fixture units, 56–60
Flap gates, 210
Flexible pipe, 174–177, 174f, 176f, 227–234
bedding constant, 303t
loads, 304
soil classification, 303t
structural design, 299–329
structural requirements, 239
Float well, 219
Floor-to-area ratios (FARs), 41
Flow monitoring, 48–50
Flow resistance, 123–134
Fluid flow, equations for, 116–123
Force main, 2
Forecasting procedures
population or dwelling unit, 39–41
uncertainty in, 60–61
wastewater quantity, 35–38, 36t
Foundations, 334–335, 381–382
conditions, 184
Froude number, 120
Future development, quantity of
wastewater, 35
G
Galvanic corrosion, 70–71, 71t
Gasket pipe joints, 235–236
General obligation bonds, 13
Government Accounting Standards Board
(GASB), 2, 11, 20
Gradually varied flow, 154
H
Haunching, 335–336
Hazen-Williams equation, 129–130, 130f
Heat fusion pipe joints, 236–237
High-pH discharge, 74–75, 75f
High sulfate, 78, 78f
groundwater, 80
High sulfide, 76
High-temperature discharges, 77, 77f
Highway truck loads, 270–272, 270f,
271f, 272t
Horizontal auger boring (HAB), trenchless
construction, 402–403, 403f
Horizontal directional drilling (HDD), 259
trenchless construction, 402, 407–408,
408f
House connection, 2
Hunter, Roy, 56–60
Hydraulic jump, 122, 122f
Hydraulic radius, 123
Hydraulic roughness, 127
Hydraulics, 113–163
continuity through manholes, 152–153,
152f
design computations, 142–152
principles, 116–123
terminology and symbols, 114–116
Hydrogen sulfide, 86–87, 86f
concrete corrosion, 89–93
gas concentrations, 94–95
release, 87–88
INDEX 417

I
Industrial discharges, 74–80
chemical, 74–76
controls, 79–80, 79f
microbiologically induced corrosion-
enhancing, 76–79
Industrial wastewater, 47–48
Inert materials, corrosion resistance, 110–111
Infiltration/exfiltration, low-pressure air
testing and, 180–182, 182t, 392–393
Infiltration/inflow, 35, 50–51
allowances for various agencies, 52t
design of systems, 179–180
forecasting procedures, 36t
Installation, 329–337
Intercepting sewer, 2–3
Investigations, 32–33
Investigative phase
for safety, 16
preliminary survey, 30–31
project development, 4–5
role of owner and engineer, 10
J
Junctions and diversions, 200–201
L
Land use and/or employee forecasts,
41–42, 43t
Lateral sewer, 3
Legal counsel, in sanitary sewer projects, 9
Liners
cast-in-place, 104–106, 105f
chemically attached, 106–108, 107f
corrosion control, 100–110
mechanically attached, 108–110, 109f
rehabilitation versus new construction,
102
selecting and designing systems, 102–104
types available, 104–110
Live loads and minimum cover, 265–276, 266f
general pressure distribution, 266–276
Loading conditions, 242–244, 243f
Load-producing forces, 265
Local funding, 13–16
Low-pH discharge, 74
Low-pressure testing, infiltration/
exfiltration, 180–182, 182t
M
Main sewer, 3
Mandrel testing, 393
Manholes
channel and bench, 197
connection to sewer, 196, 196f
construction material, 194
frame and cover, 194–195
general shape and dimensions, 192, 193f
head loss in, 153–154
hydraulic continuity through, 152–153,
152f
large sewers, 198, 198f
objectives, 191
shallow, 192
spacing and location, 192
steps, 196–197
Manning equation, 124–126, 124t, 126f
n recommended values, 133–134, 134t
n values from Darcy-Weisbach equation,
132–133, 132f
n with partial flow depths, 133
Marston’s formula, 260–263, 261t
Marston-Spangler load analysis, 241–265
Marston-Spangler supporting strength
calculations, 290
Mastic pipe joints, 237
Measurement units, 21–23
Mechanical compression pipe joint, 235–236
Metals corrosion, 88–89
Microtunneling design, 183, 259
pilot-tube (see Pilot-tube microtunneling)
trenchless construction, 409–410f, 409–411
Momentum equation, 121–123
Moody diagram, 128f
N
National Environmental Policy Act of 1969
(NEPA), 18–19
National Pollutant Discharge Elimination
System (NPDES), 2
Negative-projecting embankment and
induced trench conditions, 254–257,
255f, 256f, 258f
No dig. see Trenchless installation
Nonresidential wastewater flow, 35
average daily flows, 47t
forecasting procedures, 36
t
land use and/or employee forecasts,
41–42, 43t
418 INDEX

O
Occupational Safety and Health Act of
1970, 16
Occupational Safety and Health
Administration (OSHA), 4, 16–17, 87,
248, 331–332
Ocean outfalls, 211–213
Open-channel flow, 116
Open cut design, 183
Open-trench construction, 373–387
Operation phase
project development and, 6
role of owner, engineer and
contractor, 10
safety factors, 17
Organization of computations, 185–188,
186–187
Outfalls, 211–213
Outfall structures, 3
ocean, 389–391, 390f
riverbank construction, 388–389
Owner, sanitary sewer projects, 7–8
Oxidation, 66–69, 68f, 69f
Oxygen concentration cell corrosion, 70
P
Palmer-Bowlus flume, 216f, 217
Partial depth calculations, 130–131
Partial flow depths, variation in Manning n,
133
Particle size, appropriate design, 140–141
Pay-as-you-go financing, 14
Peak and minimum flows, 51–60
Peak factors, 53–56, 54t
Pedestrian safety, during sewer
construction, 369
Physical information, 26–27, 28
Pilot-tube microtunneling, trenchless
construction, 411, 412f
Pipe bursting method, trenchless
construction, 411–412, 412f
Pipe handling, 383
Pipe jacking, trenchless construction,
404–407, 405f
Pipe joints, 235–237
Pipe manufacturers, in sanitary sewer
projects, 9
Pipe materials, trenchless construction, 402
Pipe placement, 383
Pipe quality, 382
Pipe ramming, trenchless construction,
403–404, 404f
Political information, 27, 29
Polyethylene (PE)
flexible pipe, 299
in flexible pipe, 224, 230–231
liners for corrosion control, 100
wrapping, 5
Polypropylene, liners for corrosion
control, 101
Polyvinyl chloride (PVC)
flexible pipe, 224, 231–232, 299
liners for corrosion control, 100
Population or dwelling unit forecast,
39–41, 41t
Positive-projecting embankment
conditions, 250–254, 251f, 252f, 254t
Pressure flow, 116
Principal traffic arteries, construction,
387–388
Procurement requirements, in project
manual, 355–358, 362–363
Project acceptance, 391–393
Project costs, 368–370
Project development
interrelations of development phases,
6–7
phases, 4–6
surveys for different phases, 30
Project manual, 353–365
Push-on pipe joint, 235
R
Radius sewer pipe, 173f
Railroad crossings, construction, 387
Railroad loads, 272–273, 273f
Rapidly varied flow, 154
Redevelopment, quantity of wastewater, 35
Regulatory agencies, in sanitary sewer
projects, 9
Reinforced plastic mortar pipe (RPM), 224,
232–233, 300
Reinforced thermosetting resin (RTR)
(fiberglass), 224, 233–234, 312–323
axial loads, 323
bending stress and strain, 314–315,
314–315t
buckling, 321–323
constrained soil modulus, 317–319,
318–320t
deflection, 316–317
INDEX 419

Reinforced thermosetting resin (continued)
hydrostatic design basis for stress/strain,
319–320
internal pressure, 313–314
special considerations, 323
stiffness, 317
working pressure, 314
Relief overflows, 204–207
Relief sewers, 3, 185
Residential wastewater flow, 35
average daily flows, 46t
as a percentage of total annual water
use, 44t
forecasting procedures, 36t
population or dwelling unit forecast,
39–41, 41t
Revenue bonds, 13–14
Revenue programs and rate setting, 14
Reverse osmosis (RO) water, 75–76
Right of way
layout of system and, 167–169
project development and, 7
Rigid pipe
classes of bedding and bedding factors,
292–294, 292f
design relationships, 290–291
encased pipe, 294–295, 295f
field strengths in embankments, 296
in curved sewers, 170–174, 171–172f
materials, 224–227
negative-projecting, 299
positive-projecting, 296–299, 297f
strength and safety factors, 288–290, 288f
structural design, 277–299
structural requirements, 239
Road and pavement damage, during sewer
construction, 369
Rock removal, 374–375
Rock trenches, 184, 375
Rust, 64–66, 65f
S
Safety, 16–17
Sanitary information, 27, 29
Sanitary Sewer Evaluation Survey (SSES),
EPA, 16
Sanitary Sewer Overflow Rule, 1
Sanitary sewer overflow (SSO), 2, 11
Sanitary sewers, 3
above-ground, 210–211
analysis/design software, 156, 157–158t
appurtenances and special structures,
191–221
combined versus separate, 166
conduit types, 177
control of use, 10–12
curved, 170–177
definition of terms and classification,
2–5
depth, 177–178
design for various conditions, 183–185
design of, 165–189
direct design and indirect design, 276
flow velocities and design depths of
flow, 178–179
hydraulics of, 113–163
live loads and minimum cover, 265–276,
266f
load caused by gravity earth forces,
240–265
materials for construction, 223–238
organization and administration, 1–23
parties involved in design and
construction, 7–9
self-cleansing, 134–141
structural requirements, 239–339
ventilation, 177
Sealing band joints, 237
Seawater, 78–79
Sediment characteristics, 135t
Sediment transport capacity, tractive forces
required, 139–140
Self-cleansing, 134–141
design, 142–151, 143–147f
recommended minimum sewer slopes,
137t, 143, 148–149t
tractive force approach, 139
traditional approach, 135–138
UK approach to sewer design, 159–161,
160f
Separate sewer, 3
Sequent depth, 122
Service charges, 15
Service laterals, 203–204, 204f, 205–206f
Service lateral slopes, 155–156
Sewer appurtenances, 391
Sewer pipe materials, 224–234
in tunnel, 261f, 262f
Sheeting and bracing, 378–380, 379–380f
Siphons, 207–210
air-jumpers, 209
profile, 208–209
420 INDEX

single- and multiple barrel, 208
sulfide generation, 209–210
Site preparation, for sewer construction, 373
Site safety, during sewer construction, 370
Slopes
embankment surfaces, 257–259
steep, 185
Soil corrosion, 72–73
Soil loads, 246f
Solids, classification, 134–135
Solvent cement pipe joints, 236
Solvents, 76
Spatially varied flow, 116
Special assessment bonds, 13
Specifications, in project manual, 360–361
Specific energy, 118–121, 119f
Standard Installation Direct Design (SIDD),
276–285
Standard Installations Indirect Design,
283–290
State assistance, 13
Steady flow, one-dimensional, 116–117
Steel pipe, 224
trenchless construction, 402
Steep slopes, 185
Storm drain, 3
Storm sewer, 3
Stray current corrosion, 71–72
Stream and river crossings, construction, 388
Streamlined weir, 217–219, 219f
Stripping, 374
Structure damage, during sewer
construction, 369
Subcritical flow, 119
Substandard values, 134, 134t
Subsurface investigations, trenchless
construction, 401
Subtrenches, 249f
Sulfide
corrosion control, 98–111
dissolved generation, 83–87
generation in sewers, 84f, 85f
high, 78, 78f
Sulfide ion, 85
Sulfuric acid
biological generation, 88
concrete corrosion, 89–93
Supercritical flow, 120
Supplementary units, 23
Surface restoration, 386–387
Surface survey, 400
Surveys and investigations, 25–34
sources of information, 28–30
types of information, 26–27
T
Televising, 393
Terminal cleanouts, 202–203, 202f
Thermoplastic pipe, 224, 228, 304–311, 306t
deflection, 307–308
hydrostatic buckling, 309, 311
mechanical properties for design, 310t
ring buckling, 309
stiffness, 306–307
wall strain cracking, 311
wall stress, 308–309
Thermoset plastic pipe, 232–234
Thiobacillus, concrete corrosion and, 90
Time-pressure testing method, 181
Total head (energy line), 117–118
Tractive force equation, 123
Tractive forces
alternate procedure, 148–151
observations on relationships, 151–152
sediment transport capacity, 139–140
self-cleansing, 139
Trench boxes, 331
Trench conditions, 244–250, 246f, 250f
Trench dimensions, 373–374
Trenching, 376–378, 377f, 377t
Trenchless installation, 259–265
costs of utility construction, 398–400
design considerations, 400–402
new pipes and conduits, 396–397
rehabilitation of existing pipes and
conduits, 397, 398t
technology methods, 395–398, 398t
Trench sheeting, 330–331
Trunk sewer, 3
Tunnels
excessive excavation, 264
load-producing forces, 265
loads for, 264
soil characteristics, 261t, 263
Typical values, 134, 134t
U
Underwater sewers, 211–213
Uniform Plumbing Code (UPC), 59
Unit flows, 42–45, 46–47t
INDEX 421

Unsteady flow, 116
Utility damage, during sewer construction,
369
V
Vehicular traffic disruption, during sewer
construction, 368
Velocity head, 117–118
Ventilation, 177
Vitrified clay pipe (VCP), 226–227
trenchless construction, 402
W
Wastewater quantity, 35–62
Wastewater (Waste water), 3
corrosion in collection systems, 63–111
measuring flows, 213–220, 215f, 216f
Water Pollution Control Act of 1972, 12
Water Pollution Control Federation (WPCF
1975), 12
Water surface profiles, 154–155
Waterway, sewer construction crossing,
388, 389f
422 INDEX
