
DataAnalyticsTutorial:
TransactionAnalysisUsing
ExcelPivotTablesandCharts
CityofSomerville,MAdataset
Welcometothedataanalyticstutorialcoveringtransactionanalysisusingpivottablesand
chartsinExcel.
1

CityofSomerville,MAdataset
• Usingreal‐lifecheckbookdatafromCityof
Somerville,MA,for2013– 2016
• Inthistutorial,weareusingasmall,22‐
recorddataset
• Fortheactualactivity,youwillbeusingthe
fulldatasetsoanswerswillbedifferentbut
theprocesswillbesimilar
Inthisactivity,weareusingthereal‐lifecheckbookdatafromtheCityofSomerville,
Massachusetts,for2013– 2016.Forthistutorialonly,weareusingasmall,22‐recorddata
set.Fortheactualactivity,youwillbeusingthefulldatasetsoyouranswersfortheactivity
requirementswillbedifferent– buttheprocesswillbesimilar.
2

Pivottablesandpivotcharts
• UsingOffice365ExcelinWindowsinthis
tutorial
• OtherversionsofExcelmaybeslightly
different
• Maybemanywaysofaccomplishingthe
samething– justpresentingonewayhere
Forthistutorialonpivottablesandpivotcharts,wewillbedemonstratingusingOffice365
ExcelforWindows.OtherversionsofExcelmaybeslightlydifferent.Alsonotethatthere
maybemanywaysofaccomplishingthesamething– wearejustpresentingonewayhere.
3

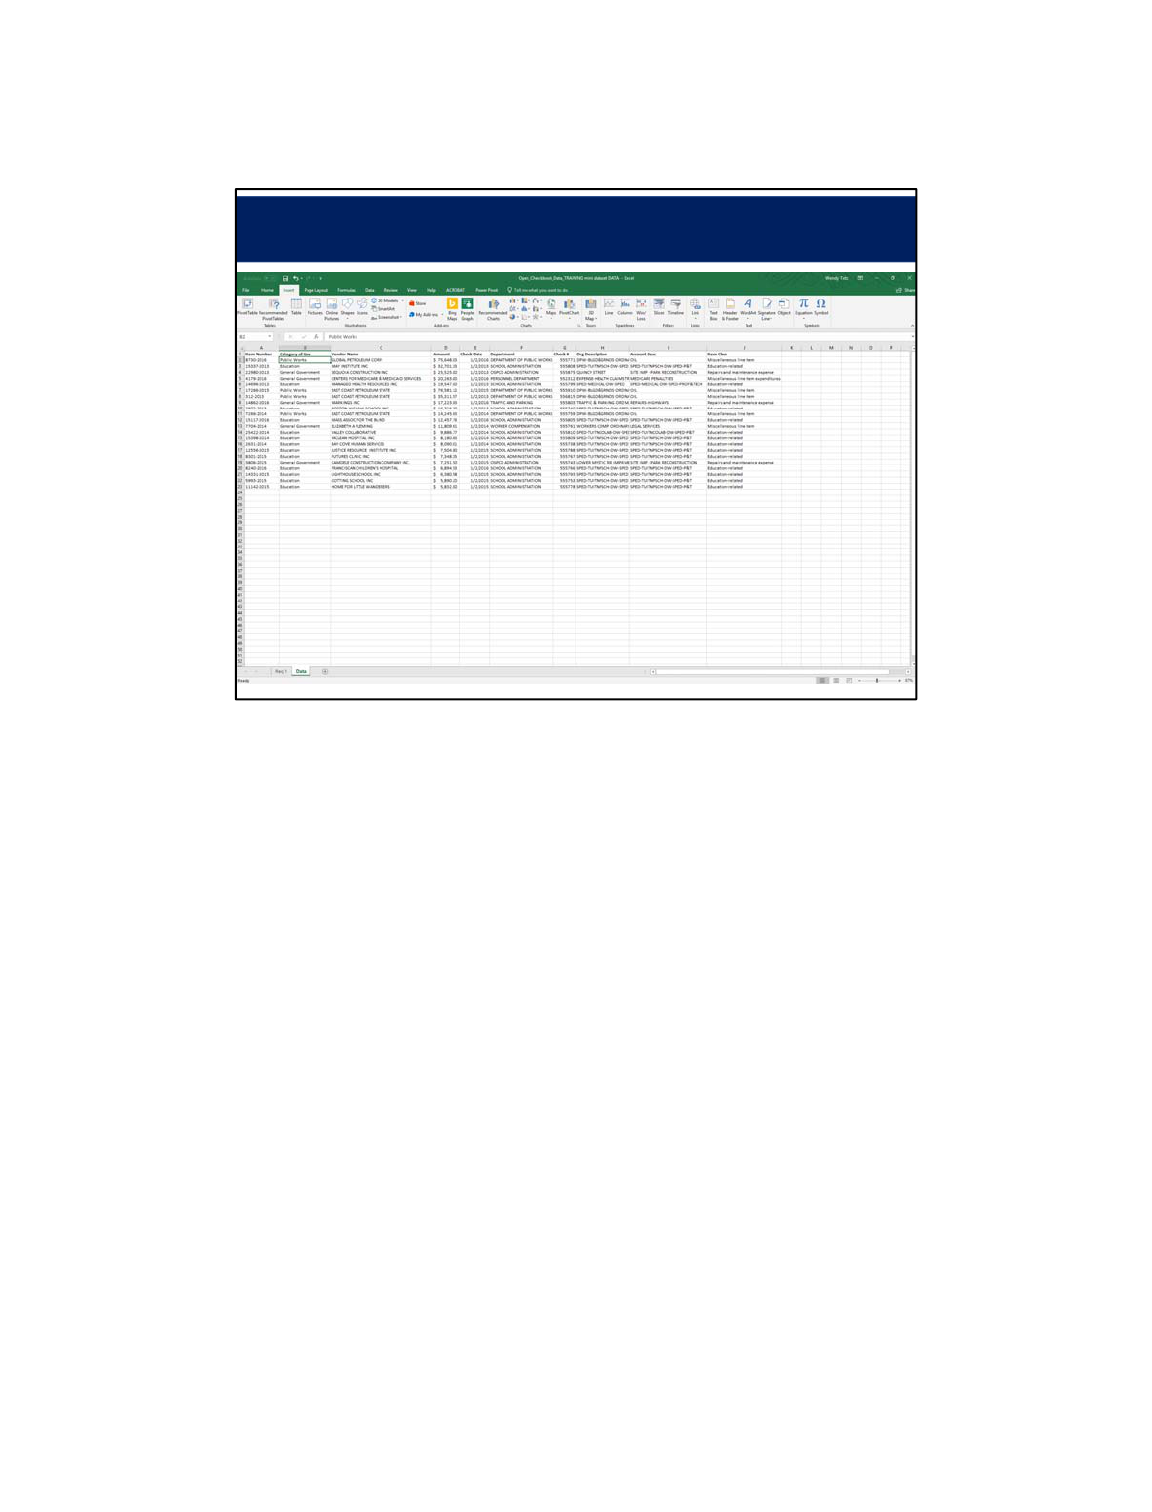
StartbyopeningExcelworkbook
StartthisactivitybyopeningtheExcelworkbookcontainingthedataset.
4

Generalinstructions
Foreachoftherequirements,createanew
pivottableinanewworksheet.Nameeach
newworksheetas“Req1,”“Req2,”etc.
Formatthedollaramountsineachpivottable
orpivotchartusingtheaccountingformat
withzerodecimalplaces.Formatnon‐
currencynumbersineachpivottableorpivot
chartusingthenumberformatwithzero
decimalplaces.
Ingeneral,foreachoftherequirementsinthisactivity,createanewpivottableina
newworksheet.Nameeachnewworksheetas“Req1,”“Req2,”etc.Formatthe
dollaramountsineachpivottableorpivotchartusingtheaccountingformatwith
zerodecimalplaces.Formatnon‐currencynumbersineachpivottableorpivot
chartusingthenumberformatwithzerodecimalplaces.
5

Requirement1
From2013– 2016,whatwasthe
totalspendingineachofthefour
calendaryears?
Requirement1asks“From2013– 2016,whatwasthetotalspendingineachofthefour
calendaryears?”
6

Req1:Totalspending2013‐ 2016
#1:Clickanywhereinthedatainthe
Dataworksheet
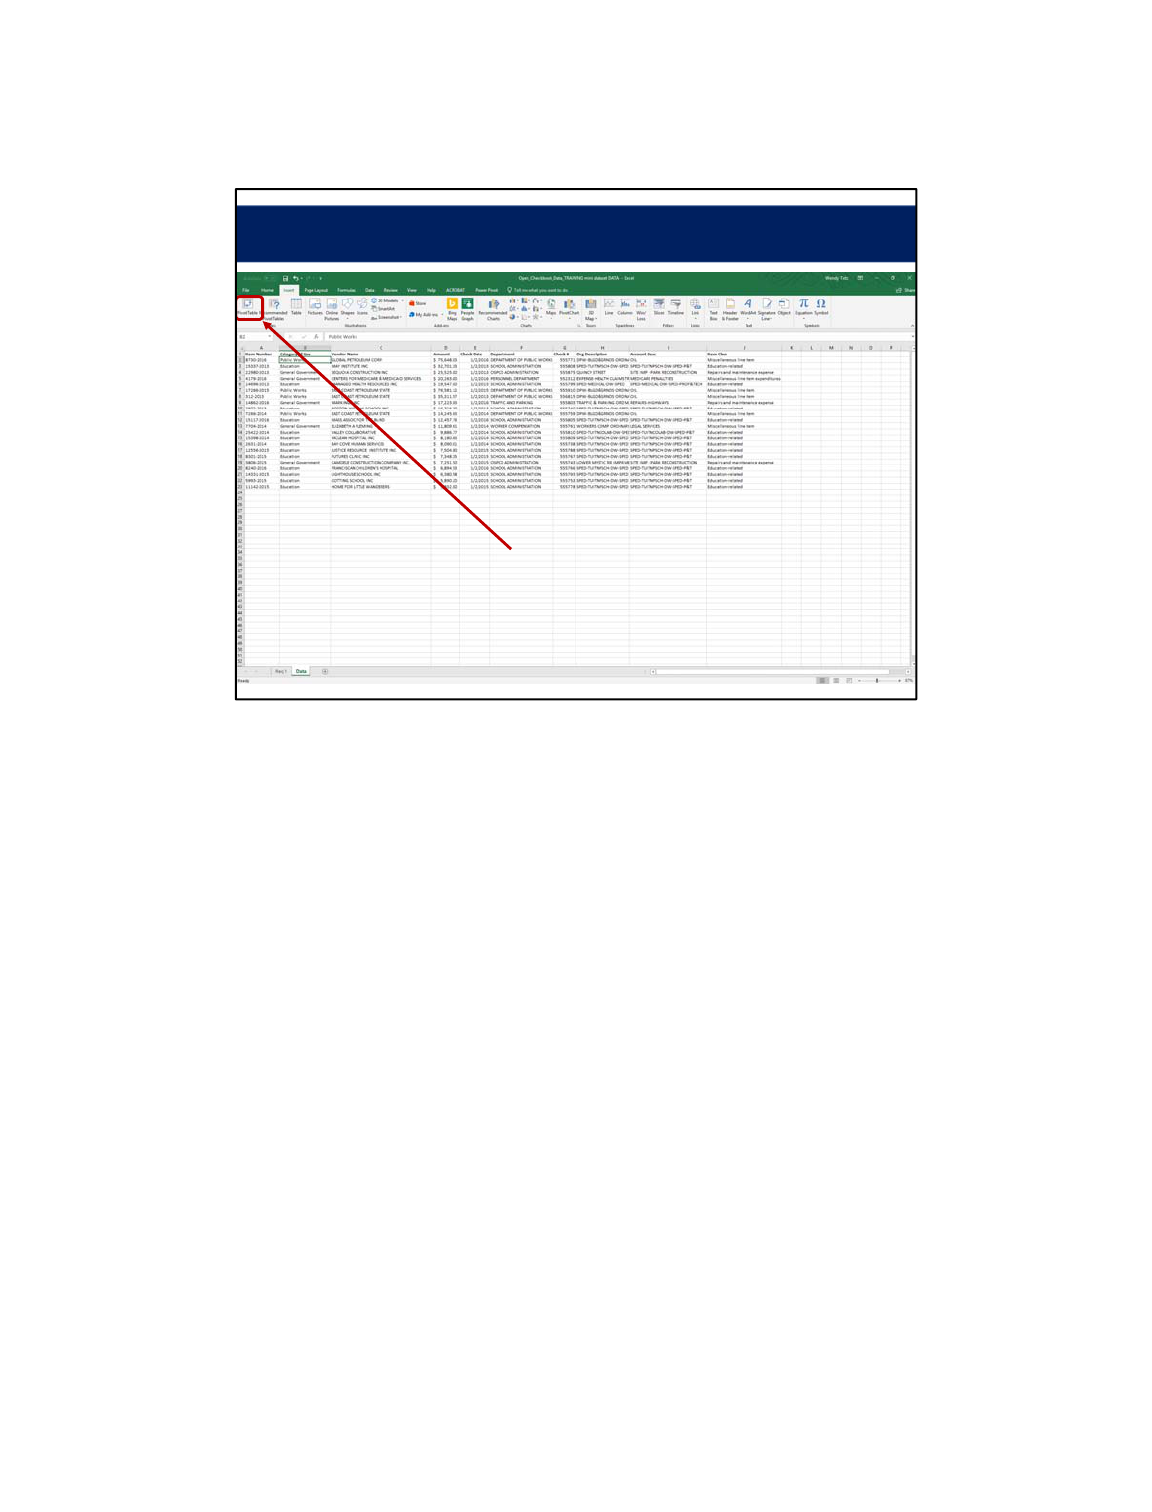
ThefirststepistoclickanywhereinthedataintheDataworksheet.
7

Req1:Totalspending2013‐ 2016
#2:ClickonInserttab
Step2istoclickontheInserttabintheribbon.
8
Req1:Totalspending2013‐ 2016
#3:ClickonPivotTable
Step3istoclickonPivotTableintheribbontoinsertaPivotTable.
9

Req1:Totalspending2013‐ 2016
#4:ClickonOK(usedefaults)
Excelwillpresentyouwithaboxcontainingpivottableoptions.Acceptthedefaultsand
clickonOK.
10

Req1:Totalspending2013‐ 2016
#5:Right‐clickthe
worksheetnameto
renameitas“Req1”
Beforewegoanyfurther,forStep5,right‐clicktheworksheetnametabandrenameit“Req
1.”Thatwilljusthelptokeeptrackofourpivottables.
11

Req1:Totalspending2013‐ 2016
#6:Drag“CheckDate”inthePivotTable
FieldspaneldowntotheColumnbox(it
willexpandtoincludeYears,Quarters,
andCheckDate.Next,wewillbe
draggingQuartersandCheckDateout
oftheColumnboxtoleaveonlyYears)
ForStep6,drag“CheckDate”inthePivotTableFieldspaneldowntotheColumnbox(itwill
expandtoincludeYears,Quarters,andCheckDate.OnceIdidthis,IdraggedQuartersand
CheckDateoutoftheColumnboxtoleaveonlyYears.IstillhaveQuartersandCheckDate
displayedonthisslide,butdrageachofthemuptotheFieldboxtoremovethemfromthe
Columnsbox– thosetwofieldswillbegoneonthenextslide.)
12

Req1:Totalspending2013‐ 2016
Noticethecolumnlabels
nowappearinthepivot
table
Noticethatthecolumnlabelsfortheyears2013through2016nowappearinthepivot
table– andthatQuartersandCheckDatearenolongerintheColumnboxbecausewe
draggedthemupthefieldbox.
13

Req1:Totalspending2013‐ 2016
Bytheway,ifthispanel
everdisappears,youcan
bringitbackbyclicking
anywhereinthepivot
tableyouhavecreated
Bytheway,ifthePivotTableFieldspaneleverdisappears,youcanbringitbackbyclicking
anywhereinthepivottableyouhavecreated.
14

Req1:Totalspending2013‐ 2016
#7:Drag“Amount”inthe
PivotTableFieldspanel
downtotheValuesbox
ForStep7,dragthe“Amount”fieldfromthePivotTableFieldspaneldowntotheValues
box.
15

Req1:Totalspending2013‐ 2016
Tochangetheamountsinthe
pivottabletobethesumrather
thanthecount,clickon“Count
of…”inthePivotTableFields
panel,selectValueFieldSettings,
andthenselectSumandclickOK.
Bytheway,watchtomakesurethatthefieldintheValuesboxsays“Sumof…”.Ifitsays
“Countof…”,thenyouneedtochangeittoSUM.Tochangetheamountsinthepivottable
tobethesumratherthanthecount,clickon“Countof…”inthePivotTableFieldspanel,
selectValueFieldSettings,andthenselectSumandclickOK.Watchinfuturepivottables
thatyouaregettingsumratherthancount– andfixitjustlikehereifyouneedtochange
it.(Gettingacountratherthanasumistheresultofhavingatleastoneblankinyourdata
set.)
16

Req1:Totalspending2013‐ 2016
Nowthepivottablehas
transactionsamounts
Nowthepivottablehasthesumsofthetransactiondollaramounts.
17

Req1:Totalspending2013‐ 2016
#8:Select
amountsinpivot
tableandright‐
clicktoselect
ValueField
Settings
InStep8,wearegoingtoformatthedata.Selecttheamountsinthepivottableandright‐
clicktoselectValueFieldSettings.
18
Req1:Totalspending2013‐ 2016
#9:Select
Number
Format
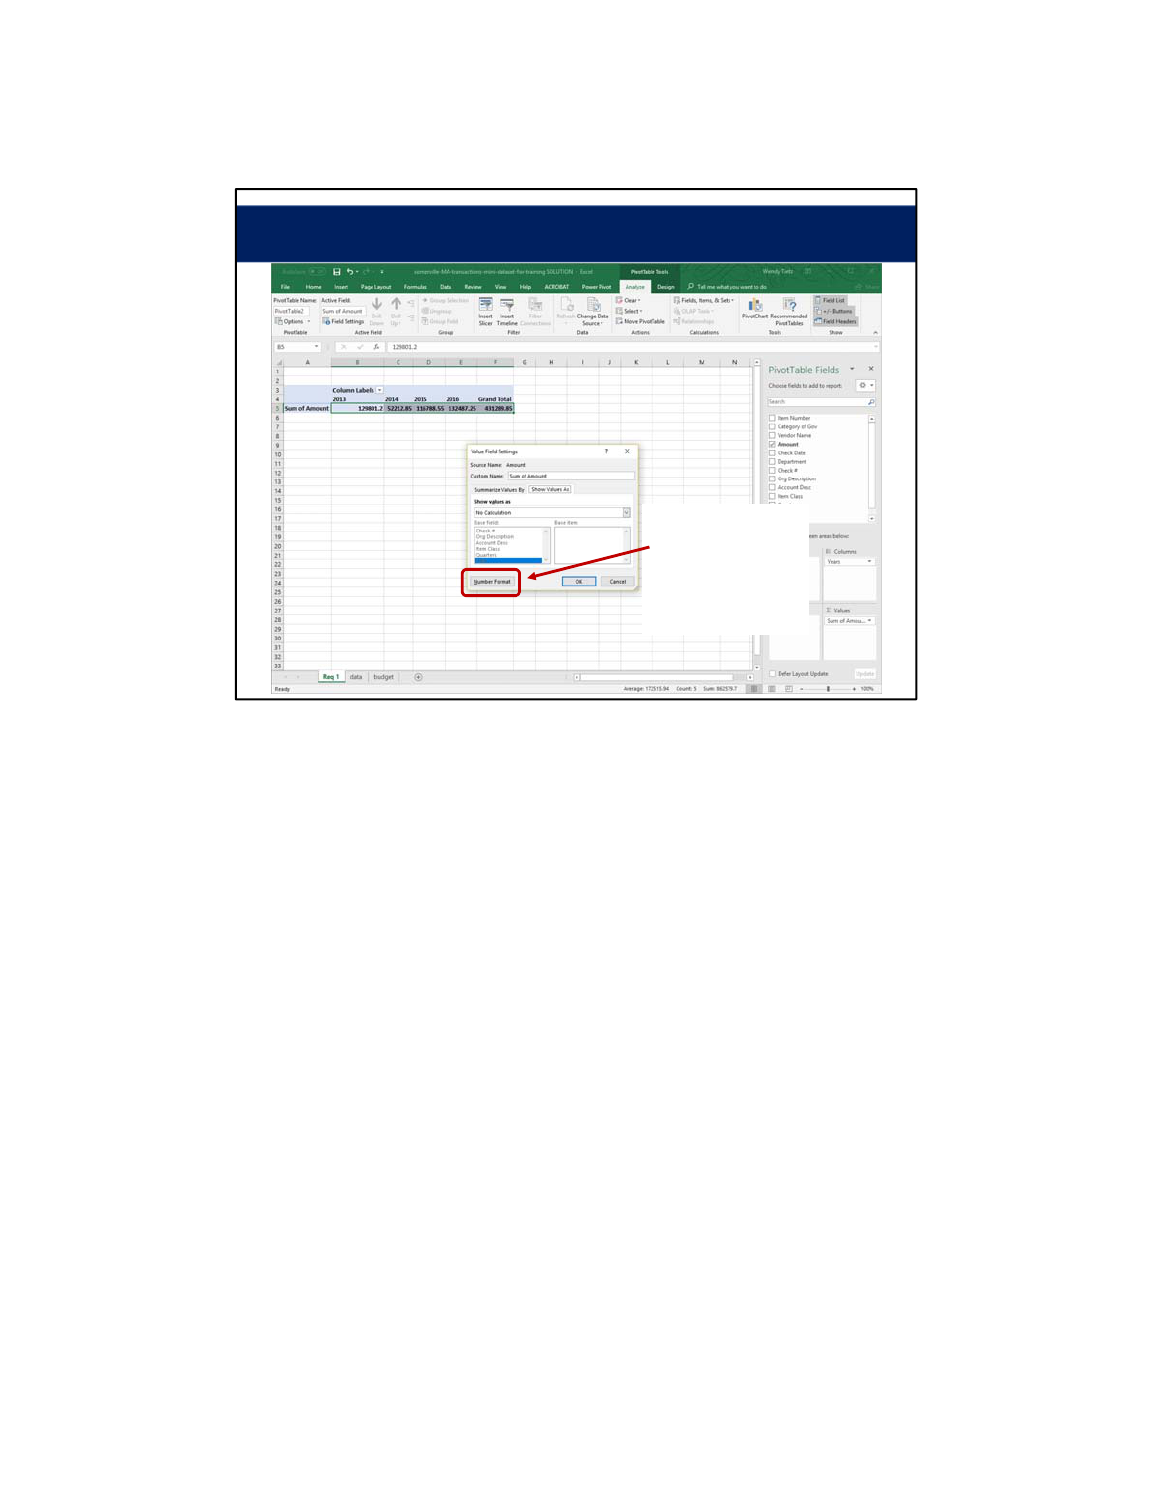
InStep9,clickonNumberFormat.
19

Req1:Totalspending2013‐ 2016
#10:Select
Accounting
formatwithzero
decimalplaces
andclickOK
InStep10,selecttheaccountingformatwithzerodecimalplacesandclickOK.
20

Req1:Totalspending2013‐ 2016
That’sit– wecanseethe
spendingforSomerville
foreachofthefouryears
inthedataset.
That’sitforrequirement1– wecanseethespendingforSomervilleforeachofthefour
yearsinthedataset.
21

Requirement2
Ineachoftheyears2013‐ 2016,
howmuchwasspentineachofthe
threecategoriesofgovernment
(Education,GeneralGovernment,
andPublicWorks)?
Requirement2asksthequestion“Ineachoftheyears2013‐ 2016,howmuchwasspentin
eachofthethreecategoriesofgovernment(Education,GeneralGovernment,andPublic
Works)?”
22

Req2:Spendingbycategory2013‐ 2016
#1:Clickanywhereinthedatainthe
Dataworksheet
ThefirststepistoclickanywhereinthedataintheDataworksheet.
23

Req2:Spendingbycategory2013‐ 2016
#2:ClickInsert,thenInsertPivotTable,
andthenclickOK
ForStep#2,toinsertapivottable,clickInsert,thenInsertPivotTable,andthenclickOK.
24

Req2:Spendingbycategory2013‐ 2016
#3:Right‐clickthe
worksheetnameto
renameitas“Req2”
ForStep#3,right‐clicktheworksheetnametorenameitas“Req2.”
25

Req2:Spendingbycategory2013‐ 2016
#4:Drag“CategoryofGov”inthe
PivotTableFieldspaneldowntothe
Rowsbox,“Amount”downtothe
Valuesbox,and“Years”downtothe
Columnsbox
InStep4,drag“CategoryofGov”inthePivotTableFieldspaneldowntotheRowsbox,
“Amount”downtotheValuesbox,and“Years”downtotheColumnsbox.
26

Req 2:Spendingbycategory2013‐ 2016
Remembertocheck– isthe
Valuesfield“Sumof…”or“Count
of…”?Tochangetheamountsin
thepivottabletobethesum
ratherthanthecount,clickon
“Countof…”inthePivotTable
Fieldspanel,selectValueField
Settings,andthenselectSumand
clickOK.
Remembertocheck– istheValuesfield“Sumof…”or“Countof…”?Tochangethe
amountsinthepivottabletobethesumratherthanthecount,clickon“Countof…”inthe
PivotTableFieldspanel,selectValueFieldSettings,andthenselectSumandclickOK.
Watchinfuturepivottablesthatyouaregettingsumratherthancount– andfixitjustlike
hereifyouneedtochangeit.
27

Req2:Spendingbycategory2013‐ 2016
#5:Selecttheamountsinpivottable
andright‐click.SelectValueField
SettingsandthenNumberFormat.
SelectAccountingFormatandzero
decimalplaces.ClickOK.
ForStep5,selecttheamountsinpivottableandformatastheaccountingformatwithzero
decimalplaces.
28

Req2:Spendingbycategory2013‐ 2016
That’sit– wecanseewhatwas
spentineachcategoriesof
governmentforSomervilleforeach
ofthefouryearsinthedataset.
That’sit– wecanseewhatwasspentineachcategoryofgovernmentforSomervillefor
eachofthefouryearsinthedataset.
29

Requirement3
In2016,whichaccount(usethe
field“AccountDesc”forthisanswer)
wasthelargestintheGeneral
Governmentcategory?
Requirement3reads“In2016,whichaccount(usethefield“AccountDesc”forthisanswer)
wasthelargestintheGeneralGovernmentcategory?”
30

#1:Clickanywhereinthedatainthe
Dataworksheet
Req3:In2016,largestaccountforGeneral
Governmentcategory
ThefirststepistoclickanywhereinthedataintheDataworksheet.
31

Req3:In2016,largestaccountforGeneral
Governmentcategory
#2:ClickInsert,thenInsertPivotTable,
andthenclickOK
ForStep#2,toinsertapivottable,clickInsert,thenInsertPivotTable,andthenclickOK.
32

Req3:In2016,largestaccountforGeneral
Governmentcategory
#3:Right‐clickthe
worksheetnameto
renameitas“Req3”
ForStep#3,right‐clicktheworksheetnametorenameitas“Req3.”
33

Req3:In2016,largestaccountforGeneral
Governmentcategory
#4:Drag“CategoryofGov”inthe
PivotTableFieldspaneldowntothe
Columnbox,“AccountDesc”downto
theRowsbox,and“Amount”downto
theValuesbox
ForStep4,drag“CategoryofGov”inthePivotTableFieldspaneldowntotheColumnbox,
“AccountDesc”downtotheRowsbox,and“Amount”downtotheValuesbox.
34

Req3:In2016,largestaccountforGeneral
Governmentcategory
#5:Drag“Years”inthePivotTable
FieldspaneldowntotheFiltersbox
Nowwearegoingtoaddafilterboxtothepivottable.ForStep5,drag“Years”inthe
PivotTableFieldspaneldowntotheFiltersbox.
35

Req3:Spendingbycategory2013‐ 2016
Req3:In2016,largestaccountforGeneral
Governmentcategory
#6:Clickon
“Years”inthe
Filterboxthat
appearsatthetop
ofthepivottable
andselect“2016”
Nowwearegoingtofilterthepivottabletoshowonlyamountsfromexpenditures
madein2016.Clickon“Years”intheFilterboxthatappearsatthetopofthepivot
tableandselect“2016.”
36

Req3:Spendingbycategory2013‐ 2016
Req3:In2016,largestaccountforGeneral
Governmentcategory
Hereweseethepivottablethat
hasbeenfilteredtoshowonly
expendituresmadein2016
Hereweseethatthepivottablehasbeenfilteredtoshowonlyexpendituresmadein2016.
37

Remembertocheck– isthe
Valuesfield“Sumof…”or“Count
of…”?Tochangetheamountsin
thepivottabletobethesum
ratherthanthecount,clickon
“Countof…”inthePivotTable
Fieldspanel,selectValueField
Settings,andthenselectSumand
clickOK.
Req3:In2016,largestaccountforGeneral
Governmentcategory
Remembertocheck– istheValuesfield“Sumof…”or“Countof…”?Tochangethe
amountsinthepivottabletobethesumratherthanthecount,clickon“Countof…”inthe
PivotTableFieldspanel,selectValueFieldSettings,andthenselectSumandclickOK.
38

Req3:Spendingbycategory2013‐ 2016
Req3:In2016,largestaccountforGeneral
Governmentcategory
#7:Right‐clickintheGeneral
Governmentcolumn,selectSort,
andsortfromLargesttoSmallest
Nowlet’ssortthepivottablebytheexpensecategoryintheGeneralGovernmentcolumn
tofindthelargestcategoryofspending.ForStep7,right‐clickintheGeneralGovernment
column,selectSort,andsortfromLargesttoSmallest.
39
Req3:Spendingbycategory2013‐ 2016
Req3:In2016,largestaccountforGeneral
Governmentcategory
#8:Selecttheamountsinpivottable
andright‐click.SelectValueField
SettingsandthenNumberFormat.
SelectAccountingFormatandzero
decimalplaces.ClickOK.
InStep8,wewillformattheamountsinthepivottable.Selecttheamountsinpivottable
andformatastheaccountingformatwithzerodecimalplaces.
40

Req3:Spendingbycategory2013‐ 2016
Req3:In2016,largestaccountforGeneral
Governmentcategory
Hereweseethepivottablethathas
beenfilteredtoshowonlyamounts
from2016ANDithasbeensorted
fromlargesttosmallestaccountsin
theGeneralGovernmentcategory
Hereweseethepivottablethathasbeenfilteredtoshowonlyamountsfrom2016ANDit
hasbeensortedfromlargesttosmallestaccountsintheGeneralGovernmentcategory.
41

Requirement4
In2016,whowasSomerville’s
largestvendorasmeasuredbytotal
dollarsspent?Howmanyseparate
paymentsdidthecitymaketothis
vendor?Whatwastheaverage
amountofeachpaymenttothis
vendor?Whydidthecitypaythis
vendor?
Requirement4reads“In2016,whowasSomerville’slargestvendorasmeasuredbytotal
dollarsspent?Howmanyseparatepaymentsdidthecitymaketothisvendor?Whatwas
theaverageamountofeachpaymenttothisvendor?Whydidthecitypaythisvendor?”
42

#1:Clickanywhereinthedatainthe
Dataworksheet
Req4:In2016,largestaccountforGeneral
Governmentcategory
ThefirststepistoclickanywhereinthedataintheDataworksheet.
43

Req4:In2016,largestaccountforGeneral
Governmentcategory
#2:ClickInsert,thenInsertPivotTable,
andthenclickOK
ForStep#2,toinsertapivottable,clickInsert,thenInsertPivotTable,andthenclickOK.
44
Req4:In2016,largestaccountforGeneral
Governmentcategory
#3:Right‐clickthe
worksheetnameto
renameitas“Req4”
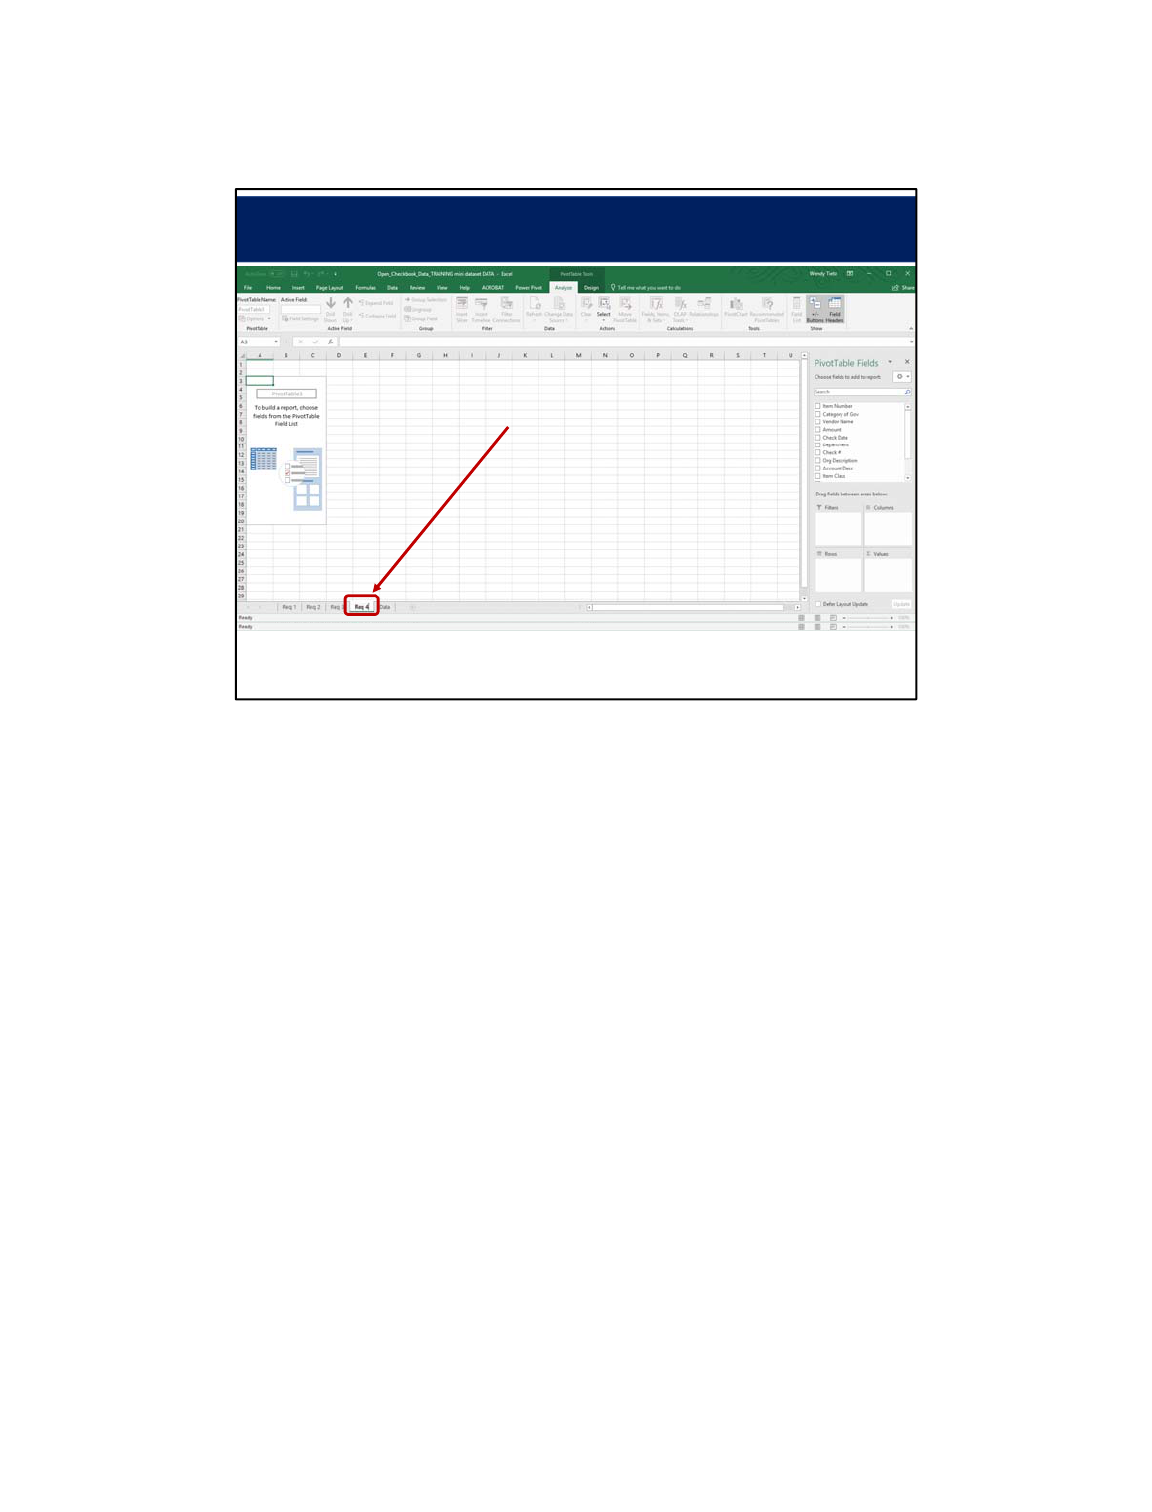
ForStep#3,right‐clicktheworksheetnametorenameitas“Req4.”
45

Req4:In2016,largestaccountforGeneral
Governmentcategory
#4:Drag“Years”inthePivotTable
FieldspaneldowntotheFiltersbox,
“VendorName”downtotheRows
box,and“Amount”downtothe
Valuesbox
InStep4,Drag“Years”inthePivotTableFieldspaneldowntotheFiltersbox,“Vendor
Name”downtotheRowsbox,and“Amount”downtotheValuesbox.
46

Req4:In2016,largestaccountforGeneral
Governmentcategory
#5:Drag“Amount”inthePivotTable
Fieldspanel2moretimesdownto
theValuesboxsothatyousee3
“SumofAmount”(or“Countof
Amount”)fieldsintheValuesbox
ForStep5,drag“Amount”inthePivotTableFieldspanel2moretimesdowntotheValues
boxsothatyousee3“SumofAmount”(or“CountofAmount”)fieldsintheValuesbox.
47

Req4:In2016,largestaccountforGeneral
Governmentcategory
Select2016astheyeartofilterthe
datatoincludeonly2016transactions
Select2016astheyeartofilterthedatatoincludeonly2016transactions.
48

Req4:In2016,largestaccountforGeneral
Governmentcategory
#6:Right‐clickthe2
nd
SumofAmount
columninthePivotTable,select
SummarizeValuesBy,andselectCount
ForStep6,right‐clickthe2ndSumofAmountcolumninthePivotTable,selectSummarize
ValuesBy,andselectCount.(MakesurethefirstAmountcolumnis“Sumof…”– ifnot,
changeittobe“Sumof…”.)
49

Req4:In2016,largestaccountforGeneral
Governmentcategory
#7:Right‐clickthe3
rd
SumofAmount
columninthePivotTable,select
SummarizeValuesBy,andselectAverage
InStep7,right‐clickthe3rdSumofAmountcolumninthePivotTable,selectSummarize
ValuesBy,andselectAverage.
50

Req4:In2016,largestaccountforGeneral
Governmentcategory
#8:Right‐clickacellintheSumof
Amountcolumn,selectSort,andselect
SortLargesttoSmallest
InStep8,right‐clickacellintheSumofAmountcolumn,selectSort,andselectSortLargest
toSmallest.
51

Req4:In2016,largestaccountforGeneral
Governmentcategory
#9:Right‐clickacellintheRowLabels
column,selectExpand/Collapse,and
selectExpand
InStep9,right‐clickacellintheRowLabelscolumn,selectExpand/Collapse,andselect
Expand.
52

Req4:In2016,largestaccountforGeneral
Governmentcategory
#10:Select“ItemClass”astheitemfor
whichtoshowadditionaldetail
InStep10,select“ItemClass”astheitemforwhichtoshowadditionaldetail.
53

Req4:In2016,largestaccountforGeneral
Governmentcategory
#11:Clickthe“+”or“−”symboltothe
rightofeachVendorNametoseethe
ItemClass(es)foreachvendor
ForStep11,clickthe“+”or“−”symboltotherightofeachVendorNametoseetheItem
Class(es)foreachvendor.
54

Req4:In2016,largestaccountforGeneral
Governmentcategory
#12:SelecttheSumandAverage
columnsandformatasAccountingwith
zerodecimalplaces
ForStep12,selecttheSumandAveragecolumnsandformatasAccountingwithzero
decimalplaces.(Right‐clickthenumbers,selectValueFieldSettings,NumberFormat,
Accountingformatwithzerodecimalplaces,andthenclickOK.)
55

Req4:In2016,largestaccountforGeneral
Governmentcategory
Hereweseethesortedpivottable
listingthesums,counts,andaverages
foreachvendor
Herenowweseethesortedpivottablelistingthesums,counts,andaveragesforeach
vendor.
56

Requirement5
Howmuchinexpendituresdid
SomervillehaverelatedtoProperty,
PlantandEquipment(usethefield
“ItemClass”forthisanswer)inthe
GeneralGovernmentcategoryineachof
theyears2013– 2016?Howmuchin
expendituresineachofthoseyears
wererelatedtorepairsand
maintenance?
Requirement5reads“HowmuchinexpendituresdidSomervillehaverelatedtoProperty,
PlantandEquipment(usethefield“ItemClass”forthisanswer)intheGeneralGovernment
categoryineachoftheyears2013– 2016?Howmuchinexpendituresineachofthose
yearswererelatedtorepairsandmaintenance?”
57

#1:Clickanywhereinthedatainthe
Dataworksheet
Req5:HowmuchwasspentrelatedtoProperty,Plant
&Equipmentin2013– 2016?
ThefirststepistoclickanywhereinthedataintheDataworksheet.
58

Req5:HowmuchwasspentrelatedtoProperty,Plant
&Equipmentin2013– 2016?
#2:ClickInsert,thenInsertPivotTable,
andthenclickOK
ForStep#2,toinsertapivottable,clickInsert,thenInsertPivotTable,andthenclickOK.
59

Req5:HowmuchwasspentrelatedtoProperty,Plant
&Equipmentin2013– 2016?
#3:Right‐clickthe
worksheetnameto
renameitas“Req5”
ForStep#3,right‐clicktheworksheetnametorenameitas“Req5.”
60

Req5:HowmuchwasspentrelatedtoProperty,Plant
&Equipmentin2013– 2016?
#4:Drag“CategoryofGov”inthe
PivotTableFieldspaneldownintothe
Filtersbox,“Years”intotheColumns
box,“ItemClass”intotheRowsbox
and“Amount”intotheValuesbox
ForStep4,drag“CategoryofGov”inthePivotTableFieldspaneldownintotheFiltersbox,
“Years”intotheColumnsbox,“ItemClass”intotheRowsboxand“Amount”intotheValues
box.
61

Req 5:HowmuchwasspentrelatedtoProperty,
Plant&Equipmentin2013– 2016?
Remembertocheck– isthe
Valuesfield“Sumof…”or“Count
of…”?Tochangetheamountsin
thepivottabletobethesum
ratherthanthecount,clickon
“Countof…”inthePivotTable
Fieldspanel,selectValueField
Settings,andthenselectSumand
clickOK.
Remembertocheck– istheValuesfield“Sumof…”or“Countof…”?Tochangethe
amountsinthepivottabletobethesumratherthanthecount,clickon“Countof…”inthe
PivotTableFieldspanel,selectValueFieldSettings,andthenselectSumandclickOK.
62

Req5:HowmuchwasspentrelatedtoProperty,Plant
&Equipmentin2013– 2016?
#5:Clickondropdown
arrowinthefiltercell
toselect“General
Government”
ForStep5,clickondropdownarrowinthefiltercelltoselect“GeneralGovernment”.
63

Req5:HowmuchwasspentrelatedtoProperty,Plant
&Equipmentin2013– 2016?
#6:Selecttheamountsinthepivot
tableandformatastheaccounting
formatwithzerodecimalplaces
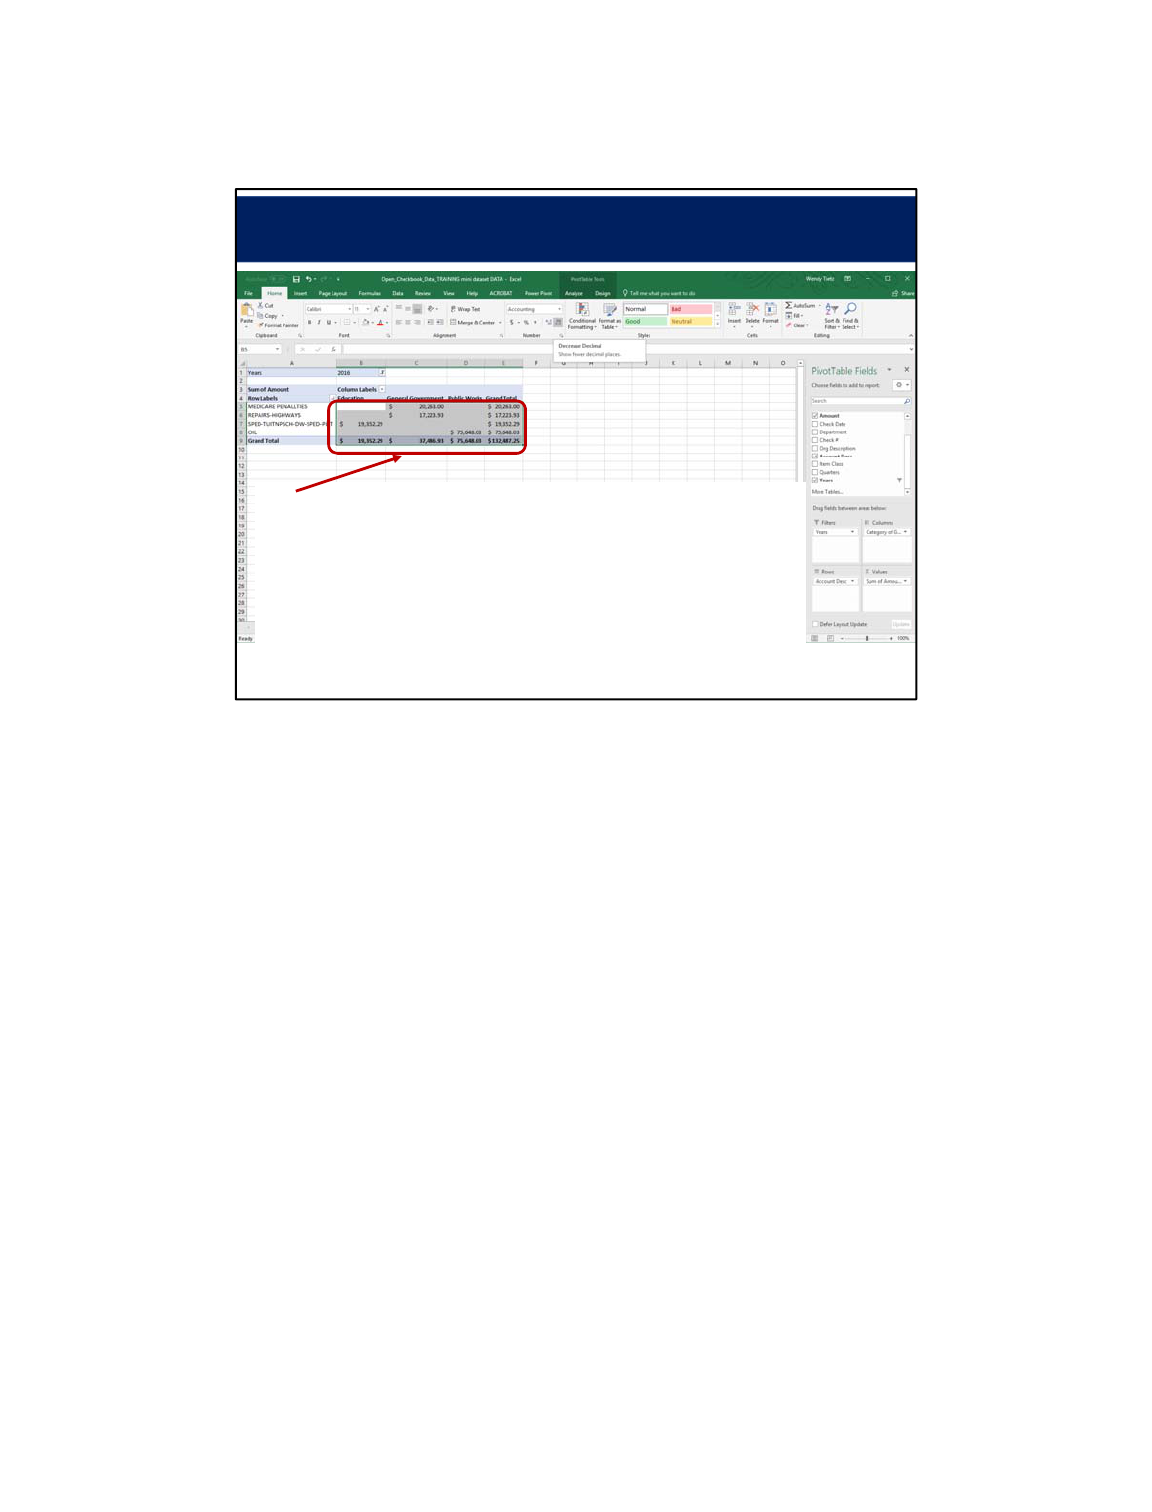
ForStep6,selecttheamountsinthepivottableandformatastheaccountingformatwith
zerodecimalplaces.
64

Req5:HowmuchwasspentrelatedtoProperty,Plant
&Equipmentin2013– 2016?
Hereweseethesortedpivottable
whichliststheexpendituretotalsfor
eachitemclassfortheGeneral
Governmentcategoryfor2013– 2016
Hereweseethesortedpivottablewhichliststheexpendituretotalsforeachitemclassfor
theGeneralGovernmentcategoryfor2013– 2016.
65

Requirement6
Prepareapivottablethatshowsalinechart
ofSomerville’sexpendituresineachofthe
threecategoriesofgovernment(Education,
GeneralGovernment,andPublicWorks)for
theyears2013– 2016.Prepareapivotchart
usingthelinecharttypeofthisinformation
onthesameworksheet.Analyzethepivot
chartandsummarizethetrends.
Requirement6reads“PrepareapivottablethatshowsalinechartofSomerville’s
expendituresineachofthethreecategoriesofgovernment(Education,General
Government,andPublicWorks)fortheyears2013– 2016.Prepareapivotchartusingthe
linecharttypeofthisinformationonthesameworksheet.Analyzethepivotchartand
summarizethetrends.”
66
#1:Clickanywhereinthedatainthe
Dataworksheet
Req6:UseaPivotCharttoanalyzeexpendituresby
categoryofgovernment.
ThefirststepistoclickanywhereinthedataintheDataworksheet.
67

Req6:UseaPivotCharttoanalyzeexpendituresby
categoryofgovernment.
#2:ClickInsert,thenInsertPivotChart
andPivotTable,andthenclickOK
ForStep#2,toinsertapivottable,clickInsert,thenInsertPivotChartandPivotTable,and
thenclickOK.
68

Req6:UseaPivotCharttoanalyzeexpendituresby
categoryofgovernment.
#3:Right‐clicktheworksheet
nametorenameitas“Req6”
ForStep#3,right‐clicktheworksheetnametorenameitas“Req6.”
69

Req6:UseaPivotCharttoanalyzeexpendituresby
categoryofgovernment.
#4:Clickinthepivottable(notthe
chart.)Drag“CategoryofGov”inthe
PivotTableFieldspaneldowntothe
Columnbox,“Years”totheRowsbox,
and“Amount”totheValuesbox
ForStep4,firstclickinthepivottable.Makesureyouarenotclickedinthepivotchart.The
rightsidepanelshouldsay“PivotTableFields.”Drag“CategoryofGov”inthePivotTable
FieldspaneldowntotheColumnbox,“Years”downtotheRowsbox,and“Amount”down
totheValuesbox.
70

Req 6:UseaPivotCharttoanalyzeexpendituresby
categoryofgovernment
Remembertocheck– isthe
Valuesfield“Sumof…”or
“Countof…”?
Remembertocheck– istheValuesfield“Sumof…”or“Countof…”?
71

Req6:UseaPivotCharttoanalyzeexpendituresby
categoryofgovernment.
#5:Right‐clickthechartand
selectChangeChartType
ForStep5,changethecharttypebyright‐clickingthechartandselectingChangeChart
Type.
72

Req6:UseaPivotCharttoanalyzeexpendituresby
categoryofgovernment.
Changethecharttypeto“Line”
Onceyouhaveright‐clickedthechartandselectedChangeChartType,select“Line.”
73

Req6:UseaPivotCharttoanalyzeexpendituresby
categoryofgovernment.
#7:Selecttheamountsinthepivot
tableandformatastheaccounting
formatwithzerodecimalplaces
ForStep7,selecttheamountsinthepivottableandformatastheaccountingformatwith
zerodecimalplaces.
74

Req6:UseaPivotCharttoanalyzeexpendituresby
categoryofgovernment.
HereweseethePivotTableand
PivotChartofspendingclassifiedby
governmentcategoryfor2013– 2016
HereweseethePivotTableandPivotChartofspendingclassifiedbygovernmentcategory
for2013– 2016.
75

h
o
r
C
o
nt
a
ct
In
fo
Preparedby:
WendyM.Tietz,PhD,CPA,CMA,CSCA
Copyright©2018WendyM.Tietz,LLC
Thatconcludesthisdataanalyticstutorialcoveringtransactionanalysisusingpivottables
andchartsinExcel.Thanksforwatching!
76
