
India’s Clean Power
Revolution
A success story with global implications
Rohit Gadre
Atin Jain
Shantanu Jaiswal
Vandana Gombar
Dario Traum
June 26, 2020
With the support of

1 May 06, 2020
There's no doubt about it: the clean energy revolution is here, and
local, state, and national governments are at the forefront. At
Bloomberg Philanthropies, we believe that these forward-thinking local
leaders can share lessons and strategies as they work to create
strong, sustainable economies and usher us into the clean energy
future. In partnership with BloombergNEF, Bloomberg Philanthropies
has released India’s Clean Power Revolution, outlining the current
successes and future potential of India’s clean energy economy.
India’s commitment to renewable energy has made it the number one
emerging market for clean energy investment, according to BNEF’s
Climatescope. The country has set ambitious renewable energy goals
– 175 GW by 2022 and 450 GW by 2030 – and is making strong
progress towards meeting those targets, thanks to supportive
government policies, openness to investors, and the volume of
renewables auctioned in recent years.
As nations seek to recover and restore economies in the wake of the
COVID-19 pandemic, India’s competitive clean energy auction market
and impressive clean energy progress can offer lessons learned for
economies looking to achieve a green recovery that maximizes
economic, health, and environmental benefits. As this report outlines,
investment in clean energy helps increase energy access and supply,
creates jobs and fosters economic growth, and improves climate and
air quality -- providing health benefits we sorely need right now.
Although challenges remain, India’s renewable energy transition will
serve as a model for transitioning economies all over the world. By
learning from each other, we can continue to expand global
investments in renewable energy, strengthen our economies, and
achieve a sustainable, healthy future.
Antha N. Williams
Global Head of Environmental Programs
Bloomberg Philanthropies

2 May 06, 2020
Source: BloombergNEF, Ministry of New and Renewable Energy. Note:. Solar capacity
shown in AC. Note: Large hydro was excluded from the 175GW target. The breakup of
the 450GW target is not known and it may include large hydro.
Ambitious targets, comprehensive government policies
and economics have placed India amongst the most
vibrant clean energy markets in the world. As the energy
transition accelerates, this decade brings new
challenges and opportunities for all the actors in India’s
clean power revolution.
● Targets: In 2015, India announced a target of building
175GW of clean energy by 2022, a more-than-fourfold
increase in installed capacity in just seven years. By 2030,
Prime Minister Narendra Modi wants India to reach a new
goal of 450GW of renewables.
● Integrating such volumes of variable generation will
require a flexible power system. Apart from battery storage
and peaker gas plants, lessons from around the world
highlight the importance of demand-side measures, grid
investments and market reforms for India.
● India is the world’s largest and most competitive clean
energy auction market, allowing it to procure some of the
cheapest renewable power. New auction designs allow the
replacement of fossil fuels through better integration.
● The 2030 target brings momentum to the goal of capturing
more value from the transition domestically, spelled out in
the ‘Make in India’ strategy. The wind sector has already
seen leading equipment manufacturers open factories to
supply the national and international markets.
Executive summary (1/2)
Renewables need to keep growing to meet national targets
53%
Drop in annual weighted average auction
tariffs for utility
-scale solar, over five years
1
India ranked as the most attractive emerging
market for clean energy investment in
Climatescope 2019
80%
Expected growth in India’s power demand
from now till 2030
39
50
62
75
86
175
450
0
100
200
300
400
500
2015 2016 2017 2018 2019 2022 2030
GW
Solar Wind Small hydro Biomass Renewables
CAGR = 22%
CAGR = 27%
CAGR = 13%

3 May 06, 2020
Source: BloombergNEF
● The transformation of India’s power sector in this decade
brings a $633 billion investment opportunity. Capital is
needed to build more power plants, and also to replace
and expand grid infrastructure. Public and private finance
will need to mobilize to deliver these investments.
● Accelerating deployment calls for better coordination on
land issues to ensure that grid availability matches the
commissioning of new power projects. Simplifying land
acquisition procedures and digitizing land records would
remove a bottleneck affecting the sector today.
● The financial health and resiliency of power distribution
companies will also need to be improved to give
investors confidence that they will not face payment
delays and retroactive contract negotiation. Procurement
of clean energy by corporates looking to reduce their
costs provides an opportunity to offer alternative bankable
offtakers for clean energy project developers.
● The continuation of India’s clean power revolution is
critical to global climate efforts. Coal’s role in the mix
will continue to drop despite rising power demand.
Retiring older coal plants will improve utilization rates for
the coal fleet and significantly reduce CO
2
emissions. New
clean power generation will help India avoid more than
499 million tons of CO2 emissions a year by 2030, and
bring peak emissions within reach in the next decade.
Executive summary (2/2)
Projected power sector investments (2021-2030)
Source: BloombergNEF. Note: The values for grid investments are only for poles,
wires, substations and transformers.
NEO 2019 electricity demand and generation mix
78%
76%
57%
24%
43%
778TWh
1,378TWh
2,747TWh
2010 2019 2030
Zero-carbon
Fossil fuels
8
23
44
53
87
137
282
Other flexibility
Peaker gas
Nuclear
Coal
Distribution grid
Transmission grid
Renewables
$ billion (2019, real)

4 May 06, 2020

5 May 06, 2020
Contents
Introduction
6
Explaining the Indian clean power revolution
16
India’s power sector outlook to 2030
28
Opportunities and challenges ahead
40
Conclusion
57
Appendix
61

6 May 06, 2020
Introduction

7 May 06, 2020
Source: BloombergNEF, Power Finance Corporation. Note: Latest available data for
period April 2017 to March 2018 is shown. Data on power usage from privately
owned discoms is excluded, with the exception of Delhi.
Source: BloombergNEF, Central Electricity Authority. Note: CAGR – Compound
Annual Growth Rate. Note: Consumption is shown at utility periphery.
Electricity consumption has risen every year
● India’s power demand continues to rise, due to an
expanding economy and growing population. In 2019, the
country consumed 1,285TWh, up from 851TWh per year
at the beginning of the decade.
● India has become the world’s third-largest power
consumer, behind China and the United States.
● Even as power demand was expanding, the supply deficit
narrowed from 79TWh in 2010 to 6TWh in 2019. This
was a result of rapid expansion of generation capacity,
fast rollout of transmission and distribution infrastructure,
and the connection of millions of people to the grid.
India’s power demand grew by 50%
in the last decade
Households and industries are the top power users
● Domestic and industrial consumers together constitute
56% of power demand, followed closely by agriculture.
● In March 2019, the government achieved 100%
household electrification. The next goal is to deliver
uninterrupted, 24x7 power for all.
● In June 2015, the federal government set a target to have
175GW of renewable generation capacity installed by
2022. Of these, solar PV’s target was 100GW, followed
by 60GW wind, 10GW biomass and 5GW small hydro.
Looking further ahead, the Prime Minister envisions
450GW of renewables by 2030.
851TWh
1,285TWh
2010 2019
CAGR = 4.7%
Domestic
28%
Industrial
28%
Agricultural
23%
Commercial
9%
Others
12%
895TWh

8 May 06, 2020
Source: BloombergNEF, Ministry of New and Renewable Energy. Note: Solar
capacity is in DC.
Source: BloombergNEF, Ministry of New and Renewable Energy, Central Electricity
Authority. Note: Solar capacity is in DC.
Installed capacity is diversifying, but still
dominated by coal
Renewables deployment doubled over five
years, with solar at the heart of this boom
● In the last decade, India’s net power generation capacity
increased by 212GW – nearly the total grid size of
France. Roughly 42% of this addition came from
renewable energy sources including large hydro.
● India’s wind and solar installed capacity quadrupled in a
decade, to reach 82GW by 2019. The two main reasons
for the sharp jump in capacity have been falling
technology costs and proactive government policies to
achieve the target of 175GW renewables by 2022.
To service the demand growth, installed
capacity more than doubled
● Additions of renewables have risen from 2015 levels.
From 2017, 15GW of renewables have been added each
year. More than two-thirds of this came from PV, followed
by wind. Installations of hydro power have remained low
because of long construction timelines, environmental
concerns and social pushback.
● At the end of 2019, the country had 143GW of clean
generating capacity (including large hydro) – representing
about 38% of all the power installed in the country.
2.1
5.3
10.3
11.1
12
3
3
4
2
2
3
2
7
13
15
15
15
2015 2016 2017 2018 2019
GW
Hydro
Biomass
Wind
Solar
169
185
213
236
259
288
317
337
356
380
0
100
200
300
400
2010 2012 2014 2016 2018
GW
Others
Solar
Wind
Hydro
Nuclear
Oil
Gas
Coal
9 May 06, 2020
Private companies are the main investors in
India’s clean power projects
Coal additions dropped while renewables grew
Annual renewables additions
surpassed coal, driven by the private sector
Source: BloombergNEF, Central Electricity Authority, Ministry of New and
Renewable Energy
Source: BloombergNEF
● India has been one of the world’s largest coal markets. At
least 15GW coal generation capacity were added every
year until 2016, driven by plentiful domestic coal supply
and a large power deficit. From 2016 onwards, however,
capacity additions tipped decisively toward clean power.
● The clear shift to renewables capacity is a lasting one as
it is primarily driven by economics. The gap between the
cost of new coal versus clean power generation
continues to widen in favor of the latter.
● The majority of coal power plants in India are owned by
central government companies, such as NTPC Ltd.
(erstwhile National Thermal Power Corp) and a variety of
state government entities active in the power sector.
● In contrast, private independent power producers (IPPs)
have built 90% of the wind and solar power projects in the
past five years. This is a pattern not dissimilar to that of
Europe, where incumbent generators were slow to join
the clean energy sector. Government companies are now
increasingly participating in clean energy auctions too.
19
16
4
4
8
2
5
10
11
12
3
3
4
2
2
3
7
13
15
15
15
2015 2016 2017 2018 2019
GW
Hydro
Biomass
Wind
Solar
Coal
94%
90%
88%
93%
81%
6%
10%
12%
7%
19%
2015 2016 2017 2018 2019
Government
companies
Private power
producers

10 May 06, 2020
Coal power is losing share to renewables
Coal was the dominant fuel for power generation
in 2019
The growth of renewables has started
eating into coal’s share of generation
Source: BloombergNEF, Central Electricity Authority
Source: BloombergNEF, Central Electricity Authority
● Coal remains the workhorse of India’s electricity supply
system, providing close to three-quarters of the country’s
power needs in 2019.
● But 2019 was the first year in which the absolute energy
generated by coal saw a year-on-year decline. Slower
growth in power demand, and record growth in clean
power generation, were behind this fall.
● Renewable energy sources (including large hydro)
supplied 21% of India’s grid electricity needs in 2019.
This share has increased by five percentage points in five
years, driven by combined additions in solar and wind of
between 5GW and 13GW annually.
● The share of gas power generation remains below 5%.
High prices for natural gas, which has to be imported, and
a lack of adequate gas distribution infrastructure make it
more expensive than coal power plants.
72%
4%
3%
12%
1%
5%
3%
1,383 TWh
Coal
Gas
Oil
Nuclear
Hydro
Biomass
Wind
Solar
77%
76%
76%
75%
72%
16% 17% 17% 19% 21%
2015 2016 2017 2018 2019
Renewable
energy
Nuclear
Gas
Coal

11 May 06, 2020
Source: BloombergNEF. Note: The range of the LCOE represents a range of costs
and capacity factors. All LCOE calculations are unsubsidized and exclude
curtailments and tax-credits.
Source: BloombergNEF. Note: The range of the LCOE represents a range of costs
and capacity factors. All LCOE calculations are unsubsidized and exclude
curtailments and tax-credits.
Levelized cost of energy for fixed-axis PV, 1H 2020 Levelized cost of energy for onshore wind, 1H 2020
India’s renewables are now among the
cheapest in the world
23
27
29
29
29
32
35
37
39
48
52
56
58
58
70
73
75
51
45
58
59
80
66
58
56
89
71
110
103
143
128
212
146
153
U.A.E.
India
Chile
China
Australia
Brazil
Spain
U.S.A.
Mexico
Germany
Malaysia
Thailand
Vietnam
Philippines
Japan
S. Korea
Indonesia
$/MWh (nominal)
24
26
29
29
30
31
37
37
40
41
42
59
63
78
83
92
95
44
59
51
51
71
42
57
52
62
62
56
161
157
142
184
156
202
Brazil
U.S.A.
India
Spain
Mexico
Sweden
U.K.
Chile
Germany
China
Netherlands
Philippines
Vietnam
S. Korea
Thailand
Japan
Indonesia
$/MWh (nominal)

12 May 06, 2020
Fundamentals
Source: BloombergNEF
Climatescope ranks India ahead of China, Brazil
and Chile in 2019
India became the most attractive emerging
market for clean energy investment
Analyzed 104 emerging markets
Accounting for 82% of the world’s population
Covering two-thirds of global CO
2
emissions
Each nation was scored on 167 indicators
Power demand, price attractiveness,
short and medium-term prospects
Installed clean energy, historical
investment, state of value supply
chains
Clean energy policies, power sector
structure, regulations and barriers to
renewables
India has ranked in the top 10 of Climatescope ever since
its first assessment in the 2014 edition. After coming second
in the 2018 edition, India took top spots ahead of China for
the first time. The key findings, interactive rankings and full
report are available online at http://global-climatescope.org/
2.93
2.85
2.76
2.59
2.52
2.51
2.49
2.47
2.41
2.39
India
Chile
Brazil
China
Kenya
Jordan
Argentina
Ukraine
Peru
Morocco
Fundamentals Opportunities Experience
Opportunities
Experience

13 May 06, 2020
U.S. data indicate a high renewable future
could create more jobs
Renewable energy employment in India
Renewables have also delivered on the
economic imperative of job creation
Source: Council on Energy, Environment and Water, Natural Resources Defense
Council, and Skill Council for Green Jobs. Note: Solar includes rooftop segment.
FY2019 is the financial year from April 2018 to March 2019.
Source: U.S. Energy and Employment Report, BloombergNEF
● Renewables growth is adding jobs at the fastest pace in
the power sector. At the end of March 2019, 100,000
employees worked in India’s wind and solar sector,
according to a report on growth in green energy.
● On the other hand, efficiency gains and technology are
reducing employment in the coal sector worldwide. The
Council for Energy, Environment and Water together with
the Skill Council for Green Jobs estimated that more than
105,000 jobs were lost in India’s coal sector between the
years 2000 and 2015, due to increasing mechanization.
● A report by the International Climate Initiative forecast
that India’s renewable energy sector could employ five
times more people in 2050 than the entire Indian thermal
generation sector (coal, gas, nuclear) employs in 2020.
The study expects coal sector employment to decline by
52% in the next 30 years.
● Increasing the emphasis on decentralized small
renewables and boosting domestic manufacturing have
the potential to create more employment opportunities.
0.40
0.53
0.68
0.85
1.17
3.84
Gas
Coal
Nuclear
Hydro
Wind
Solar
Number of workers per MW
17
22
23
23
21
36
65
77
38
57
88
100
FY2016 FY2017 FY2018 FY2019
Number of employees (thousands)
Solar
Wind

14 May 06, 2020
● The insistence of electricity offtakers on low tariffs led to
five solar auctions, totaling 4.7GW, being partly or fully
canceled in 2018, after bidding had been completed. This
created uncertainty for participating developers.
● However, the market has continued to grow and
successfully completed auctions eased the concerns
resulting from these cancellations. Newer auction designs
to make power output closely match demand should
reassure discoms.
● In 2019, the southern state of Andhra Pradesh sought to
renegotiate renewable power purchase agreements to
reduce the cost of power for its loss-making discoms.
● The federal Ministry of New and Renewable Energy
strongly opposed the move, warning that future
investment will dry up if contracts are not honored.
● The Andhra Pradesh High Court granted temporary relief
to IPPs and the matter is still sub judice.
● The introduction of a new Goods and Service Tax (GST)
in July 2017 caused temporary confusion for the solar
industry with regards to the applicable tax rate.
● Similarly, the safeguard duty (SGD) for cells and modules
imported from China, Malaysia and developed countries
introduced in July 2018 caused a spike in capex costs.
● IPPs whose projects were under construction complained
that they were unfairly penalized by the GST and SGD
after their tariff had been fixed. These developers are
currently being compensated by the offtakers for the
additional costs arising from these taxes.
● The rapidly falling tariffs at renewable auctions have
raised concerns that IPPs will be forced to build low-
quality projects.
● The continual stream of mergers and acquisitions in
India, typically involving international investors, suggests
that sever under-performance of projects is not common.
● As most projects have been added in the past decade, it
is still too early to make large-scale assessment of their
long-term financial and operational performance.
Auction cancellations Attempts to renegotiate contracts
Uncertainties with new taxes Concerns on asset quality for low tariff projects
However, rapid growth of renewables
also creates some challenges

15 May 06, 2020
Introduction

16 May 06, 2020
Explaining the Indian
clean power
revolution

17 May 06, 2020
Source: BloombergNEF. Note: Figures are cumulative over 2003-19
India is the world’s largest renewables auctions
market (cumulatively till 2019)
Average auction tariffs fell steeply
Record volumes of auctions and
competition have driven down tariffs
Source: BloombergNEF. Note: Volume weighted average tariffs shown. For solar,
only utility-scale tariff based auctions are considered.
● The 2019 average auction tariffs for solar are less than
half of their 2015 levels. The decline has been less steep
for wind, but for both technologies, the average tariff in
2019 was below 3 rupees/kWh ($0.04 in June 2020).
● Extreme competition has led to IPPs optimizing each
stage of project design, construction, maintenance and
operation. They have devised complex financial
strategies to lower their cost of capital, and India’s large
pipeline of tenders gives developers strong bargaining
power when negotiating prices with equipment suppliers.
● In India, utility-scale wind and solar projects are primarily
contracted through competitive auctions. A national target
of having 175GW renewables installed by 2022 has
ensured that the volume of auctions remains high.
● India’s renewables auctions are conducted in a
transparent process that follows standardized guidelines
issued by the federal government. Tenders can go
through multiple rounds of stakeholder consultations and
amendments to encourage participation and help IPPs
make informed bidding decisions.
0
1
2
3
4
5
6
2015 2016 2017 2018 2019
Rupees/kWh (nominal)
Solar
Wind
53% drop
8
8
9
9
11
18
25
31
65
89
Mexico
Turkey
Netherlands
Spain
United Kingdom
France
Germany
Brazil
China
India
GW
Awarded
Announced

18 May 06, 2020
Source: BloombergNEF. Note: Excludes auctions where awards are known to have
been canceled. For solar, only utility-scale tariff based auctions are shown.
Federal auctions have far surpassed volumes of
states’ auctions
Contracting structure for federal auctions
Federal auctions have provided a
strong investment signal to investors
● Federal auctions have overtaken state-level auctions since
2018. The poor financial health of state-government-
owned electricity distribution companies makes IPPs
reluctant to sign contracts directly with them. This led to
state auctions being undersubscribed and delivering
higher tariffs as IPPs factored in the bigger offtaker risks.
● At federal auctions, a federal agency such as Solar
Energy Corp of India (SECI) acts as a intermediate
procurer, and thus protects the IPPs from payment delays,
giving them a quasi-sovereign guarantee.
Federal agency
IPP
Power purchase
agreement
Discom
Power sale
agreement
Avoid direct
contracting
Source: BloombergNEF
● SECI maintains a payment security fund that can absorb
the delay between the moment IPPs need to be paid, and
that where power distribution companies can pay.
● As a last resort, federal agencies can also invoke the
tripartite agreement between itself, India’s central bank
and the state governments. This arrangement allows the
federal government to withhold financial assistance
payments to state governments if distribution companies
repeatedly fail to pay their dues to SECI for delivered
power.
4.8
3.8
12.9
17.9
3.4
1.6 3.6
5.7
3.6
4.4
6.4
7.4
18.6
21.5
2015 2016 2017 2018 2019
GW(AC)
State
Federal

19 May 06, 2020
Source: BloombergNEF. Note: Representative ‘inflation-linked’ tariffs are shown.
Source: BloombergNEF. Note: Representative ‘inflation-linked’ tariffs are shown.
Levelized wind auction tariffs Levelized solar auction tariffs
The levelized tariffs at India’s auctions
are among the lowest in the world
● India’s levelized auction tariffs for both wind and solar are
among the lowest in the world, despite relatively higher
borrowing costs and the absence of hidden subsidies.
● These prices are a reflection of India’s hyper-competitive
auctions and extreme project optimization by its IPPs. It is
not uncommon for auctions in India to attract several
times more bids than the capacity on offer.
What is a levelized auction tariff?
The levelized tariff calculation converts a local currency
structured tariff to a common 2019 $/MWh base after
accounting for inflation, currency of payment, project life
and expected date of commercial operation.
This enables like-for-like comparison between auctions
over time and different geographical locations.
0
20
40
60
80
100
2016 2018 2020 2022 2024
$/MWh (2019, real)
Argentina
Mexico
Brazil
U.K.
Italy
Germany
France
China
India
Commercial operation date
0
20
40
60
80
100
2016 2018 2020 2022
$/MWh (2019, real)
Chile
Mexico
Brazil
Germany
Portugal
Saudi
Arabia
U.A.E.
China
India
Commercial operation date

20 May 06, 2020
• An accelerated depreciation rate of 40% reduces the
investors’ income tax burden.
• This encourages India’s established corporations to
diversify into clean power investments.
Accelerated
depreciation
• Residential rooftop PV installations are eligible for a
20% to 40% upfront investment subsidy.
• Federal aid of 344 billion rupees ($5 billion in June
2020) for small-scale PV in agriculture was
announced in 2019 under the PM-KUSUM scheme.
Capital
subsidy
• The tax rate for new power generators is 17.2%, down
from 34.6% prior to the renewables boom.
• This reduces the levelized cost of electricity of solar
and wind by 8% to 10%.
Lower
corporate
tax
Government policies have helped
renewables become cost-competitive
Source: BloombergNEF. Note: Comparison is done based on the benchmark
levelized cost of energy for projects getting financed in 1H 2020.
Impact of lower tax rates on levelized cost
● Accelerated depreciation attracted companies with
taxable profits from other industries to invest in clean
energy projects. As the sector matured, pure-play
IPPs have taken the lead in building new capacity.
The announcement of a further decrease in the tax
rate will boost investor appetite anew.
● Capital subsidy are still be needed for segments that
are relatively less developed, for example residential
rooftop solar and small scale solar in agriculture.
ISTS waiver
• Wind and solar projects commissioned before 2022
are exempted from Inter-State Transmission System
(ISTS) charges and losses.
• This reduces delivered cost of electricity for offtaker
by up to 0.65 rupees/kWh.
100%
foreign
direct
investment
• Foreign direct investment is allowed without reviews.
• Foreign utilities, VC/PE investors, sovereign wealth
funds, pension funds and oil & gas majors have
participated in India’s clean power boom as a result.
35
33
41
37
0
10
20
30
40
50
pre Sep-19
(34.61% rate)
from Sep-19
(25.17% rate)
from Feb-20
(17.16% rate)
Utility-scale PV Onshore wind
-10%
-8%
$/MWh

21 May 06, 2020
Policies have also created demand for
renewables and attracted investors
• Renewables have priority dispatch, which means they
get access to the grid ahead of other technologies
• Curtailment of renewables generation is not allowed
except when required to preserve grid security.
‘Must-run’
status
• Strengthening the intra-state transmission (ISTS)
network as part of grid enhancement planning, covering
eight states
• In 2017, the federal government sanctioned 40.6 billion
rupees ($630 million) as a financial grant for ISTS.
Green Energy
Corridor
• Government agencies are responsible for identifying the
land and building the grid connection infrastructure.
• This gives IPPs access to large contiguous land zones
without the risks associated with their acquisition.
Solar parks
• Large power users (including discoms) are mandated to
purchase renewables through a portfolio standard
(RPO).
• Although enforcement is weak, RPOs are the top
reason cited for signing contracts for renewable energy
Renewables
Purchase
Obligations
Annual trajectory of national
Renewables Purchase Obligations
Source: BloombergNEF, Ministry of Power. Note: Individual state
regulatory commissions may have mandated different targets. Non-
solar includes wind, biomass and small hydro.
● The federal government’s RPO trajectory has
not been implemented by all states, but it
remains a key driver of distribution companies
signing long-term PPAs for renewables.
● The government is also considering a separate
Hydropower Purchase Obligation to increase the
utilization of existing large hydro plants and
provide investment signals for new capacity.
National
targets
• India’s large and regular wind and solar auctions are
tied to the introduction of the target to reach 175GW of
renewables by 2022, excluding large hydro.
• A larger target of 450GW renewables has been set for
2030, this time with the option to include large hydro.
9%
10%
10% 10% 10%
11%
3%
5%
7%
7%
9%
11%
11.5%
14.3%
17%
17.5%
19%
21%
FY2017 FY2019 FY2021
Non-Solar Solar

22 May 06, 2020
Source: European Space Agency
The renewable energy sector in India has
tremendous potential, and the government
recognizes its ability to transform India’s
energy landscape. Hence it has tried to
create an enabling policy framework to
achieve the aggressive targets it has set for
the sector. From trying to ensure easier
availability of land through solar and wind
parks, to setting up a dedicated public sector
enterprise like SECI, many positive actions
have been taken. The most recent being the
removal of tariff caps on bids, reflecting the
government’s faith in the sector’s maturity.
Sumant Sinha, chairman and
managing director, ReNew Power
“

23 May 06, 2020
Source: BloombergNEF, Central Electricity Authority. Note: FY2020 is the financial
year from April 2019 to March 2020. *FY2020 data is provisional.
Utilization rates of coal plants Official estimates of national power demand
The coal power fleet is increasingly under-
utilized and challenged by renewables
Source: BloombergNEF, Central Electricity Authority. Note: FY 2022 is the financial
year from March 2021 to April 2022. Ex-busbar electricity demand is shown
● India's coal power fleet delivered just over half its
maximum generation output in the fiscal year ending
March 2020. This is a historical low, marking a 21-
percentage point decline in a decade, from 78% in 2010.
● Projects owned by the federal government were used far
more than those owned by private IPPs or state
governments. This is because federal plants typically
have lower fuel costs as they are located closer to the
coal mines.
40
50
60
70
80
90
FY2010 FY2012 FY2014 FY2016 FY2018 FY2020*
%
National average
Federal government
plants
State government
plants
Privately owned
plants
● A key factor behind this overcapacity is the government’s
overestimation of the growth in national power demand,
as seen from the downward revisions made in 2018. This
led to over-investment in new coal capacity, with 96GW of
coal plants added to the grid over 2011-2016 alone.
● At the same time, renewables capacity grew, with the
introduction of the 2022 targets and its falling costs.
Renewables have priority dispatch and the newer
installations have lower levelized costs of energy, helping
them secure a larger share of growth than coal.
1,905
2,710
1,566
2,047
FY 2022 forecast FY 2027 forecast
TWh
2011 report
2018 report
-18%
-24%

24 May 06, 2020
Source: BloombergNEF, Central Electricity Authority.
Status of flue gas desulphurization equipment
(FGD) installations in India at the end of 2019
Cumulative monthly losses in potential power
output caused by water shortage, 2013 to 2016
More stringent emission norms, and water
shortages, impact the outlook for coal
Source: World Resource Institute, BloombergNEF
● India’s emission norms for new coal and gas power
projects are among the strictest in the world, but
enforcement is weak. The initial deadline to meet these
was December 2017. It has now been extended to
December 2022 due to widespread non-compliance.
● The International Institute for Sustainable Development
estimated that India’s coal plants need $12 billion to
install SO2, NOx and particulate matter control
equipment. This may increase tariffs by 0.32-0.72
rupees/kWh, adding to coal’s competitiveness challenge.
● Nearly 90% of India’s thermal fleet depends on freshwater
for cooling and of these units, 39% are installed in high
water-stress regions. The World Resources Institute
calculated that 14 of India’s largest thermal power
companies lost over $1.4 billion in revenue between 2013
to 2016 because of water shortage related disruption.
● A government think-tank report suggests that 600 million
Indians currently face high to extreme water stress. By
2030, the country’s water demand could be twice the
available supply, pointing to severe water scarcity. This
creates risks for water availability for coal plants.
205
167
80
14
6
Installed coal
capacity
Capacity
where FGD is
planned
Tenders
issued
Bids awardedFGD installed
GW
-5
-4
-3
-2
-1
0
Jan Feb Mar Apr May Jun Jul Aug Sep Oct Nov Dec
TWh
Lost output higher in the summer
and when monsoon is delayed

25 May 06, 2020
Source: BloombergNEF. Note: LCOE is levelized cost of electricity. Four hour
battery storage is considered and size of the battery is 25% to 100% of the installed
wind/solar capacity. Shaded areas show LCOE range.
LCOE of dispatchable renewables and coal
Historical trend of LCOEs in India
● Renewables need to be associated with storage to
displace coal more widely in the future. We expect that
mid-case new onshore wind and new solar combined with
battery storage will out-compete new coal plants on a
levelized basis by 2023 and 2029 respectively. The coal
LCOE includes the costs of meeting emission norms.
● Li-ion battery prices have fallen by 87% over the past
decade. By 2024, BloombergNEF expects prices to be
below $100/kWh on a volume-weighted average basis..
The falling costs of renewables challenge
the economics of building new coal plants
Source: BloombergNEF. Note: LCOE is levelized cost of electricity. Shaded areas
show LCOE range.
● Solar and wind have been the cheapest sources of bulk
power generation in India for the past three years. Since
2014, the mid-case levelized cost of energy (LCOE) has
dropped by 80% and 66% for solar and wind respectively.
● In theory, the best-in-class wind farms and solar plants
can generate power at $27-29/MWh, a third cheaper than
our LCOE estimate for best-in-class new coal-fired power
stations, at $41/MWh today.
0
50
100
150
200
2014 2015 2016 2017 2018 2019 2020
$/MWh (real 2019)
Fixed-axis PV Onshore wind Coal
0
40
80
120
160
2020 2025 2030 2035 2040 2045 2050
$/MWh (real 2019)
Fixed-axis PV + storage Coal Onshore wind + storage

26 May 06, 2020
India’s clean power revolution from 2015
to 2019, by the numbers
65GW
New renewables capacity built
$50 billion
Asset financing for clean energy
1
India’s global ranking for volume
of renewables auctioned
33%
Compound annual growth rate of
generation from wind and solar

27 May 06, 2020
Source: European Space Agency
India has set an example, by making great
strides towards transforming its energy
sector by ensuring affordable, secure and
clean energy access for all the citizens.
Looking at the expected upswing in the
country's demand for energy, advances in
grid integration, improved flexibility and well
coordinated energy policy at federal and
provincial levels, India will prove to be a great
leader in global climate action.
Upendra Tripathy, director general,
International Solar Alliance
“

28 May 06, 2020
India’s power sector
outlook to 2030
Comparing government projections and
BNEF’s New Energy Outlook 2019

29 May 06, 2020
Source: Central electricity Authority
Government’s view on India’s generation in 2030
The world is looking at how India’s power
system may evolve
● India’s Central
Electricity Authority
(CEA) projected
the optimal
capacity mix to
meet the projected
electricity demand
in the year 2029-30
● It considers
possible/feasible
technology options,
intermittency
associated with
renewables and
other constraints.
● The study aims to
provide a basis for
planning policies
and systems to
meet growing
electricity demand.
Source: BloombergNEF
BloombergNEF’s global long-term analysis
● The New Energy
Outlook (NEO) is
BNEF’s annual
long-term analysis
of the global power
system.
● It is an in-depth
analysis of 20
countries,
evaluating the
economic drivers,
tipping points and
physical constraints
that could shape the
power sector until
2050.
● Our outlook is a
based on least-cost
technology options
to meet future
electricity demand.

30 May 06, 2020
Source: European Space Agency
India pledged in Paris that by 2030, 40% of our
installed capacity will be from non-fossil-fuel
based resources. We have already crossed 37%,
and are expecting to get to 55-60% by 2030.
The question before us as a country, and as the
world, is whether the environment is important or
not, and whether we want to leave behind a
livable world for our great grandchildren.
Shri Raj Kumar Singh, Union Minister of State
(Independent Charge), Ministry of Power and
Ministry of New and Renewable Energy,
and Minister of State, Ministry of Skill
Development and Entrepreneurship
“

31 May 06, 2020
Source: BloombergNEF NEO 2019.
Per-capita electricity use remains low by global
standards even in 2030
India’s power demand is expected to grow
by 80% in ten years
● Despite the rise in power demand, per-capita electricity
consumption in India will continue to remain below that of
many developed and developing economies. Even by
2030, India’s per-capita demand is lower than Brazil’s
today.
● This suggests that there is room for power demand to
grow well beyond 2030, as India catches up with global
trends in per-capita electricity requirements.
Source: BloombergNEF NEO 2019, Central Electricity Authority. Note: CEA
forecasts are interpolated for years not available and offset by three months for
calendar year comparison. CAGR = Compound Annual Growth Rate
Demand projections in NEO and CEA follow
similar trajectory
● India’s power demand in 2030 will be around 2,700TWh,
up from 1,500TWh in 2020.
● Increasing population and GDP per capita will continue to
drive power demand growth in the next decade. Newly
connected rural consumers will also expand their use of
electrical appliances. Rising demand for air conditioning
will push up its power usage by 25% by 2030.
● The share of demand from electric vehicles is less than
0.5% by 2030 , despite early signs of growth by 2030.
0
500
1,000
1,500
2,000
2,500
3,000
2020 2022 2024 2026 2028 2030
TWh
NEO other demand NEO Air conditioning CEA demand forecast
CAGR = 6%
India
Brazil
China
Australia
U.S.
0
3,000
6,000
9,000
12,000
15,000
2012 2020 2030
kWh per capita

32 May 06, 2020
Source: BloombergNEF NEO2019, Central Electricity Authority. Note: Solar capacity
is in AC. An inverter loading ratio of 1.3 is assumed for NEO 2019. CEA’s figure’s
for financial year ending March 2030. Others include batteries, demand response
and oil.
2030 capacity mix 2030 generation mix
Government’s vision is more bullish than
our least-cost system modeling results
Source: BloombergNEF NEO 2019, Central Electricity Authority. Note: CEA’s
figure’s for financial year ending March 2030.
● CEA estimates that the size of the Indian grid will expand
to 838GW by FY2029-2030, compared to NEO 2019’s
projection of a rise to 734GW by 2030. CEA is more
bullish on cumulative solar, wind and coal than BNEF.
● NEO 2019 predicts installed capacity of 204GW(AC) of
solar, 109GW of wind (onshore and offshore) and 234GW
of coal by 2030. By 2030, 62% of installed capacity would
be non-fossil fuel based. This is significantly higher than
the 40% India committed to under the Paris Agreement.
● CEA projects 2,518TWh of gross electricity generation by
FY2029-30, compared to a 9% higher figure of 2,747TWh
for 2030 in NEO 2019. The plant capacity factors are
higher in NEO 2019, leading to more generation from
lower capacity compared to CEA projections.
● CEA expects India to source 54% of electricity from coal,
19% from solar and 12% from wind by 2029-2030. NEO
2019 projects that coal would supply 55%, and solar and
wind just 15% and 11% respectively by 2030.
267
234
70
81
280
204
140
109
838
734
CEA NEO 2019
GW
Others
Biomass
Wind
Solar
Nuclear
Gas
Hydro
Coal
54%
55%
8%
8%
4%
7%
19%
15%
12%
11%
CEA NEO 2019
Biomass
Wind
Solar
Nuclear
Gas
Hydro
Coal
Share of generation

33 May 06, 2020
Source: BloombergNEF NEO 2019.
The next decade will see more generation from
renewables, but also coal
Coal fleet utilization rises by 12 percentage points
● In NEO 2019’s least-cost pathway, generation from solar
and wind grows by 365% and 281% respectively between
2020 and 2030, to reach 26% of all electricity produced.
● Coal power generation also rises, but at a considerably
slower pace of 35% over ten years.
● However, NEO 2019 shows that coal plants’ capacity
factor would improve markedly from now to 2030, as
fewer coal plants are added in a market with rapidly
growing power demand.
● Coal plant portfolio owners may decide to retire older
plants in order to improve the utilization rate, and hence
efficiency and return, of their newer plants.
Coal fleet grows more slowly, but it
is utilized much better
0
500
1,000
1,500
2,000
2,500
3,000
2020 2022 2024 2026 2028 2030
TWh
Biomass
Gas
Nuclear
Wind
Solar
Hydro
Coal
62%
74%
50%
60%
70%
80%
2020 2022 2024 2026 2028 2030
Capacity factor
Source: BloombergNEF NEO 2019.

34 May 06, 2020
Source: BloombergNEF. Note: Annual savings and avoided CO2 emissions are shown based on the
comparison of generation in NEO 2019’s least cost projections and a scenario where no new renewables
are built from 2020 onwards. The cost of transmission, distribution and real time balancing of demand-
supply is not considered.
Keeping the momentum on building renewables produces
rising benefits each year as their cost declines
● We compare the outcomes of a no-new-
renewable build scenario to the least-cost
approach modelled in NEO 2019.
● We find that India saves $78 billion
cumulatively in electricity generation costs
from now to 2030 by following the least-cost
path to meeting electricity demand. This is a
estimate based on the low-case forecast
LCOEs for all technologies. It also does not
account for any additional grid requirements
or balancing for the intermittency of
renewables. To put saving in context, India’s
banks had $79 billion of credit deployed to
the power sector at the end of 2019.
● In addition, India also avoids 2,860 metric
tonnes of CO
2
emissions with the expansion
of renewables capacity. To compare the
scale of abatement, 2,771 MtCO2 were
emitted by all of India’s power plants put
together from March 2017 to March 2019.
● Even at a low nominal carbon price of
$10/tCO
2
, the avoided emissions would be
worth $29 billion over the period.
The least-cost path saves money, and
lowers CO
2
emissions considerably
1.0
2.0
3.2
4.6
6.1
8.0
10.2
12.8
15.9
19.3
23.5
40
76
118
162
210
260
301
348
398
450
499
-600
-500
-400
-300
-200
-100
0
100
200
300
-60
-50
-40
-30
-20
-10
0
10
20
30
2020 2022 2024 2026 2028 2030
$ billion (2019, real)
Savings
from
$10/tCO2
carbon price
Savings by
replacing
fossils with
renewables
Avoided
CO2
emissions
million ton CO
2

35 May 06, 2020
Source: BloombergNEF NEO 2019
Source: BloombergNEF NEO 2019. Note: Flexible capacity includes peaker gas,
pumped hydro, batteries and demand response. Solar capacity is in AC.
2034 – grid connected capacity mix
Typical demand profile on high air conditioner
use day in India in 2034
India builds 450GW renewables by 2034 and
will need 10% flexible capacity in NEO 2019
● NEO 2019 shows that India could reach over 450GW of
renewable energy (excluding hydro) by 2034, close to the
2030 target. About 48% of the total capacity mix could be
made up of solar, wind and biomass by then.
● India’s total grid-connected capacity would reach 934GW
by 2034, with more than 10% made up of flexible capacity
sources which aid in renewables integration.
● India’s power demand is expected to peak at midday by
2030s instead of early evenings today, because of higher
residential and commercial demand for air-conditioning.
● This fundamental shift in peak demand to midday
(coinciding with peak solar generation), from a pre-
dominant evening peak now, will require additional
sources of flexibility. These would preserve system
stability in periods of sharply shifting demand and supply.
250
300
350
400
01:00 04:00 07:00 10:00 13:00 16:00 19:00 22:00
GW
General demand AC demand
27%
2%
4%
9%
2%
15%
31%
10%
934GW
Coal
Gas
Nuclear
Hydro
Biomass
Wind
Solar
Flexible capacity

36 May 06, 2020
Source: BloombergNEF NEO 2019Source: BloombergNEF NEO 2019
Power sector carbon emissions in India Per-capita power sector carbon emissions
450GW of renewables would keep India on
track to meet peak power sector emissions
● High renewable energy penetration in the Indian grid
could help the country reach peak power sector carbon
emissions by 2038.
● India’s emissions trajectory closely follows the fate of its
coal plants, as 98% of current power sector carbon
emissions originate from there.
● Emissions from power plants are expected to rise by 69%
to 1,617MtCO2 by 2038, from an estimated 958MtCO
2
in
2018. By 2050, emissions are expected to decline by
11% from the peak, to 1,437MtCO
2
if India’s energy
sector can continue to invest in more clean capacity.
● High renewable energy penetration would also mean that,
even though India’s absolute power sector carbon
emissions increase, per-capita emissions only rise
marginally to 2038, after which they decline.
0
2
4
6
8
10
2012 2018 2025 2030 2035 2040 2045 2050
tCO
2
/person
India Australia China South Korea U.S.
0
300
600
900
1,200
1,500
1,800
2012 2018 2025 2030 2035 2040 2045 2050
MtCO
2
e
Oil Gas Coal

37 May 06, 2020
Source: BloombergNEF, Ministry of Power. Note: Renewables includes large hydro,
small hydro, biomass, solar and wind.
Share of renewables went up post-lockdown
● The pandemic has given grid operators and discoms the
experience of operating the power system with higher
shares of intermittent generation. This should help them
plan the flexibility requirements and dispatch procedures
for a 450GW renewables future.
● The underlying economic drivers of LCOEs for wind and
solar remain largely unchanged. With the governments
supportive policies, the Covid-19 pandemic is not
expected to alter India’s path to 450GW renewables.
Covid-19: slowing power demand growth,
but not the energy transition
Power demand is recovering slowly
Source: BloombergNEF, Ministry of Power, Power System Operation Corp Ltd.
● India’s power demand fell by 36% in the first week of the
Covid-19 national lockdown as commercial and industrial
users shut operations. Demand started to pick up after
the economy began to gradually re-open.
● The share of renewables in the generation mix before
India’s virus lockdown was 14-18%. After March 25, the
drop in power demand led to lower utilization of coal
plants. Wind and solar generators were protected by their
priority dispatch. This led to the share of renewables
going up to nearly 30%.
0
1,000
2,000
3,000
4,000
5,000
01-Jan 01-Feb 01-Mar 01-Apr 01-May 01-Jun
2013
2014
2015
2016
2017
2018
2019
2020
GWh
March 25:
Lockdown
May 1: Gradual re-
opening of offices
and manufacturing
June 1:
Heat wave
subsides
0%
20%
40%
60%
80%
100%
01-Feb 01-Mar 01-Apr 01-May 01-Jun
Renewables
Nuclear
Gas
Coal
Pre-lockdown
coal's share
was 75-80%
Post-lockdown
coal's share
dropped to 65-
70%

38 May 06, 2020
Source: UNEP, Frankfurt School-UNEP Centre, BloombergNEF. Note: Includes only solar, wind, biomass and geothermal. India has a target of 175GW renewables by 2022.
India’s renewables ambition in
perspective
8.2
8.2
9.4
9.6
9.8
11.5
12.4
13.6
15.7
21.5
22.4
22.6
22.8
26.5
30.6
32.1
59.9
81.9
83.4
124.1
Brazil
Turkey
Belgium
Mexico
Nigeria
Taiwan
Spain
Japan
Netherlands
Algeria
France
South Africa
Italy
U.A.E.
South Korea
U.K.
Saudi Arabia
China
Germany
India
Top 20 largest legislated government renewables additions targets with deadlines between 2020 and 2030
17.21
%
India accounts for nearly a fifth of all
renewables deployment targets to 2030
Rest of the world
721GW

39 May 06, 2020

40 May 06, 2020
Opportunities and
challenges ahead
Fulfilling India’s 2030 ambitions

41 May 06, 2020
450GW
renewables
Source: BloombergNEF
1. Evolution of
auctions
2. Increasing
system flexibility
3. Scaling up
investments
4. Preparing the
grid
5. Coordinating
land acquisition
6. Addressing
discoms’ finances
7. Managing coal
retirements
8. Stepping up
manufacturing
Eight areas of focus to get to 450GW of
renewables

42 May 06, 2020
Source: BloombergNEF. Note: Qualitative assessment where green shows main benefit, yellow shows other benefits, grey is not applicable.
Standalone wind, solar do not
provide high output all year round
● India initially auctioned only standalone wind and solar projects, as the focus
was solely on increasing renewables capacity. Of course, solar projects do
not generate through the night, but wind output is also highly seasonal.
● Load balancing has become more difficult for grid operators and discoms, as
the share of intermittent renewables increased rapidly in the past five years.
At the same time, India’s distribution companies are being pushed by the
regulators to procure more renewable energy to meet the mandated
purchase obligations. Thus, the discoms are now driving the next stage of
auctions through ‘demand-driven’ tenders.
● These new tenders put more responsibility on developers, by defining hours
and volumes of supply and transferring balancing responsibilities to IPPs.
Auction
Configuration
Match supply
to demand
Increase
transmission use
Increase
capacity factor
Reduce
intermittency
Other
reason
Capacity
auctioned
Wind
-solar
hybrid
-
1.440MW in
two auctions
Renewables
peak power
supply
Mandate use
of storage
1,200MW in
one auction
Round
-the-
clock
renewables
Likely to need
storage
400 MW in
one auction
Bundling coal
with renewables
Use stranded
coal plants
Draft policy
published.
New auction designs force renewables
to compete against dispatchable coal
Source: BloombergNEF. Note: 1MW(DC) solar and
1MW wind modelled for a high resource site in Kutch,
Gujarat..
0%
25%
50%
75%
100%
Jan Apr Jul Oct
Solar
Wind

43 May 06, 2020
The renewable industry, especially solar, has
progressed tremendously in the last decade
and is continuously evolving. With the
increase in the renewable energy share in
the energy mix and the drop in storage
prices, the sector is moving rapidly towards
24/7 supply from renewables power sources.
With the recent integrated bids, like RE
hybrids, round-the-clock supply and peaking
power supply, designed to serve the needs of
the grid, the sector is set for a massive leap
forward. Providing dispatchable power to the
grid is the only way the renewables sector
will sustain its growth in years to come.
Ranjit Gupta, CEO, Azure Power
“
Source: European Space Agency

44 May 06, 2020
Source: BloombergNEF
Source: BloombergNEF, tender documents. Note: The round-the-clock auction does
not mandate 24x7 dispatch. It is rather an auction requiring high capacity factors.
Comparing the two auctions in 2020 that move
beyond procuring standalone renewables
IPP strategies to keep tariffs low at the newer
types of auctions for renewable power
Parameter
Peak power supply
auction
Round
-the-clock
auction*
Renewable
capacity
1,200MW with no
constraints on wind
-
solar
ratio
400MW with no
constraints on wind
-
solar
ratio
Energy
storage
Mandatory deployment of
at least 600MWh but no
technology constraints.
Not mandatory, but likely
to be used to meet
capacity factor
requirements.
Supply
requirements
3MWh/MW of project
capacity to be supplied
for six of the nine defined
peak hours. Annual
capacity factor (CF) at
least 35%.
No time
-of-day supply
constraints. Minimum
annual CF 80% with
monthly CF of at least
70%.
Tariff structure
Off
-
peak tariff set at 2,880
rupees ($38.12)/MWh.
Average peak hour tariff
from auction was 6,303
rupees ($83.42)/MWh. No
escalation to tariffs.
Levelized tariff of 3,600
rupees ($47.65)/MWh for
25 years, assuming 9%
discount rate.
India’s auctions are taking renewables
closer to 24x7 power
Financial measures
Lower IRR
expectations for the
first few projects
Benefit from global
price decline for PV
modules and batteries
Lower financing
costs from post Covid-
19 recovery measures
Sell excess power to
third party
Technical measures
Use combination of
wind, solar and energy
storage
Oversize projects to
meet supply
requirements
Locate project across
multiple sites
Deploy mix of
seasonal and short-
term storage

45 May 06, 2020
Source: BloombergNEF NEO 2019
High renewable energy generation week – 2034
Low renewable energy generation week – 2034
Daily and seasonal variation of 450GW
renewables grid highlights flexibility needs
0
100
200
300
400
500
0 6 12 18 0 6 12 18 0 6 12 18 0 6 12 18 0 6 12 18 0 6 12 18 0 6 12 18
GW
Battery
Flex
Solar
Wind
Biomass
Hydro
Gas
Coal
Nuclear
Demand
0
100
200
300
400
500
0 6 12 18 0 6 12 18 0 6 12 18 0 6 12 18 0 6 12 18 0 6 12 18 0 6 12 18
GW
Battery
Flex
Solar
Wind
Biomass
Hydro
Gas
Coal
Nuclear
Demand

46 May 06, 2020
Source: BloombergNEF
Source: BloombergNEF. Note: Data for 2018 shown.
Different global approaches to increase power system flexibility
Measure
Global example
Adoption in India
Interconnection and
larger balancing areas
China’s Gansu province has 8GW ultra-high voltage
transmission line, which is 71% of its 2018 peak load
Limited potential to increase regional interconnection but
need to accelerate work on the Green Energy Corridor
Shorter dispatch
intervals
South Australia dispatch at 5-minute intervals Shortening the current 15-minute dispatch needs changes to
IT infrastructure and market rules
Market pricing for
ancillary services
The U.K. introduced a sub-second frequency
response product in 2016.
India’s reforms of the ancillary services must allow for price
discovery and technology-neutral participation for providers
Demand response California conducts auctions to procure demand
response
Needs wider adoption of dynamic pricing, smart meters and
compensation mechanism for large power users
Energy storage Australia’s market for ancillary services has ensured
batteries are effectively providing frequency control
Clear market rules needed for the different uses of energy
storage – from instantaneous to long-term balancing of
demand-supply.
India can draw on global best practices
to ramp up its system flexibility
South Australia
Flexible
operation
Flexible
demand
Flexible supply
Flexible transmission
U.K.
Flexible
operation
Flexible
demand
Flexible supply
Flexible transmission
California
Flexible
operation
Flexible
demand
Flexible supply
Flexible transmission
Germany
Flexible
operation
Flexible
demand
Flexible supply
Flexible transmission

47 May 06, 2020
Source: BloombergNEF
Source: BloombergNEF NEO 2019. Note: Measured in investment year, not
construction year.
Zero-carbon sources of power attract 80% of
investments from now to 2030
All sources of capital need to pitch in to meet
projected investment needs
Debt
Commercial
banks
Non-banking
financial
companies
Multilaterals
and
development
agencies
Export credit
agencies
Equity
Sponsor/
developer
Insurance,
pension and
sovereign
wealth funds
Private equity,
infrastructure
funds
Venture
capital
Public
markets
Public offering
Bond market:
green, project,
corporate,
sustainability
Infrastructure
trusts
● NEO 2019 projects investment requirement of $410
billion to 2030, of which $281 billion is in renewables.
India attracts 9% of the world’s total investment in
generation and energy storage. This makes it the second-
biggest investment destination after China.
● Wind and solar put together need $188 billion of capital.
To put this in context, new-build asset finance for the two
technologies totaled $77 billion from 2010 to 2019. So,
India will need to mobilize different sources of capital to
finance the power sector’s expansion till 2030.
Over $400 billion will be needed for the
new power plants being built to 2030
Credit
enhancement
products
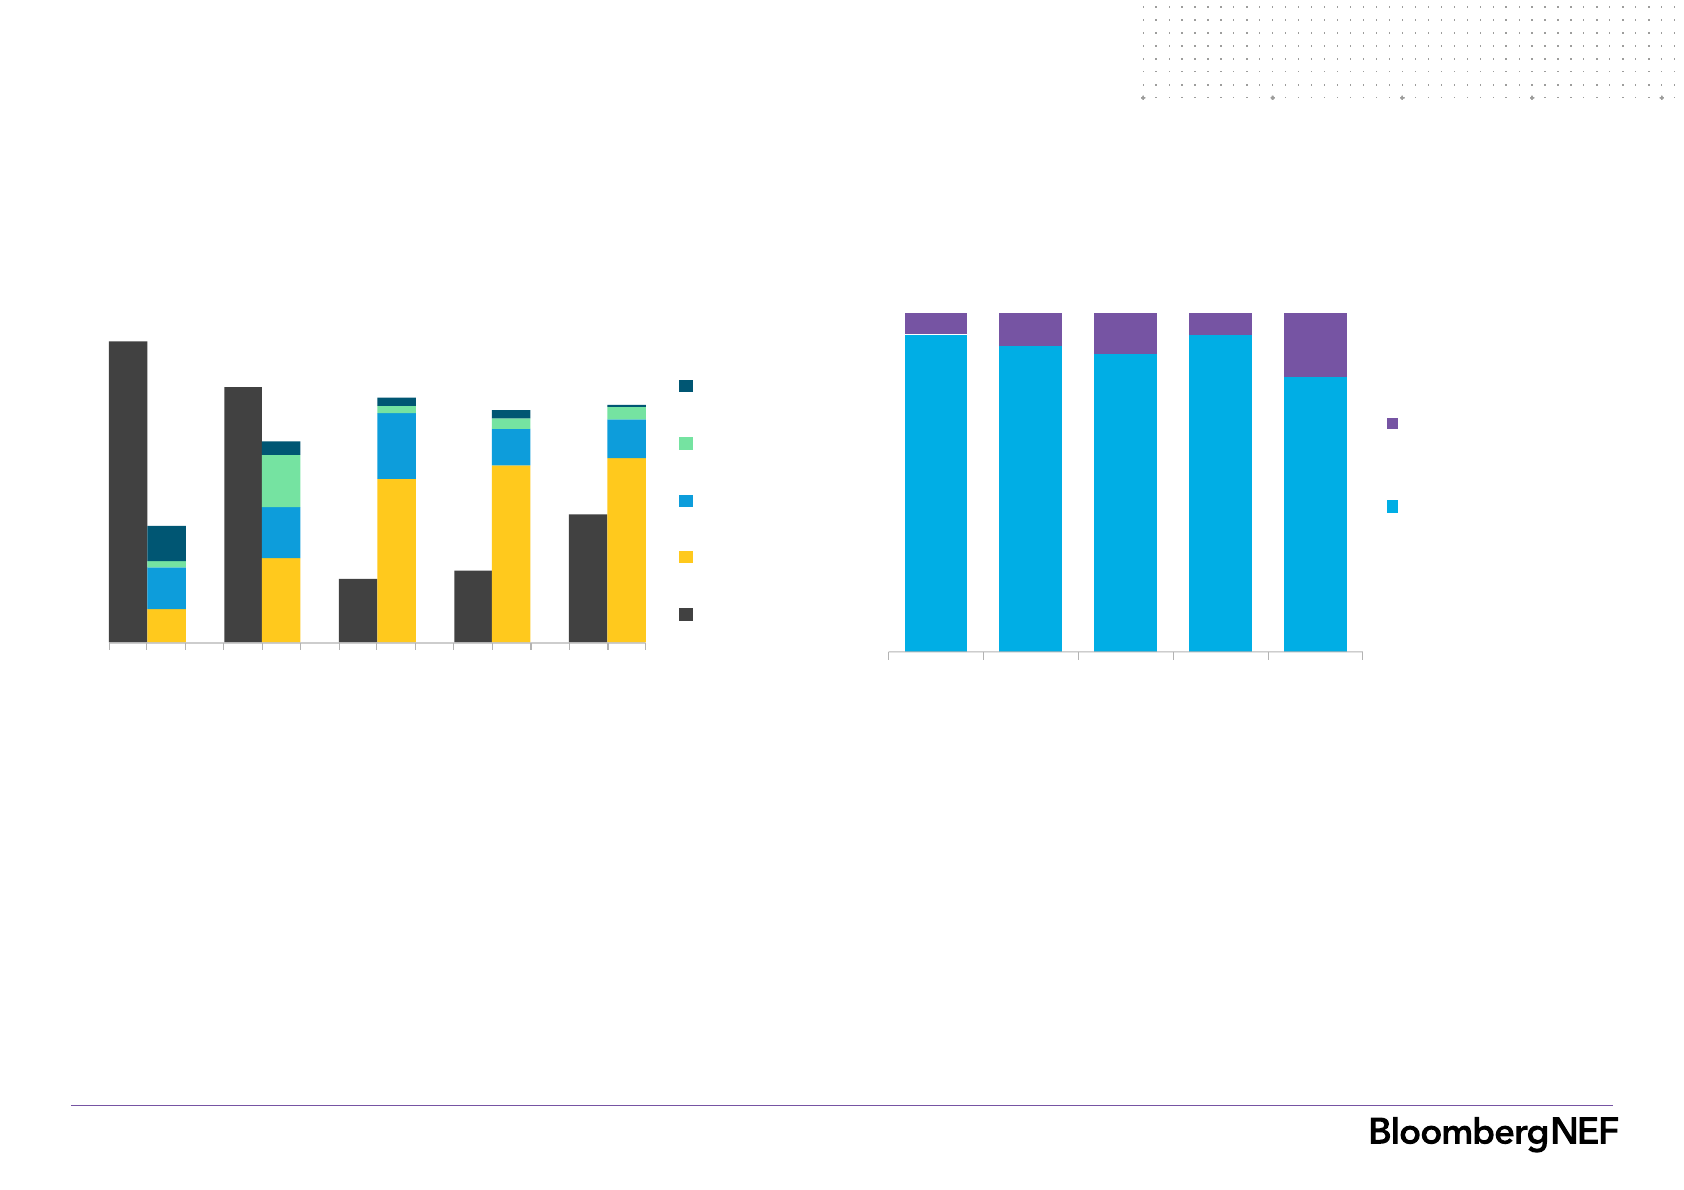
$189bn
$222bn
0 100 200
2021-25
2026-30
Solar PV
Hydro
Wind
Coal
Nuclear
Peaker gas
Other flexibility
Biomass

48 May 06, 2020
Source: BloombergNEF. Note: These figures are for poles, wires, substations and
transformers only so are likely to underestimate actual spend if we also consider
investment in new software systems and equipment to make the grid smarter and
manage growing numbers of behind-the-meter PV systems, as well as the wider
adoption of electric vehicles.
Cumulative 450GW renewables grid investments
($ real)
A robust grid is essential to integrate
450GW renewables and serve end-users
● We estimate it would need $335 billion of investment in
the grid by 2034 to cater for 450GW of renewables.
Almost 60% of this money would be needed in the
transmission grid, the remainder in distribution network.
● Grid expansion and building of interconnectors for new
generation units will require about $231 billion by 2034.
Meanwhile, replacement of ageing existing transformers,
substations and cables will require another $104 billion.
● A lot of additional investment would be required to
digitalize future grids.
Source: BloombergNEF
State of digitalization of grid and future needs
Decentralized
energy
Generation Transmission
Distribution
C&I Residential
Renewables:
advanced
Thermal: early
stage
Extend asset
lifetime of thermal
generation,
improve
renewables
forecasting
Advanced
Algorithms to
balance supply
and demand, full
roll out of
predictive
maintenance
Early stage
Deployment of
automated tools,
transparency of
behind-the-meter
assets
Early stage
Energy
management
algorithms,
behind-the-
meter
optimization
Retail
Pilot projects
Smart homes
and energy
management,
pairing of smart
devices
Pilot projects
Machine learning
of blockchain
platforms for
automated trading
Modernizing
power plants,
automating
grid controls
Early
stage
Advanced
algorithms for
optimized
operations
Advanced
Full automation
for grid
stability,
optimization
Early
stage
Fast acting
aggregated
demand
response
Pilot
projects
Virtual power
plants,
aggregated
balancing
Automated
platforms using
machine
learning
Current
state
Next
steps
Early
stage
Pilot
projects
Generators Transmission Distribution Utilities
Prosumers
Trading
Today
The
challenge
Status today
Future needs
Transmission
Moderately
advanced
Decentralized
energy
Generation Transmission
Distribution
C&I Residential
Renewables:
advanced
Thermal: early
stage
Extend asset
lifetime of thermal
generation,
improve
renewables
forecasting
Advanced
Algorithms to
balance supply
and demand, full
roll out of
predictive
maintenance
Early stage
Deployment of
automated tools,
transparency of
behind-the-meter
assets
Early stage
Energy
management
algorithms,
behind-the-
meter
optimization
Retail
Pilot projects
Smart homes
and energy
management,
pairing of smart
devices
Pilot projects
Machine learning
of blockchain
platforms for
automated trading
Modernizing
power plants,
automating
grid controls
Early
stage
Advanced
algorithms for
optimized
operations
Advanced
Full automation
for grid
stability,
optimization
Early
stage
Fast acting
aggregated
demand
response
Pilot
projects
Virtual power
plants,
aggregated
balancing
Automated
platforms using
machine
learning
Current
state
Next
steps
Early
stage
Pilot
projects
Generators Transmission Distribution Utilities
Prosumers
Trading
Modernizing
power plants,
automating
grid controls
Early
stage
Advanced
algorithms for
optimized
operations
Advanced
Full automation
for grid
stability,
optimization
Early
stage
Fast acting
aggregated
demand
response
Pilot
projects
Virtual power
plants,
aggregated
balancing
Automated
platforms using
machine
learning
Current
state
Next
steps
Early
stage
Pilot
projects
Generators Transmission Distribution Utilities
Prosumers
Trading
Modernizing
power plants,
automating
grid controls
Early
stage
Advanced
algorithms for
optimized
operations
Advanced
Full automation
for grid
stability,
optimization
Early
stage
Fast acting
aggregated
demand
response
Pilot
projects
Virtual power
plants,
aggregated
balancing
Automated
platforms using
machine
learning
Current
state
Next
steps
Early
stage
Pilot
projects
Generators Transmission Distribution Utilities
Prosumers
Trading
Today
The
challenge
Distribution
Early stage
Algorithms to balance
supply and demand, full
roll out of predictive
maintenance
Deployment of
automated tools,
transparency of behind-
the-meter assets
Pilot projects
Decentralized
energy
Generation Transmission
Distribution
C&I Residential
Renewables:
advanced
Thermal: early
stage
Extend asset
lifetime of thermal
generation,
improve
renewables
forecasting
Advanced
Algorithms to
balance supply
and demand, full
roll out of
predictive
maintenance
Early stage
Deployment of
automated tools,
transparency of
behind-the-meter
assets
Early stage
Energy
management
algorithms,
behind-the-
meter
optimization
Retail
Pilot projects
Smart homes
and energy
management,
pairing of smart
devices
Pilot projects
Machine learning
of blockchain
platforms for
automated trading
Modernizing
power plants,
automating
grid controls
Early
stage
Advanced
algorithms for
optimized
operations
Advanced
Full automation
for grid
stability,
optimization
Early
stage
Fast acting
aggregated
demand
response
Pilot
projects
Virtual power
plants,
aggregated
balancing
Automated
platforms using
machine
learning
Current
state
Next
steps
Early
stage
Pilot
projects
Generators Transmission Distribution Utilities
Prosumers
Trading
Modernizing
power plants,
automating
grid controls
Early
stage
Advanced
algorithms for
optimized
operations
Advanced
Full automation
for grid
stability,
optimization
Early
stage
Fast acting
aggregated
demand
response
Pilot
projects
Virtual power
plants,
aggregated
balancing
Automated
platforms using
machine
learning
Current
state
Next
steps
Early
stage
Pilot
projects
Generators Transmission Distribution Utilities
Prosumers
Trading
Modernizing
power plants,
automating
grid controls
Early
stage
Advanced
algorithms for
optimized
operations
Advanced
Full automation
for grid
stability,
optimization
Early
stage
Fast acting
aggregated
demand
response
Pilot
projects
Virtual power
plants,
aggregated
balancing
Automated
platforms using
machine
learning
Current
state
Next
steps
Early
stage
Pilot
projects
Generators Transmission Distribution Utilities
Prosumers
Trading
Today
The
challenge
Decentralized energy
Machine learning and
blockchain platforms to
enable automated
trading
Decentralized
energy
Generation Transmission
Distribution
C&I Residential
Renewables:
advanced
Thermal: early
stage
Extend asset
lifetime of thermal
generation,
improve
renewables
forecasting
Advanced
Algorithms to
balance supply
and demand, full
roll out of
predictive
maintenance
Early stage
Deployment of
automated tools,
transparency of
behind-the-meter
assets
Early stage
Energy
management
algorithms,
behind-the-
meter
optimization
Retail
Pilot projects
Smart homes
and energy
management,
pairing of smart
devices
Pilot projects
Machine learning
of blockchain
platforms for
automated trading
Modernizing
power plants,
automating
grid controls
Early
stage
Advanced
algorithms for
optimized
operations
Advanced
Full automation
for grid
stability,
optimization
Early
stage
Fast acting
aggregated
demand
response
Pilot
projects
Virtual power
plants,
aggregated
balancing
Automated
platforms using
machine
learning
Current
state
Next
steps
Early
stage
Pilot
projects
Generators Transmission Distribution Utilities
Prosumers
Trading
Modernizing
power plants,
automating
grid controls
Early
stage
Advanced
algorithms for
optimized
operations
Advanced
Full automation
for grid
stability,
optimization
Early
stage
Fast acting
aggregated
demand
response
Pilot
projects
Virtual power
plants,
aggregated
balancing
Automated
platforms using
machine
learning
Current
state
Next
steps
Early
stage
Pilot
projects
Generators Transmission Distribution Utilities
Prosumers
Trading
Modernizing
power plants,
automating
grid controls
Early
stage
Advanced
algorithms for
optimized
operations
Advanced
Full automation
for grid
stability,
optimization
Early
stage
Fast acting
aggregated
demand
response
Pilot
projects
Virtual power
plants,
aggregated
balancing
Automated
platforms using
machine
learning
Current
state
Next
steps
Early
stage
Pilot
projects
Generators Transmission Distribution Utilities
Prosumers
Trading
Today
The
challenge
Consumers
Energy management
algorithms, behind the
meter optimization for
industrials, smart
homes, pairing of smart
devices
Commercial &
industrial users:
early stage
Residential: pilot
projects
49%
11%
20%
20%
$335bn
Transmission - new build
Transmission - replacement
Distribution - new build
Distribution - replacement

49 May 06, 2020
Need for coordination among stakeholders of
transmission grid and renewables
Development of the grid and renewables
projects calls for coordination on land issues
Source: BloombergNEF. Note: SECI is Solar Energy Corp of India.
● The construction periods for transmission networks and
renewable projects can differ a lot, but both need to come
online at the same time. Difficulties in acquiring land are a
common bottleneck for clean power plants and grid projects.
● Clear 5-10 year plans for transmission build must be
published, in which the government identifies available land
sites, in consultation with different stakeholders. IPPs would
get clarity for future investments and transmission utilities
could be held accountable for the plans.
TRANSMISSION GRID
Central and state
transmission utilities,
Ministry of Power
RENEWABLES
State agencies, Ministry of
New and Renewable
Energy, SECI, IPPs
LAND
Ownership is government,
community or private and
classified into different uses.
Technical studies to
ascertain needs, right of
way, land cost
Resource availability,
terrain, soil strength,
land cost, policy
Addressing the threats to land acquisition
Source: BloombergNEF.
DELAYS
Land acquisition
requires multiple
approvals at different
levels of government
PRE-EMPT
Officials in high
resource districts to
periodically identify
land parcels available
for renewables
COMPLEXITY
Procedures for land
acquisition and land
taxes vary by state
AMBIGUITY
Small land holdings
and poor land
records may cause
disputes and litigation
SIMPLIFY
Implement single
window clearance
with online
applications and
tracking
DIGITIZE
Complete
digitalization of land
records and make
online maps available
to IPPs
THREATS OPPORTUNITIES

50 May 06, 2020
Source: BloombergNEF, PRAAPTI portal. Note: Only payments which are unpaid
for more than 60 days are shown since these are overdue.
Discoms’ overdue payments exceed $11 billion
● As a result of mounting losses, discoms defer payments
to IPPs, creating a series of delays through the value
chain. Discoms have also attempted to renegotiate
signed PPAs or curtail power to lower their costs. This
dents investor confidence because of the threat to their
project returns, and may dampen future investments.
● Direct benefit transfer to replace current subsidies,
discom privatization or franchises,, and clear legal
precedence against contract renegotiations are urgently
needed to scale up renewable capacity additions.
The financial health of discoms could
jeopardize the outlook for renewables
Source: State Electricity Commissions, BloombergNEF. Note: FY2011 is the
financial year from April 2010 to March 2011. CAGR = Compound annual growth
rate. $1=75.6 rupees.
Slower rise in consumer tariffs hits discom
revenue
● Retail electricity tariffs rose by 1.5% in the financial year
ending March 2020, the slowest in a decade. Residential
tariffs continue to be subsidized by industrial and
commercial customers, despite the Electricity Act
recommending cross-subsidies to be capped at 20%.
● Most state-owned discoms are financially stressed as
modest tariff hikes do not cover the rising cost of supply.
Poor metering and bill collection efficiency leads to high
technical and commercial losses.
0
30
60
90
120
FY2011 FY2013 FY2015 FY2017 FY2019
$/MWh (nominal)
Commercial Industrial Residential Retail
12%
10%
5%
8%
5% 3%
5%
3% 2%
7.3
11.3
0
3
6
9
12
Jan-19
Mar-
19
May-
19
Jul-19
Sep-
19
Nov-
19
Jan-20
Mar-
20
$ billion
55% increase in 15
months

51 May 06, 2020
Source: BloombergNEF. Note: Figures are estimates based on SECI auctions from
2014 to 2019. Commissioning times of 30 months and 24 months from date of
auction is assumed for wind and solar respectively. Capacity factors for wind and
solar are assumed to be 35% and 22% respectively.
SECI’s payments to IPPs more than triple from
2019 to 2022
● The annual amounts that SECI must pay IPPs rises
rapidly as new contracts are added to the existing
commitments. These PPAs are all for 25 years, which
could put SECI’s finances under strain if discoms do not
make timely payments for the power purchased.
● Weak discom finances may also lead to curtailment of the
more expensive renewable generators. Most PPAs do not
allow IPPs to claim for the lost generation.
The changing role of public finance
SECI plays a central role in India’s clean energy
transition. This enables investors to gain confidence in
the market despite the uncertain financial situation faced
by several of the country’s offtakers.
Over time, however, it is important that the financial
imbalances of the system are resolved. Saddling SECI
with last-resort liabilities for hundreds of gigawatts of
projects without improving the creditworthiness of
discoms poses a risk to public finance and taxpayers.
The wave of retroactive cuts to clean energy investment
incentives that shook clean energy investors in a
number of European markets in the aftermath of the
2008 financial crisis provides an example of this risk.
Governments decided to reduce their obligations to
clean energy project owners, as part of an effort to
manage public spending, or reduce pressure on rate
payers where this mechanism was already in place.
To avoid liabilities accumulating on the balance sheets
of governments, the European Union introduced new
rules that ensure that clean energy incentives are
always financed through a levy on ratepayers, or a tax.
Reducing renewables’ reliance on
public finance calls for robust discoms
7
9
44
65
102
164
204
2016 2017 2018 2019 2020 2021 2022
billion rupees, nominal

52 May 06, 2020
● Financially stressed discoms may continue to charge high
tariffs for commercial and industrial customers. This
makes it even more attractive for firms to procure a part
of their electricity from other sources.
Corporate PPAs are emerging as a new
source of clean energy supply
• Discoms to issue clear limits on rooftop and
‘open access’ projects they will permit
• Applications to be cleared in a timely manner
if they are within these limits
Time is
money
• Create regulatory frameworks and
incentivize innovative solutions such as
virtual PPAs and green tariffs
New products
• States to provide clarity on level of charges
for corporate procurement
• Eliminate retrospective changes that
threaten investor confidence
5-10 year
roadmap
Source: BloombergNEF.
India’s corporates have a growing appetite for
clean energy PPAs
● India’s corporates have signed over 5GW of clean energy
procurement deals, making it the largest market in Asia.
Corporate demand for clean energy will rise further as
more Indian companies see the financial upside of
switching to renewables, and pay heed to the stringent
supply chain requirements of global manufacturers and
investors’ insistence on sustainable business practices.
● Clean energy can come from captive projects or third-
party PPAs. The renewables plants can be located onsite
or even in other states. This gives procurers the flexibility
to address their power demand and risk appetite.
Source: BloombergNEF. Note: PPA = Power Purchase Agreement
• Government agencies such as SECI can act
as demand aggregators to help pool
sufficient volume from smaller firms.
Demand
aggregation
Corporates could do with some help from the
government
1,700
570
820
1,440
893
Before 2016 2016 2017 2018 2019
MW

53 May 06, 2020
Source: BloombergNEF, Central Electricity Authority. Note: Data as of March 2019
India’s coal fleet by decade of commissioning Coal plants under-construction, by ownership
● The low capacity factors (CF) of coal plants and the
ambitious targets for renewable capacity may make it
economic to retire coal plants built before 2000. These
plants would have already recouped most or all of their
fixed investment. This represents nearly one-fourth of the
current installed capacity.
● By retiring older plants, the emissions intensity of the grid
would improve, as plants built in the 2010s are using
higher-efficiency super-critical technology.
● At the beginning of 2020, there were 36GW of coal plants
under construction, of which 90% were being built by
government-owned companies.
● If all or most of this capacity comes online, the coal fleet
CF will fall further. This will put additional pressure on
coal plants, even those built after 2000, to close down.
● Alternatively, some of the plants currently under
construction may be abandoned, leading to investment
write-downs by the equity holders.
Economics and sustainability make a
case for early coal retirements
Source: BloombergNEF, Global Energy Monitor. Note: Data as of January 2020
64%
12%
11%
10%
3%
2010s
2000s
1990s
1980s
Before 1980
4.0GW
4.2GW
11.9GW
16.6GW
Private IPPs
Federal-state partnership
Federal government
State governments

54 May 06, 2020
Source: BloombergNEF, Federal Ministry for Economic Affairs and energy (BMWi)
Germany’s lignite phase-out deal Roadmap for India’s early closure of coal plants
● Germany has an agreement to close down all its lignite
power plants by 2038. The coal regions and IPPs will
receive compensation for early closure, but less than
what they originally expected.
● In 2013, Spain also considered addressing overcapacity
by incentivizing the mothballing of gas power plants. This
would have been Europe’s first ordered liquidation of
stranded generation assets.
● The use of concessional loans and innovative structures,
such as ratepayer-backed securitization, can make
possible coal plant retirements in regulated markets
where new renewables are cheaper than existing coal.
● In 2020, India’s finance minister announced that the
government would advise utilities operating old and high-
emission thermal power plants to close them. However,
no list of power plants or timeline was provided.
● A government-directed orderly closure of older coal plants
would reaffirm the official commitment to India’s clean
energy transition.
India can learn from global approaches,
to manage its coal plant retirements
Source: BloombergNEF
Determine book value of power plants built before
2000 in consultation with IPPs and auditors
Invite comments from IPPs, financiers, workers,
discoms, NGOs, states and others
Propose preliminary compensation scheme where
IPPs and financiers could take a haircut
Agree on plant closure deal. Implement plans for
manpower retraining and use of vacated land
STUDY
DRAFT
REFINE
FINALIZE
0
2
4
6
8
10
2020-2022 2023-2030 2031-2038
GW
EnBW
Uniper / EPH
LEAG (EPH)
RWE

55 May 06, 2020
Source: BloombergNEF, company reports. Note: Data as of June 2019.
Wind nacelle manufacturing capacity in India
A clean energy future is an opportunity to
step up on ‘Make in India’
● India has developed a mature base of manufacturing for
the wind industry, from blades to nacelles and their
related upstream components.
● The presence of well developed supply chains, highly
skilled labor and relatively low costs has attracted foreign
firms to set up factories in India. The annual
manufacturing capacity is 3-4 times domestic demand,
increasingly making India an exporting nation.
● India now has the opportunity to ramp up manufacturing
of energy storage technologies, as global demand will
come from the power and automotive sectors.
0
2
4
6
8
10
12
2010 2012 2014 2016 2018
GW/year
Indian manufacturers Foreign manufacturers
Annual capacity 10-12 GW
Solar module manufacturing in India
Source: BloombergNEF, company reports.
● India’s solar module manufacturing capacity picked up
pace from 2016 as firms were buoyed by the national
installation targets. However, capacity utilization remains
below 50% for most manufacturers. The domestic market
for modules is still heavily reliant on imports.
● The government is trying to support manufacturing by
putting out tenders with domestic content requirements,
import duties and lower corporate taxes for new units.
● The government intends to offer dedicated manufacturing
parks to attract foreign firms with advanced technology
and a will to diversify their global manufacturing bases.
1.4
4.8
10.6
0
2
4
6
8
10
12
2010 2012 2014 2016 2018
GW/year
CAGR = 23%
CAGR = 31%

56 May 06, 2020

57 May 06, 2020
Conclusion
How to start a clean energy revolution
and keep it growing

58 May 06, 2020
The next decade of India’s power sector
transformation, by the numbers
$410 billion
Investment opportunity for new
power generation capacity
$223 billion
Investment needed into power
transmission and distribution
60%
Non-fossil fuel based installed
capacity, exceeding COP21
commitment
2038
Year of peak power sector
emissions in the least-cost
pathway

59 May 06, 2020
A strong start: looking back over 2010-2019 The road to reaching 450GW by 2030
● In the last decade, India’s power demand has grown by
50% and installed capacity has more-than-doubled.
● Although coal plants remain the top supplier of electricity,
their utilization and share in the generation mix is
declining. Since 2017, annual additions of renewables
have outstripped coal. Three factors explain this shift.
– A focus on cost made India the world’s largest
renewables auction market at the end of 2019. The
massive auction programs have allowed Indian
developers to optimize their projects, and have
attracted private sector investment. Levelized auction
tariffs in India are among the lowest in the world.
– Solar and wind have been the cheapest sources of
bulk power generation in India since 2018. The
success of auctions, and falling equipment prices
globally, have made wind and solar cheaper than new
coal plants on a levelized cost of energy basis.
– The government complemented its goal for 175GW of
renewables by 2022 and its auction programs with
policies that have given a wide group of investors,
national and international, private and public, the
confidence to commit for the long term.
● India’s auctions are taking renewables closer to 24x7
power. The newer types of auctions will force
renewables to match coal plants on dispatchability.
● The 450GW renewables future will need a flexible power
system to manage daily and seasonal variation. Global
best practices serve as a useful guide in achieving this.
● The power sector’s growth offers a $633 billion
investment opportunity across generation and grid
networks. Different sources of capital need to be
mobilized to finance these needs.
● The acceleration of renewables will be aided by reforms
that address two issues – improving the financial health
of discoms and better coordination between
stakeholders on land acquisition.
● Economics and sustainability make a strong case for
early coal plant retirements, but this will need the
government to play a proactive role.
● India’s strong demand for renewables equipment
provides a reason for ramping up domestic production, in
tune with the Prime Minister’s Make in India initiative.
India’s clean power revolution has
made a good start toward 450GW

60 May 06, 2020

61 May 06, 2020
Appendix

62 May 06, 2020
● The LCOE is the long-term offtake price on a MWh-basis
required to recoup all project costs and achieve a
required equity hurdle rate on the investment.
● The LCOE is calculated using BloombergNEF’s
proprietary Energy Project Valuation Model. It is based on
a project finance schedule that runs through the full
accounting life of the project, based on a set of inputs that
allows us to capture the project cost impact of the timing
of cash flows, development and construction costs,
multiple stages of financing, interest and tax implications
of long-term debt instruments and depreciation, among
other drivers.
● For each technology, we consider the development costs,
equipment costs, balance of plant costs, fixed opex and
variable opex.
● In the case of India, we make bottom-up capex
assumptions, paired with data for financing and resource
quality. These inputs are based on multiple industry
interactions, government benchmarks, regulatory filings,
company disclosures, market reports and analyst
experience.
● Our 1H 2020 analysis covers more than 7,000 projects
across 20 technologies and 46 countries around the
world. Read more here.
Methodology for calculating the
levelized cost of energy
Assumptions Description
Revenue indexation
Project revenues are inflation
-linked, starting from the LCOE which is the nominal offtake price in the first operation year.
Macroeconomics
For each country analysis, we apply the standard corporate tax rate and an inflation rate from the International Monetary
Fund’s forecast consumer price index (CPI) annual rate for that country. Currency exchange rate assumptions are based
on a preceding three
-month average.
Subsidy exclusion &
corporate tax
The analysis excludes all subsidies and incentives (accelerated depreciation, grants, production/investment tax
-credits,
feed
-in tariffs) where these benefit specific technologies over others. Our calculations do include corporate tax.
Utility
-scale focus
Our calculations are for the levelized costs of major technologies at utility scale.

63 May 06, 2020
Further reading material (1/3)
A pair of reports published by BloombergNEF in partnership with Statkraft and
Eaton, explores the possibilities for solving the power system flexibility challenge
in the U.K. and Germany. The full reports are available here.
The report explores how the transport,
buildings and industrial sectors in
Europe could be electrified. Read
more here.

64 May 06, 2020
Further reading material (2/3)
Using the lens of the Clean
Technology Fund experience, the
report explores the best new
opportunities for deploying
concessional capital. Read more here.
A report by the Climate Finance
Leadership Initiative that identifies
opportunities for leadership by the public
and private sector to meet the objectives
of the Paris Agreement. Read more here.
Report by the UN Environment
Programme (UNEP), the Frankfurt
School-UNEP Collaborating Centre and
BNEF, analyzing 2019 investment trends,
and clean energy commitments made for
the next decade. Read more here.

65 May 06, 2020
Further reading material (3/3)
Climatescope is a unique country-by-country assessment, interactive report and
index that evaluates the investment conditions for clean energy in emerging
markets. It profiles 104 markets worldwide and evaluates their ability to attract
capital for low-carbon energy sources while building a greener economy.
Climatescope is a snapshot of where clean energy policy and finance stand
today, and a guide to what can happen in the future.
In 2018, the project was expanded and updated in two key ways. The total
number of countries surveyed was expanded significantly. The methodology was
also update to learnings from BNEF’s seven years of conducting research in
emerging markets. Discover Climatescope’s analysis and tools here.
This report aims to improve
understanding of the current solar market
in ISA member countries and the
financing of these projects to date. It also
presents how the solar markets may
evolve out to 2030. Read more here.

66 May 06, 2020
Copyright
© Bloomberg Finance L.P. 2020. This publication is the copyright of Bloomberg Finance L.P. in connection with BloombergNEF. No portion of this
document may be photocopied, reproduced, scanned into an electronic system or transmitted, forwarded or distributed in any way without prior
consent of BloombergNEF.
Disclaimer
The BloombergNEF ("BNEF"), service/information is derived from selected public sources. Bloomberg Finance L.P. and its affiliates, in providing
the service/information, believe that the information it uses comes from reliable sources, but do not guarantee the accuracy or completeness of
this information, which is subject to change without notice, and nothing in this document shall be construed as such a guarantee. The statements
in this service/document reflect the current judgment of the authors of the relevant articles or features, and do not necessarily reflect the opinion
of Bloomberg Finance L.P., Bloomberg L.P. or any of their affiliates (“Bloomberg”). Bloomberg disclaims any liability arising from use of this
document, its contents and/or this service. Nothing herein shall constitute or be construed as an offering of financial instruments or as investment
advice or recommendations by Bloomberg of an investment or other strategy (e.g., whether or not to “buy”, “sell”, or “hold” an investment). The
information available through this service is not based on consideration of a subscriber’s individual circumstances and should not be considered
as information sufficient upon which to base an investment decision. You should determine on your own whether you agree with the content. This
service should not be construed as tax or accounting advice or as a service designed to facilitate any subscriber’s compliance with its tax,
accounting or other legal obligations. Employees involved in this service may hold positions in the companies mentioned in the
services/information.
The data included in these materials are for illustrative purposes only. The BLOOMBERG TERMINAL service and Bloomberg data products (the
“Services”) are owned and distributed by Bloomberg Finance L.P. (“BFLP”) except (i) in Argentina, Australia and certain jurisdictions in the Pacific
islands, Bermuda, China, India, Japan, Korea and New Zealand, where Bloomberg L.P. and its subsidiaries (“BLP”) distribute these products, and
(ii) in Singapore and the jurisdictions serviced by Bloomberg’s Singapore office, where a subsidiary of BFLP distributes these products. BLP
provides BFLP and its subsidiaries with global marketing and operational support and service. Certain features, functions, products and services
are available only to sophisticated investors and only where permitted. BFLP, BLP and their affiliates do not guarantee the accuracy of prices or
other information in the Services. Nothing in the Services shall constitute or be construed as an offering of financial instruments by BFLP, BLP or
their affiliates, or as investment advice or recommendations by BFLP, BLP or their affiliates of an investment strategy or whether or not to “buy”,
“sell” or “hold” an investment. Information available via the Services should not be considered as information sufficient upon which to base an
investment decision. The following are trademarks and service marks of BFLP, a Delaware limited partnership, or its subsidiaries: BLOOMBERG,
BLOOMBERG ANYWHERE, BLOOMBERG MARKETS, BLOOMBERG NEWS, BLOOMBERG PROFESSIONAL, BLOOMBERG TERMINAL and
BLOOMBERG.COM. Absence of any trademark or service mark from this list does not waive Bloomberg’s intellectual property rights in that
name, mark or logo. All rights reserved. © 2020 Bloomberg.
Copyright and disclaimer

Coverage.
Clean energy
Advanced transport
Commodities
Digital industry
BloombergNEF (BNEF) is a leading provider
of primary research on clean energy,
advanced transport, digital industry,
innovative materials, and commodities.
BNEF’s global team leverages the world’s
most sophisticated data sets to create clear
perspectives and in-depth forecasts that
frame the financial, economic and policy
implications of industry-transforming trends
and technologies.
BNEF research and analysis is accessible
via web and mobile platforms, as well as on
the Bloomberg Terminal.
Client enquiries:
Bloomberg Terminal: press <Help> key twice
Email: support.bnef@bloomberg.net
Learn more:
about.bnef.com | @BloombergNEF
Rohit Gadre
Atin Jain
Shantanu Jaiswal
Dario Traum
