
1
st
Moodle Research
Conference
Heraklion, Crete-Greece SEPTEMBER, 14 - 15,
2012
115 |Page
CONFERENCE PROCEEDINGS
Learning Analytics with Excel Pivot Tables
Helena Dierenfeld, Agathe Merceron
Beuth University of Applied Sciences, Berlin, Germany, {hdierenfeld,merceron}@beuth-hochschule.de
Abstract
Different actors like teachers, course designers and content providers need to gain more information
about the way the resources provided with Moodle are used by the students so they can adjust and
adapt their offer better. In this contribution we show that Excel Pivot Tables can be used to conduct a
flexible analytical processing of usage data and gain valuable information. An advantage of Excel
Pivot Tables is that they can be mastered by persons with good IT-skills but not necessarily computer
scientists.
Keywords
Pivot Tables, Learning Analytics, Usage Data
Introduction
Moodle is increasingly used in schools, universities and companies. There is a large variety of learning objects
that can be put into the system. Different actors like teachers, course designers and content providers need to
gain more information about the way provided resources are used by the students so they can adjust and adapt
their offer better. They have questions like: Do students use the resources at all? When? What are the most, the
least popular resources? How are specific contents such as e-books used? Are there resources that are often used
together? Do students participate in forums? In Wikis? Is there a link between the use of some specific learning
objects and grades in the examinations? Which contents affect learning particularly positively? Are there
contents that should be recommended?
To answer these questions, usage data stored by the system needs to be explored and analyzed. In this
contribution we show that Excel 2010 Pivot Tables (Jelen & Alexander 2010) can be used to answer many of
these questions. An advantage of Excel Pivot Tables is that they can be mastered by persons with good IT-skills
but not necessarily computer scientists. This means that a number of our targeted actors know them already or
could learn to utilize them with little effort and use them to explore user data thoroughly.
In our approach we do not generate the Excel Pivot Tables using the export towards Excel of reports or grades
provided by Moodle. Instead we have developed an application to extract data stored by Moodle towards our
own data model presented in (Krueger, Merceron, & Wolf, 2010). There are three main reasons for that. First
data is extracted and anonymised, which allows us to comply with the laws concerning data privacy in
Germany. Second it is possible to merge data from different learning systems that are used parallel by a single
institution. Finally other tables than the two currently available in Moodle can be generated more easily.
There is a number of tools that can be integrated with Moodle enabling teachers to explore user data. (Graf & all
2011) and (Leony & all 2012) present such examples. Our approach is different because our tool essentially
provides the desired tables. The analytical processing does not take place inside the tool but relies on the
existing Excel Pivot Tables. The desktop application presented in (Pedraza Perez, Romero & Ventura 2011) will
allow users to apply a number of different data mining techniques on Moodle data. Their focus is not on a
flexible data exploration or the analytical part as we concentrate on but on the data mining part itself.
There is a great number of research works analyzing usage data in Moodle, many of them are cited in (Romero
& Ventura 2010). Most of these works tackle a particular problem and solve it using data mining techniques that
only specialists can use properly. (Zafra & Ventura 2009) for instance, uses genetic algorithms and students'
user data stored in Moodle courses to predict the grades of students in those courses. More recently
(Hershkovitz & Nachmias 2011) used statistics and decision trees to analyze online persistence of students
during a semester course in a context where Moodle is used to support face to face teaching. It is well known
that in the whole
data mining cycle the step of knowing and understanding the data is essential, and this step can be performed by
analytical processing (Han, Kamber & Pei 2011). Our contribution is the usage of the Excel Pivot Tables to

116 |Page
1
st
Moodle Research
Conference
Heraklion, Crete-Greece SEPTEMBER, 14 - 15,
2012
CONFERENCE PROCEEDINGS
perform analytical processing with educational data. Afterwards a proper data mining step can be performed if
necessary.
The paper is organized as follows. In the next section Excel Pivot Tables are presented as well as the way we
generate them. In the third section we show how we have utilized Pivot Tables to explore how learning material
is used in courses and whether the use of specific self-evaluation quizzes has an impact on the final mark. Final
remarks and future work conclude the paper.
Pivot Tables
Learning management systems like Moodle store many user data in a database. This data can be analysed to
provide information to different actors in the educational field and help them to improve the learning experience
of students by optimizing their learning offer. Our approach is to allow actors who are not necessarily computer
scientists to perform part of the analysis themselves. We propose Pivot Tables for doing so.
In this section we will first explain why we chose to use our own data structure to export towards Excel and give
a quick overview about Pivot Tables afterwards.
Exporting Usage Data towards Excel
Moodle offers export in Excel format at two levels: reports and grades. To investigate the use of a course's
learning objects it is best to create a report containing all actions from all users on all objects since the course
has been created. With both Excel sheets it is possible to create an Excel Pivot Table.
We encountered some problems with Excel sheets that have been generated with Moodle:
First the report contains too much personal information like names and ip-addresses. This information can
be blocked by the Moodle administrator which however makes it impossible to determine which user has
performed a specific action. Unfortunately this determination is necessary to answer questions like “are
users who are using self-tests earning better grades than users who don’t?”
Second the relevant information is given in the column 'action' in combination with the column
'information'.
The 'information' column contains rather general data, so it is necessary to highly filter the given table in
order to get the needed values.
Third log files are deleted on a regular basis. To compare different courses you have to store the data
manually. Laws about data privacy in Germany do not allow keeping non-anonymous data for long periods
Due to the reasons mentioned we have developed an application to extract data stored by Moodle towards our
own data model presented in (Krueger, Merceron, & Wolf, 2010). This way we are able to keep historical data
and provide a reasonable data protection by replacing user names with ids in such a way that user names cannot
be recovered from the ids. In addition it is possible to integrate user data from several learning management
systems into our data model. Further with this model we are able to create various data source tables for the
Pivot Tables making it easier to get different perspectives of the data.
Working with Pivot Tables
A Pivot Table is a highly flexible contingency table. The table can be created from a large dataset and offers the
possibility to look at one section at a time. We use the Pivot Table Tool from Microsoft Excel 2010 (Jelen and
Alexander 2010). In order to create a Pivot Table it is necessary to have a data source table for Excel. The data
source table should have the following format: In the first row you need to include the column's titles. There
must not be an empty row or column in the table but empty fields are possible.
Figure 1 shows a small example. On the left side of this figure the source data table can be seen. The first line
includes the following columns: 'action' the type of action performed in Moodle, 'date' the date of the action,
'quiz title' the title of the quiz the action was performed on and 'user id' the user id who performed this action.
This table was generated by a MySQL query (MySQL 2012) from our data structure. On the right side there are
two Pivot Tables generated from this source table. The Pivot Tables are generated by selecting a field of the data
source table and choosing insert -> Pivot Table from the menu. For example the top pivot table was generated
selecting the field B5 and then the Pivot Table Tool form the menu. Excel then automatically detects the range
of the table to use. After this step Excel shows a list of all the headers detected from the data source (in this case
'action', 'date', 'quiz title' and 'user id'). It is then possible to choose which data of this list should be in the row

1
st
Moodle Research
Conference
Heraklion, Crete-Greece SEPTEMBER, 14 - 15,
2012
117 |Page
CONFERENCE PROCEEDINGS
and which in the column of the Pivot Table (in the Pivot Tables in Figure 1: the column with the action or date
and in both rows the quiz title). Last it is required to select which data and which operation should be used in the
calculating field. In the example given in Figure 1 we chose to count the number of users, so as an example the
field G4 is calculated by all user actions ‘attempt’ performed on Quiz 1. It is also possible to use other
calculations, such as sum, mean, variance, minimum and maximum (but this wouldn’t make sense here because
the user id´s are no real numerical data). Furthermore own measurement methods can be included.
Figure 1: Example of Excel Pivot Tables: On the left is the original data source. On the right are two
possible Pivot Tabels that can be created from it
Case Study
In this section we show a case study conducted with the first semester course “Formal basics of Computation”
taught in the Bachelor degree computer science and media in face to face teaching and supported through
Moodle. The course is organised in a weekly format. The top middle section contains materials for general
readings and two forums. Below, each week contains a file with slides and a non-compulsory self-test related to
the theme of the week. Each self-test closed after one to two weeks in winter semester 09/10, the user data that
we explore here as a continuation of the work started in (Krueger, Merceron, & Wolf, 2010a). The final mark
for this course is calculated by equally incorporating the grades obtained at two exams. The first exam takes
place in the middle of the semester and the second one at the end of the semester. These exams are not
conducted with Moodle. The functionality `offline assignment` of Moodle is merely used to inform students
about their grades. Past exams are uploaded in Moodle in the weeks in which these exams take place so that
students can practice and train themselves. In winter semester 09/10, 57 students were enrolled in Moodle for
this course.
Analytical Processing of Content Use
First we extract an excel table containing all resources of the course from our database with the actions
performed on them and generate the corresponding Excel pivot table with an appropriate query. We adopt the
idea “overview first, then zoom and filter, details on demand” of (Shneiderman 1996). Using the function pivot
chart with the methods to generate a Pivot Table mentioned in the section before, we obtain a histogram giving
the total number of actions performed on it during the semester for each resource. It is possible to sort the table
given in the histogram as shown in Figure 2. At a glance it is possible to have an overview of the use of all
resources as well as the information concerning most and least accessed resources, shown on the left
respectively on the right of the histogram. Note that if a resource is not used at all, it will appear with 0 action
because our Excel table is extracted taking not only the log entries but also the set of resources uploaded in that
course. This is different to exporting the report table directly from Moodle. Any resource which is not used at all
will not appear in the report so that kind of information cannot appear in the histogram.

118 |Page
1
st
Moodle Research
Conference
Heraklion, Crete-Greece SEPTEMBER, 14 - 15,
2012
CONFERENCE PROCEEDINGS
Figure 2: Overview of the number of actions per resource in increasing order
A second useful overview is access over time: When are resources used by students? This is important for
reliability issues, when should the Moodle system not be failing for example, and for pedagogical issues.
Teachers are interested to get information on how their students are learning: Do they learn regularly during the
semester, or only just before the exam? Do they consult special contents to prepare for the next lecture or after
the lecture as a review and consolidation? In this case study we were interested to know how the self-test
exercises are used. Are they used at all? Are they used before the lecture or after or both? Is there some more
intensive use before the exams? We use the filter options to select the actions ‘attempt’,’ close attempt’ and
‘view attempt’ to dismiss access in which students do not actually attempt to solve the tests. We also use the
filters within the time range to zoom on a particular time-window. Figure 3 shows the access to self-tests
exercises with a daily granularity from November the 1st till December the 4th, the first exam being on
December the 2nd as a surface chart. Note that the diagram shows cumulated actions for the time before
November the 1
st
on the Day November the 1st, and similarly for the time after December the 4th. The self-tests
are called Aufgabe1, Aufgabe 2 and so on in German. One notices that the use of self-tests generally tends to
decrease, the colour is less intense. The self-tests still opened are reused before the exam, see the vertical lines
on November the 30th and December the 1st, which suggests to keep the self-tests open during the whole
semester. The general decrease of the use of the self-tests was already noticed before. Closing the self-tests after
2-3 weeks was an experiment to investigate whether the behaviour of students would change when the self-tests
become more scarce meaning not available all semester. A quick look at the Moodle reports in 2010 could not
show a noticeable change.

1
st
Moodle Research
Conference
Heraklion, Crete-Greece SEPTEMBER, 14 - 15,
2012
119 |Page
CONFERENCE PROCEEDINGS
Figure 3: Overview of the use of self-tests before the first exam
It is interesting for teachers to be aware of their individual students: are they homogeneous or do they differ in
their use of resources? We selected a surface chart to show the details of individual access to non-compulsory
self-tests as shown in Figure 4. Even if the general trend is a decrease in usage, some students like 11373 begin
late, which fits into the findings of (Hershkovitz Nachmias 2011) identifying late users in a similar setting,
Moodle course to support face to face teaching, though the general trend is less usage as the semester
progresses. Note that in our approach the data is anonymised. Teachers cannot control particular students, as it
might be possible when working with a Pivot Table generated directly from the Moodle report. Our aim is to get
general information about diverse behaviors of students to support reflection and pro-activation, not to follow
any particular student.
The exploration presented here investigates the total number of actions on each resource. It is equally interesting
to explore the number of students who have used a resource at least once, the total number of actions is not
relevant anymore, only the fact that a resource has been used. For this, we would change the query to extract
another table from our database. It is also possible to gain that table in Excel directly, but rather complex.
Figure 4: Use of self-tests detailed per student
120 |Page
1
st
Moodle Research
Conference
Heraklion, Crete-Greece SEPTEMBER, 14 - 15,
2012
CONFERENCE PROCEEDINGS
Analytical Processing of Impact on Success
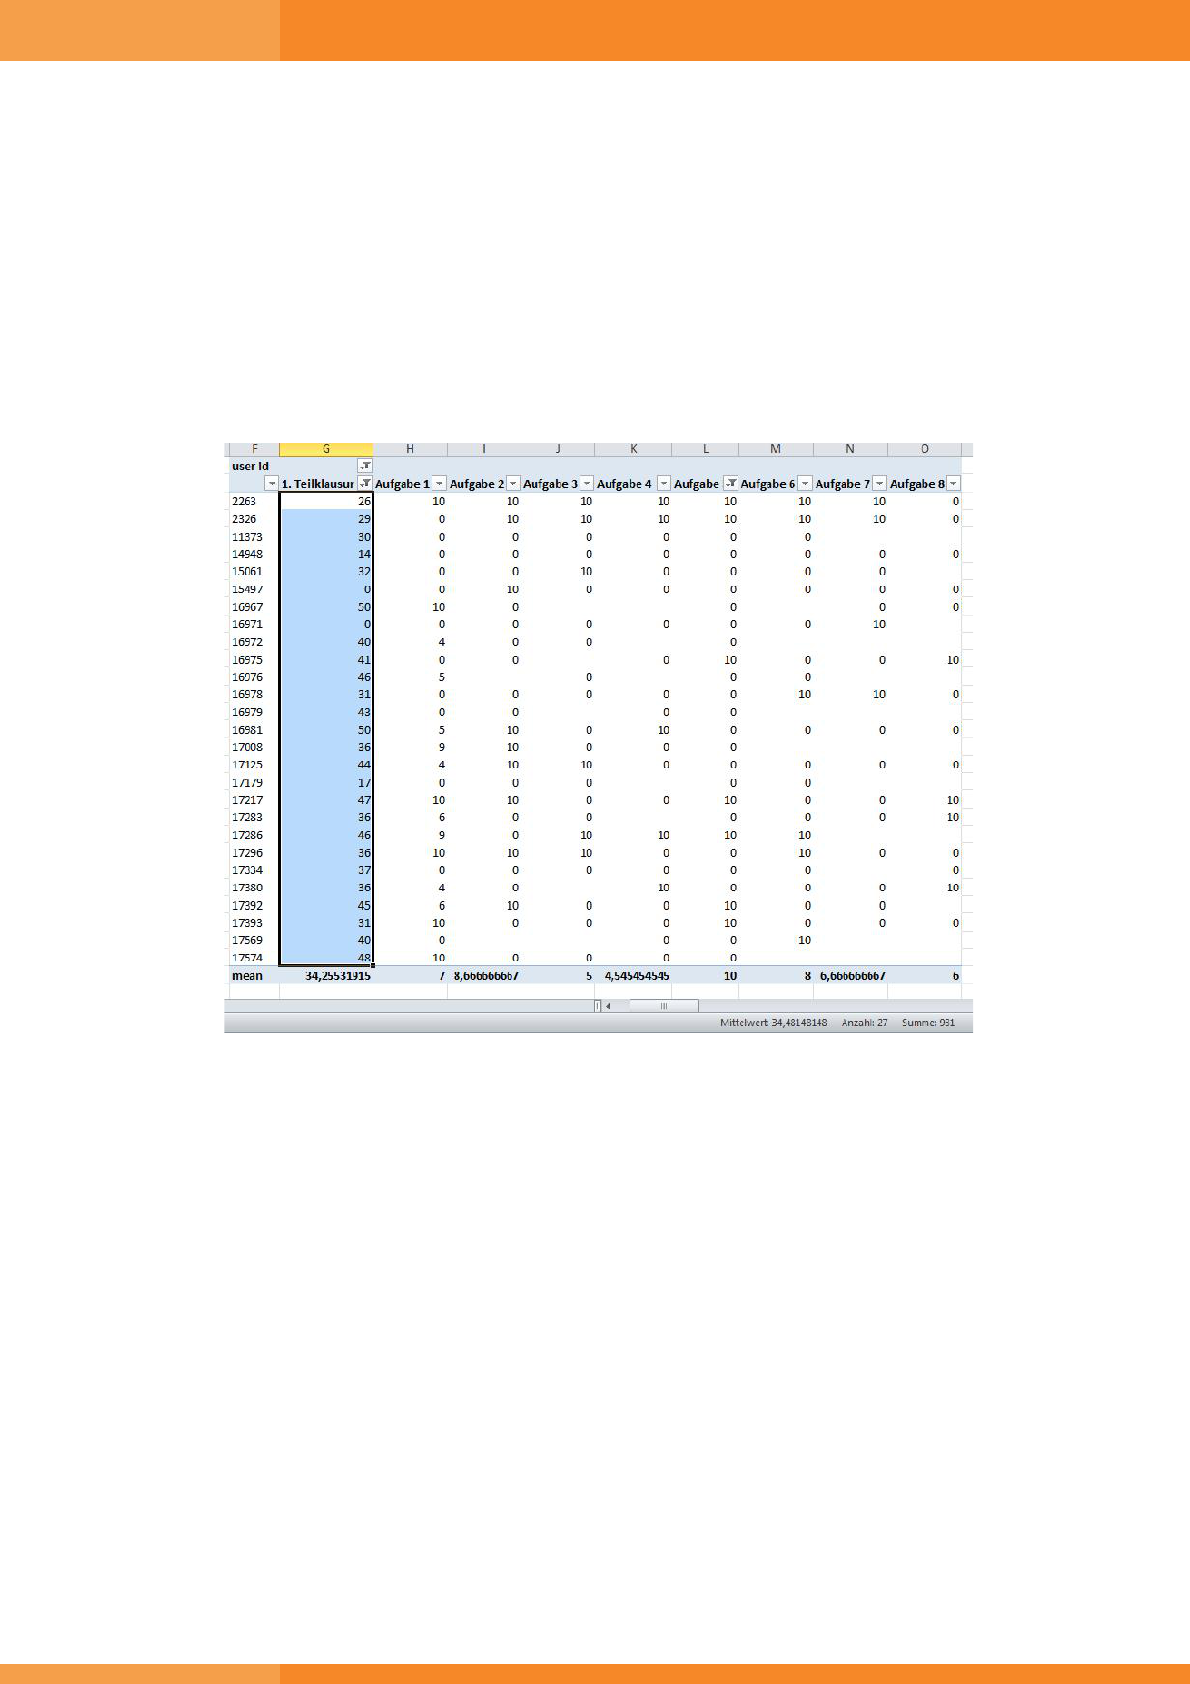
Using an appropriate query we have extracted the table shown in Figure 5, which is similar to the grades table
provided by Moodle except for the anonymised data. The average mark in the first exam, 34.25532915, is
shown at the bottom of the column called '1. Teilklausur', German for first exam. To investigate whether
attempting some self-test has an impact on success, clicking on the top of a particular self-test we deselect the
empty line box. The table only shows the students, who have attempted that particular self-test, here self-test 5.
Selecting all figures of the column '1. Teilklausur' gives the average mark for that subgroup in the bottom line
below the table, here 34.4814818148. This small difference does not suggest any particular impact, contrarily to
the analysis performed on other data in (Krueger, Merceron, & Wolf, 2010). A large difference might suggest an
impact, and should be checked for statistical significance if the number of students is at least 30.
Figure 5: Average Mark in the first exam in general and for students who attempted self-test 5
With another query on our database it would be possible to generate a Pivot Table containing the results of the
two exams and the students who have used other learning materials like slides, past exams or complementary
reading. The impact of using that specific learning material on the final mark can be investigated in a similar
fashion.
Conclusion and Future Work
In this paper we have investigated the usefulness of Pivot Tables to analyse usage data stored by Moodle. For
this purpose, after a short introduction to pivot tables, we have shown an analysis performed on the course
“Formal basics of Computation” taught at the Beuth University of applied science. The analytical processing
shown focuses on use of resources by students and impact of specific learning material, here non compulsory
self-tests, on the final exam.
Working with the Pivot Tables is in most cases quite intuitive and allows a flexible analytical processing of user
data. Though the present surface charts are enough to grasp the trend, their quality is not optimal. Excel 2010
Pivot Tables lack the facility of a nice hit map (or we have not found it yet).

1
st
Moodle Research
Conference
Heraklion, Crete-Greece SEPTEMBER, 14 - 15,
2012
121 |Page
CONFERENCE PROCEEDINGS
The immediate next steps go into two directions. One direction is to conduct more case studies with our partners
to gain a better overview and understanding of the various learning analysation processes that different actors
perform and to establish a kind of roadmap or list of best practices for newcomers. Another direction is to
integrate the export towards Excel facility into the tool LAMA we are developing (Dierenfeld 2012). LAMA is
a web application that users can access from Moodle over a Moodle block. Its aim is to support different actors
to analyse user data from learning management systems. It should be adaptable to and by different kinds of
actors according to their needs or skills and therefore have different modes. For the time being we have
identified two modes: the simple mode for a quick overview, and the mode for actors with knowledge on Pivot
Tables. A challenge is to integrate a mode with data mining techniques that non computer scientists can use in a
correct way. We also pursue work in that direction.
References
Dierenfeld, H. (2012). LAMA - Ein Tool zur Analyse von Nutzerdaten in Lernraumsystemen. Presentation
Moodle Moot 2012, Münster, Germany, March 15-16. http://moodlemoot.moodle.de/ [viewed 26 May
2012].
Graf. S., Ives, C., Rahman, N. & Ferri, A. (2011). AAT – A Tool for Accessing and Analysing Students’
Behaviour Data in Learning Systems. In LAK2011 Proceedings of the Conference on Learning Analytics &
Knowledge, Banff, Alberta, Canada, February 27 – March 01, 2011). ACM New York, NY, USA .
Han, J., Kamber, M. & Pei, J. (2011). Data Mining: Concepts and Techniques. Morgan Kaufmann Publishers.
Hershkovitz, A, & Nachmias, R. (2011). Online persistence in higher education web-supported courses. Journal
of Internet and Higher Education, 14 (2), 98–106.
Jelen, B. & Alexander, M. (2010). Pivot Table Data Crunching: Microsoft Excel 2010. Que Corp.
Krueger, A. Merceron, A. & Wolf, B. (2010). A Data Model to Ease Analysis and Mining of Educational Data.
In Baker, R.S.J.d.; Merceron, A.; Pavlik, P.I. Jr. (Eds.): Proceedings of the 3rd International Conference on
Educational Data Mining. Pittsburgh, PA, USA, June 11-13,. (pp. 131-140).
http://educationaldatamining.org/EDM2010/ [viewed 21 May 2012].
Krueger, A. Merceron, A. & Wolf, B. (2010a). Leichtere Datenanalyse zur Optimierung der Lehre am Beispiel
Moodle. In Kerres, M.; Hoppe, U.; Ojstersek, N. & Schroeder, U. (Eds.): Proceedings of the 8. e-Learning
Fachtagung Informatik Delfi, 12-15.09.2010, Duisburg, Germany (pp. 215-226). Lecture Notes on
Informatics, Springer.
Leony, D., Pardo, A., De La Fuente Valentín, L.,Sánchez De Castro, D. & Delgado Kloos, C. (2012). GLASS:
A first look through a Learning Analytics System. In LAK2012 Proceedings of the Second International
Conference on Learning Analytics & Knowledge, Vancouver, British Columbia, Canada, April 29 – May
02, 2012).
MySQL (2012). http://www.mysql.com/ [viewed 26 May 2012].
Pedraza Perez, R., Romero, C. & Ventura, S. (2011). A Java Desktop Tool for Mining Moodle Data. In
Pechenizkiy, M.; Calders, T.; Conati, C.; Ventura, S.; Romero , C. & Stamper, J. (Eds.), Proceedings of the 4th
International Conference on Educational Data Mining,Eindhoven, the Netherlands, July 6-8, (pp. 319- 320).
http://educationaldatamining.org/EDM2011/ [viewed 21 May 2012].
Romero, C. & Ventura, S. (2010). Educational Data Mining: A Review of the State-of-the-Art. IEEE
Transaction on Systems, Man and Cybernetics, Part C: Applications and Reviews, 6, 601-618.
Zafra, A. & Ventura, S. (2009). Predicting Student Grades in Learning Management Systems with Multiple
Instance Genetic Programming. In Barnes, T., Desmarais, M., Romero, C., & Ventura, S. (Eds.),
Proceedings of the 2nd International Conference on Educational Data Mining, Cordoba, Spain. July 1-3
(pp.309-318). http://www.educationaldatamining.org/EDM2009/ [viewed 21 May 2012].
Acknowledgements
This work is partially supported by the “Berlin Senatsverwaltung für Wirtschaft, Technologie und Frauen” with
funding from the European Social Fund. We thank all our partners for their cooperation, particularly André
Krüger and Benjamin Wolf for all their advices and help concerning Moodle.
